
100+ Charts & Commentary on all major Markets — for your weekend reading.
“Don’t start the week without it”

Stocks moving towards a climax — are we there yet?
Looking through the evidence…
KEY TOPICS COVERED
One month ago:
In today’s report:

Stocks moving towards a climax — are we there yet?
Challenging every consensus view out there: “You ain't seen nothing yet”. Strap yourself in…
If we look in the right places, you can see a turning point in sentiment — but it’s NOT what everyone is thinking…
What’s the path of *maximum* pain? (continued)
As always: focus on what stocks are doing — and let the *market* tell you what’s next.
Updating signals for a *turning point*: what I’m watching closely to reduce exposure for the first time in this rally. One step ahead of the crowd, but not more than one step.
Adding scans & updating targets: assessing (1) model signals, (2) market behavior, (3) individual stocks.
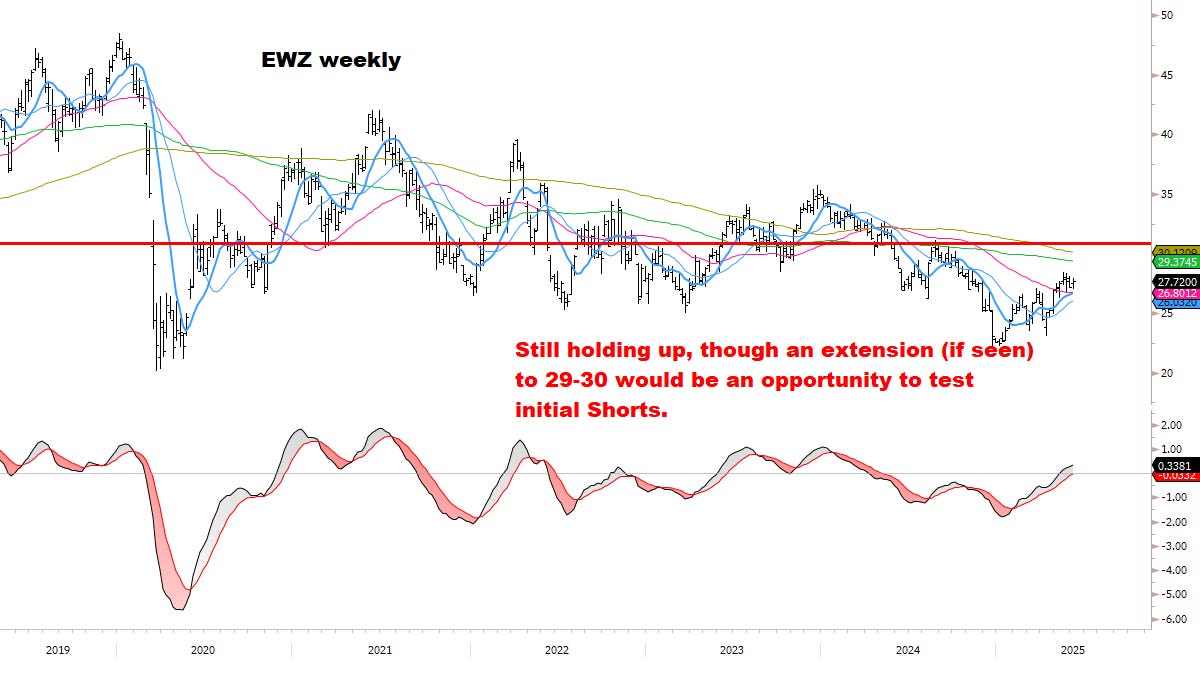
Scanning for weakness / SHORTS…
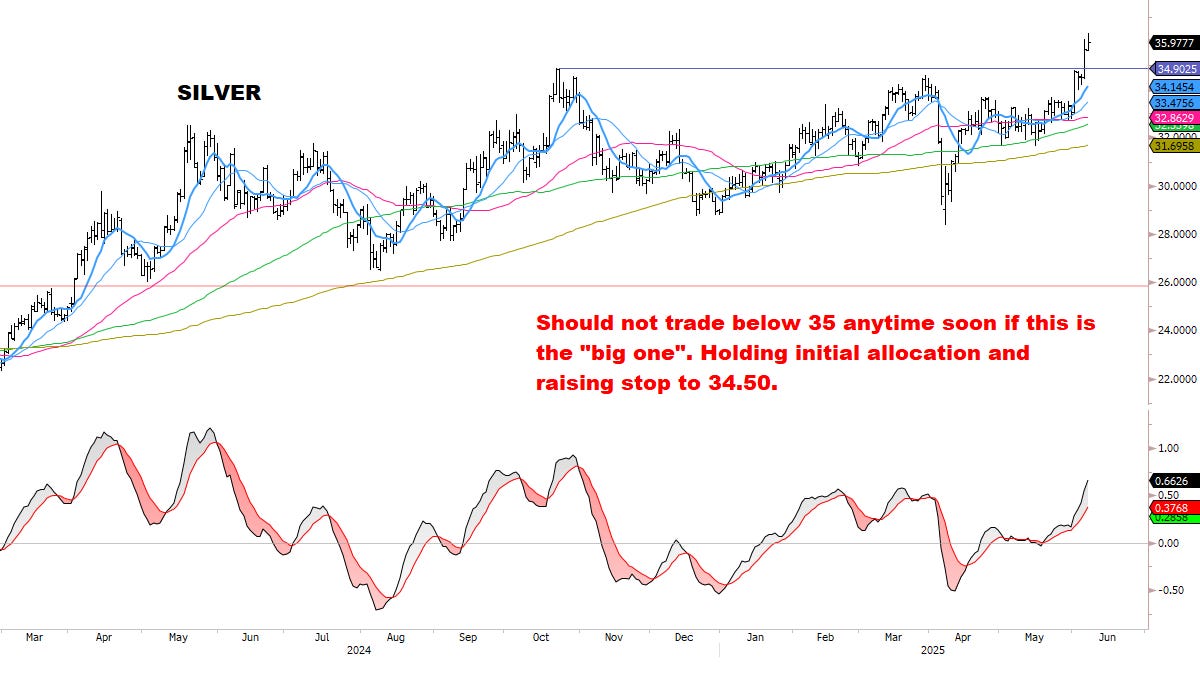
METALS — A classic extension unfolding?
FX & RATES — Big macro shift potential (continued).
Dollar: a major opportunity — watching closely. (*Trend picture coming together.)
Bonds moving “on schedule” — another BIG inflection point?
Open Portfolio & Updated Plan
Emphasizing: an open mind could be the difference between a great summer and an average one. It’s a strong year and I intend to keep pushing — eyes on the next big move.

CORE MODELS & DATA
STOCKS
ETF Investors are finally back — with plenty of room to chase higher.
*My UPDATED base case is that flows will soon ACCELERATE —for all the key reasons previously discussed— **look for a full update on this in Section 2.
What is the path of maximum pain? As before, if history is a guide the market should grind higher over time, leaving sellers behind. Pullbacks could be limited in scope. This framework continues to be validated by the market.

Institutions remain *heavily* underinvested —this is yet another potential major driving force in our *base case* bullish scenario— (“strap yourself in”):

Core Risk Models continue to work off the overbought condition even as Stocks extend higher.
*As discussed on May 24, historically strong bullish factors led to the model consolidating sideways, rather than an immediate large correction.
*This framework continues to be validated by the market, and remains my base case for now.

We continue to track this closely for an ideal top into late summer:
As discussed May 24:
“If the sequence continues, dips should remain shallow for the next few weeks, with the market in a SLIGHT upward bias. Overall, a *perfect environment* for stock-picking. *Also: not yet an optimal setup to Short Indexes or buy Volatility.”
*This framework continues to be validated by the market, and remains my base case for now.

As always: an open mind could be the difference between a great summer and an average one. It’s a strong year and I intend to keep pushing — eyes open to the next big move.
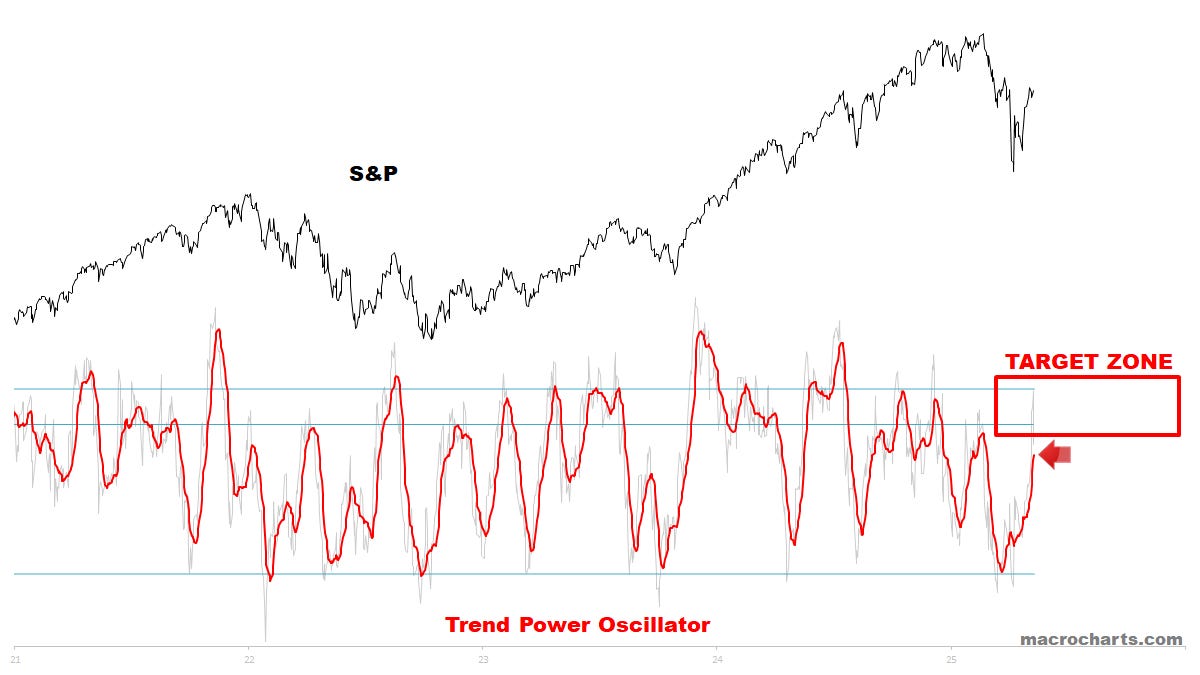
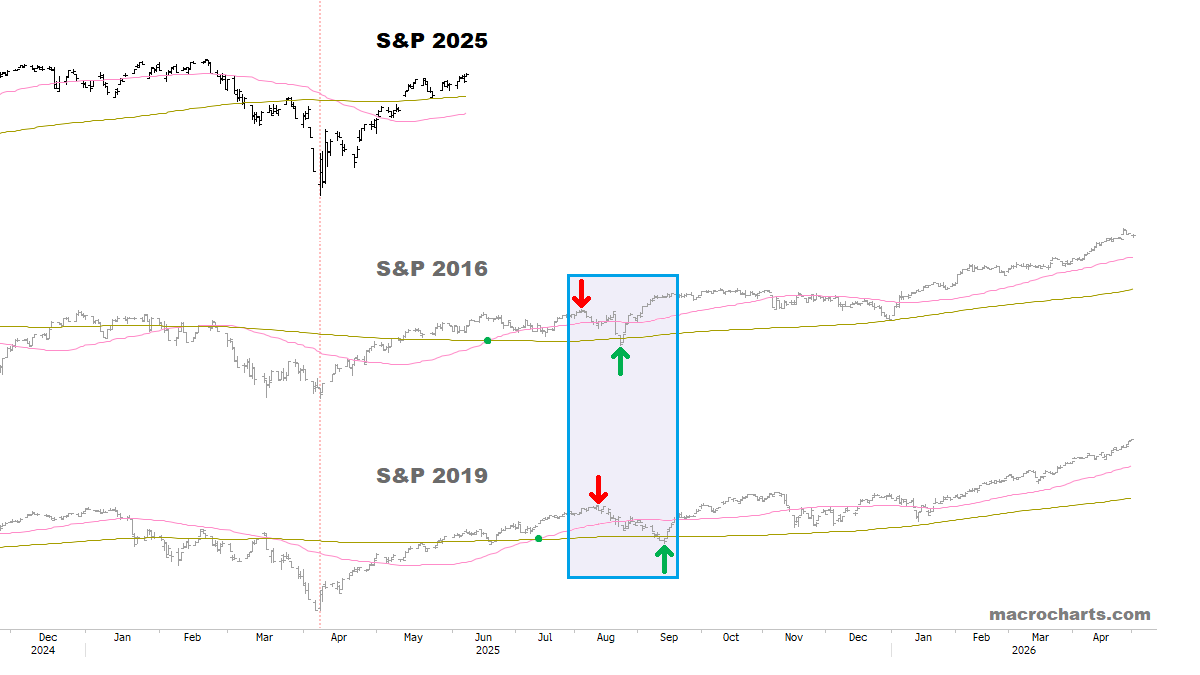
Trend Oscillator is unwinding: signaling the trend becoming more gradual (*the 2016/2019 base case) in our view. Continue to think the risk of a large correction remains relatively low at this time.

Master Options Flow Model is in topping range: as discussed on May 24, reiterate the expectation here is for the market to advance more gradually / bleed premium:

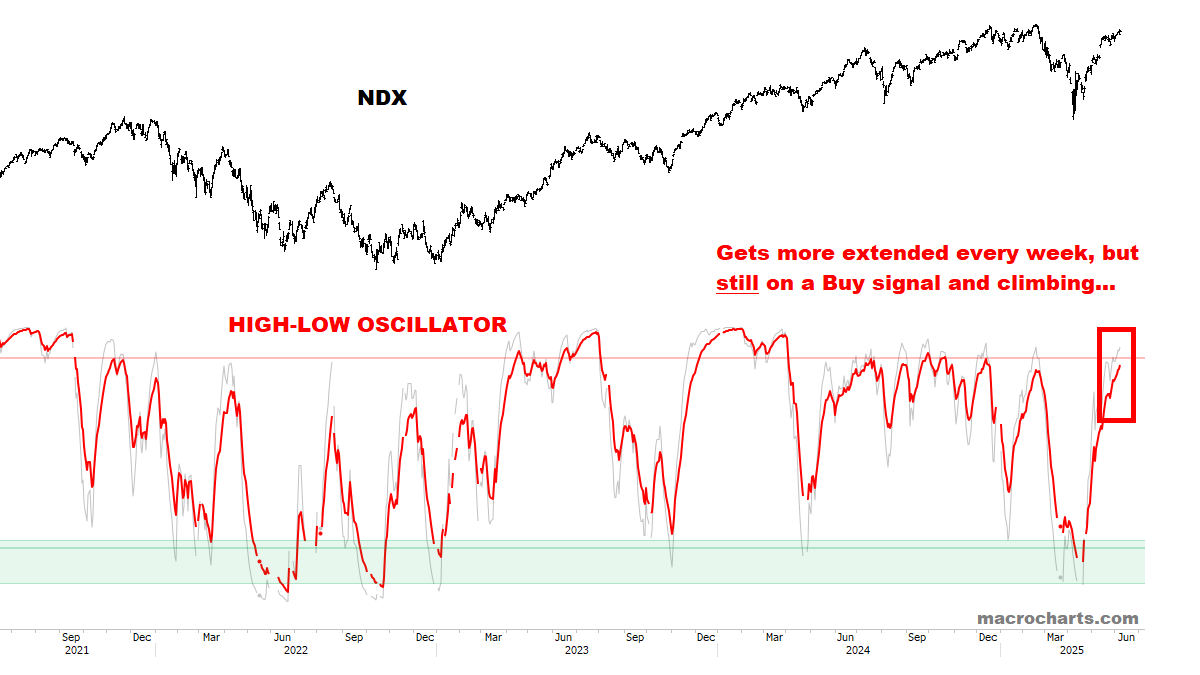
High-Low Oscillator remains “on schedule” as discussed in recent reports — with room to extend higher into ideal overbought range. (*See updated Table below)

Still think most (or all) of the red box could make new highs before a bigger correction is seen.
*Prepare for speculation and more importantly FLOWS to ramp up aggressively as new highs accumulate (*full discussion in SECTION 2):
“Pedal to the metal” (strap yourself in)…

MACD Profile remains on Tactical Sell for the S&P — but NDX has repaired itself and flipped back to a Buy… this is more evidence of a melt-up scenario unfolding:


MACD Sell Signals are spiking — but as before, trend context remains essential. Large corrections are less likely under these circumstances.

For reference: here is another look at 2016 / 2019 — note when the first spike triggered. *If repeated, the pattern points to a top in late July / early August — the same time frame we continue tracking with interest — and could *likely* see another round of Core Model Sell signals to help identify the summer top:


Stocks with a Bullish Cross are turning UP after resetting back to neutral — this is Bullish and sets up a potential extension, with some recent examples shown below:

Long-term Breadth shows the Bull Market slowly recovering its strength:

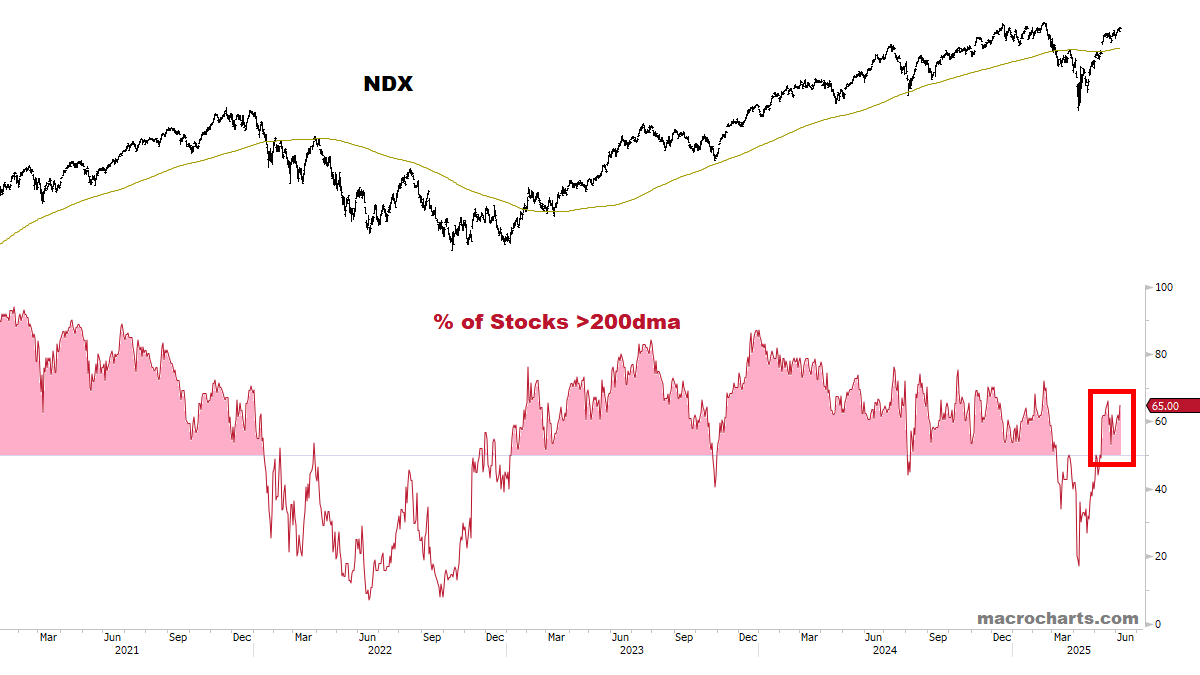
Intermediate Breadth remains constructive at the high end of the range:

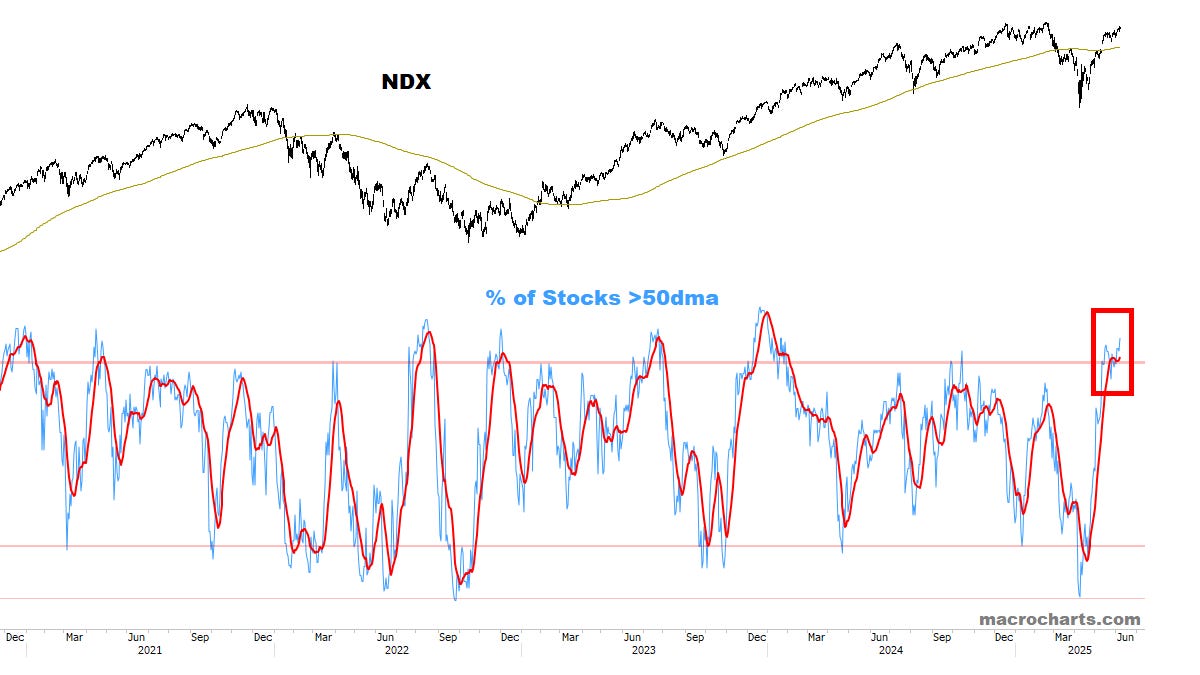
Short-Term Breadth continues to unwind, and is almost back to neutral:


Summation Index is on the cusp of triggering a NEW Buy signal — this remains classic Bull Market action:

CTA Equity Trend positioning is still rising and not extended yet:

Option Skews aren’t stretched, considering S&P is nearly back to its all-time high — overall the odds of a major top remain low:

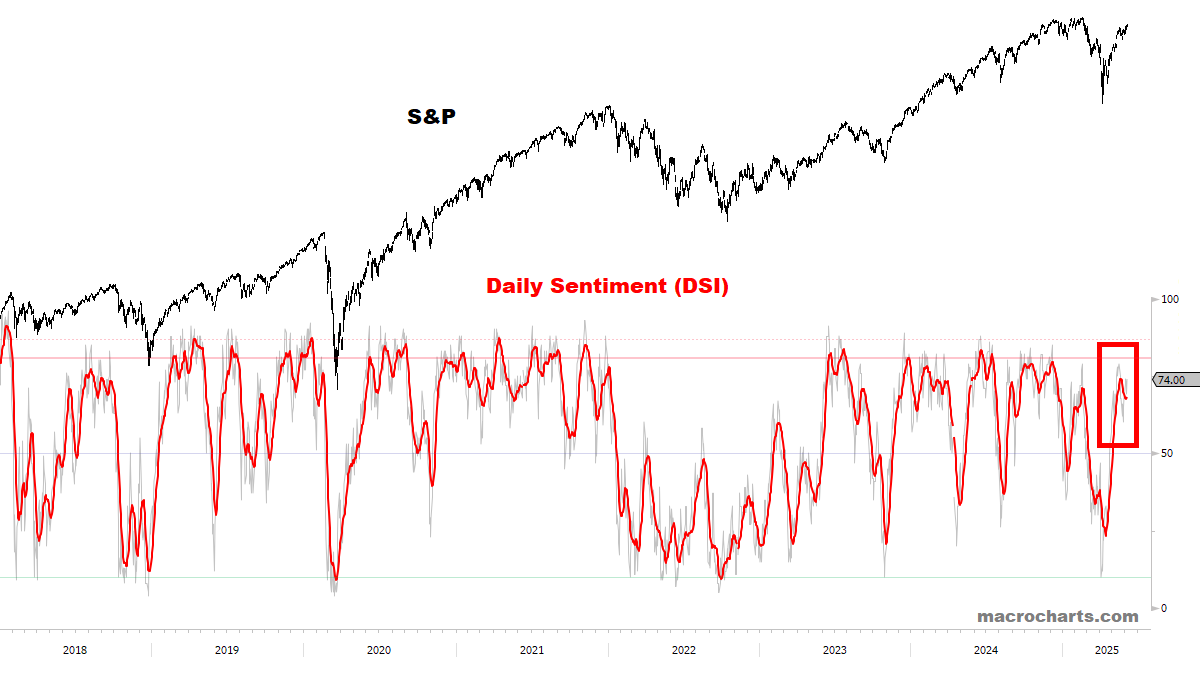
Stock Market Sentiment could go *much higher* from here if a summer melt-up is unfolding (base case):

VIX Sentiment is way too high relative to VIX, which is now in “full-melt” mode. VIX Sentiment should be *at least* 15-20 points lower here — and still has room to reach low teens, as we’ve been leaning for weeks. My targets remain much lower:

VIX continues to display classic Bull Market behavior.
On track to ideal target (low/mid teens) for late summer:


DOLLAR
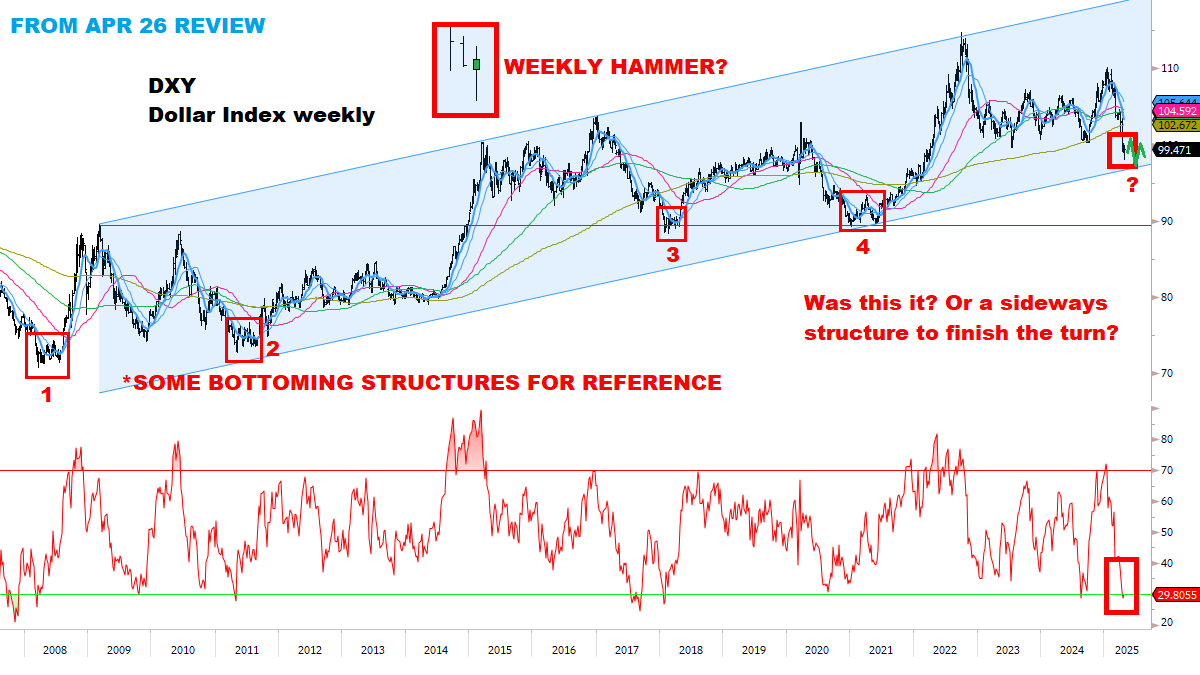
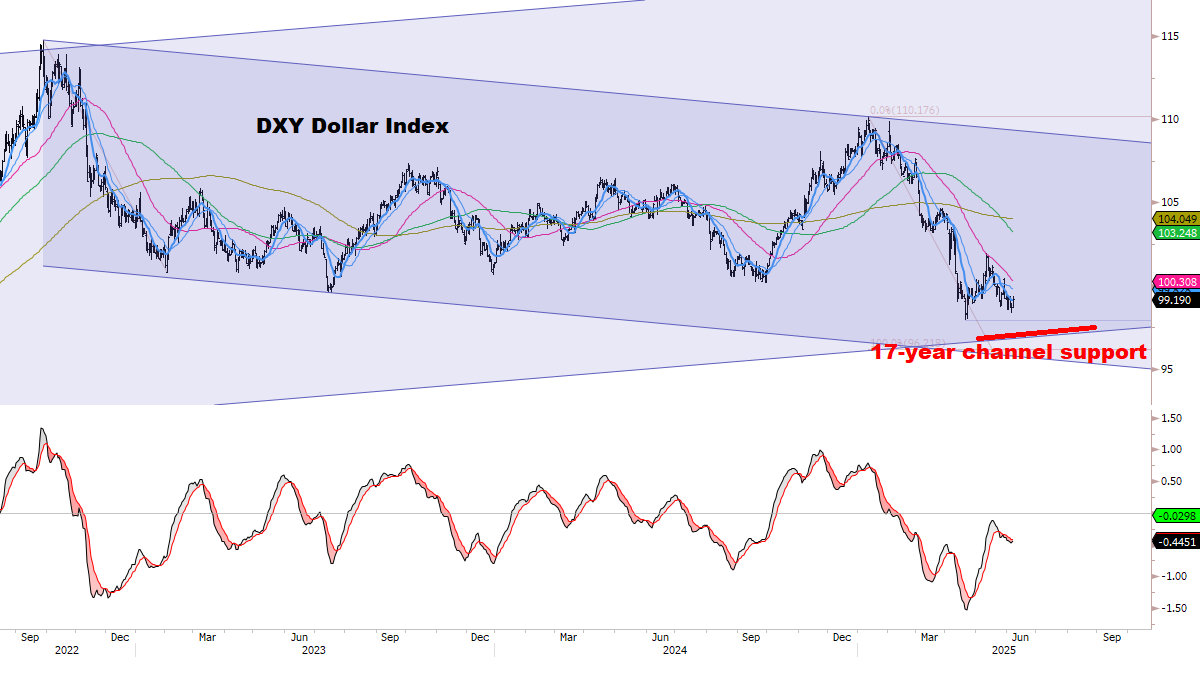
The Dollar remains at a critical juncture:
CTA Dollar Trend positioning is almost fully oversold again:

Dollar Sentiment remains the potential missing link for capitulation:
1. Sentiment made *yet another* new low this week, even though DXY is HIGHER than April.
2. At this rate even if the Dollar drops a mere 1-2% sentiment would likely capitulate.
3. This would *perfectly* match our double-bottom scenario at major chart support (see chart later in this section).

Dollar Net Short Positioning was reduced slightly this week, and remains quite negative:

A small drop may be enough to produce another big oversold signal — and complete the bottoming structure:


RATES
CTA Rates Trend positioning continues moving to higher Bond yields:

Bond Sentiment still shows a clear turn down — base case remains a test of range lows:

TLT buyers remain vulnerable to disappointment after another round of aggressive buying — a recurring pattern with mostly negative results since 2021 (curiously, this behavior never occurred before 2021).

PRECIOUS METALS
CTA Gold Trend positioning is attempting to roll up from a minor dip:

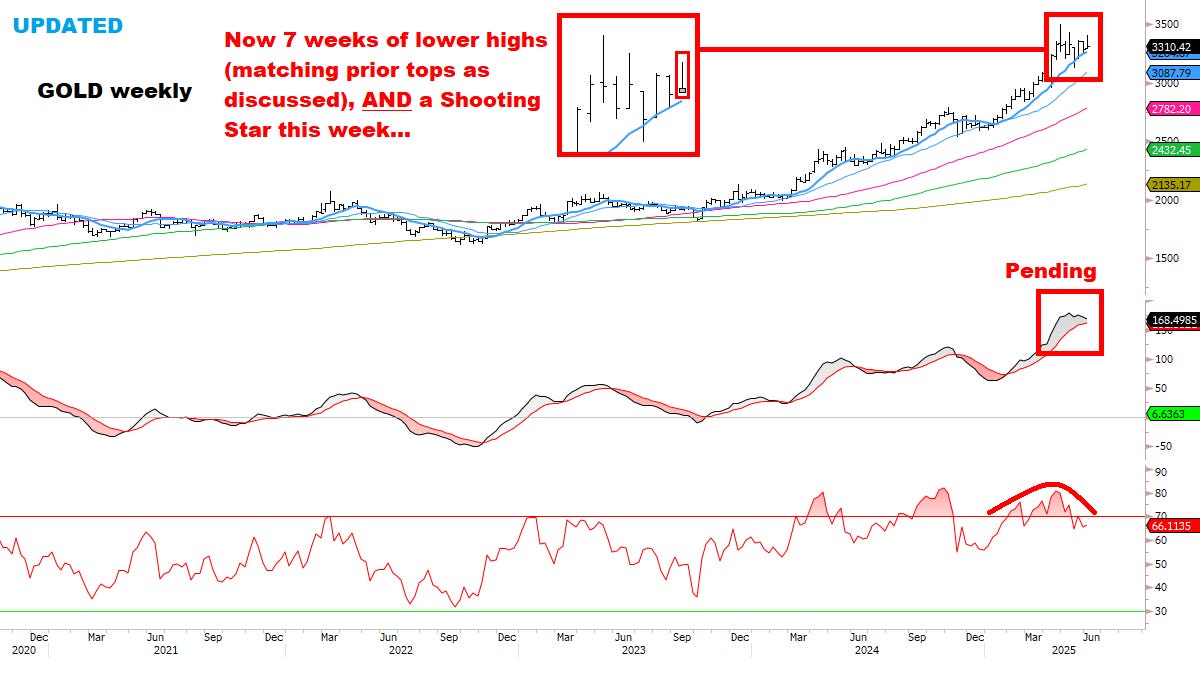
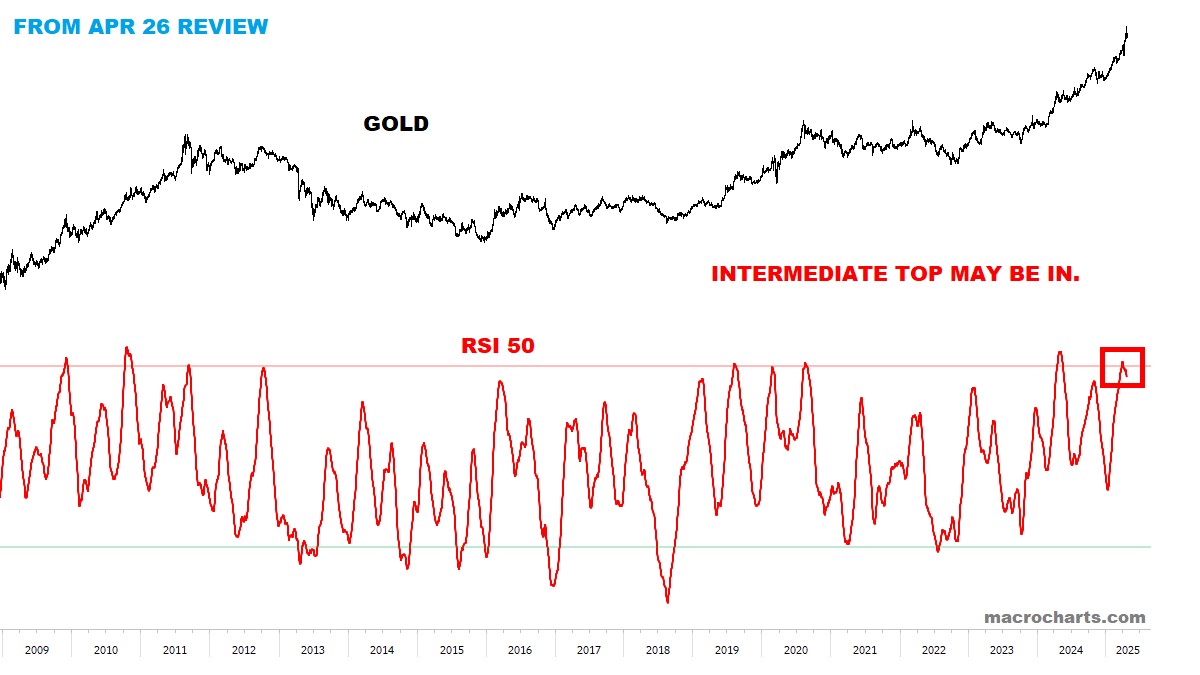
Gold’s bigger picture continues to raise some concern — monitoring:

Gold Sentiment remains stuck in a range — not much of a signal either way:

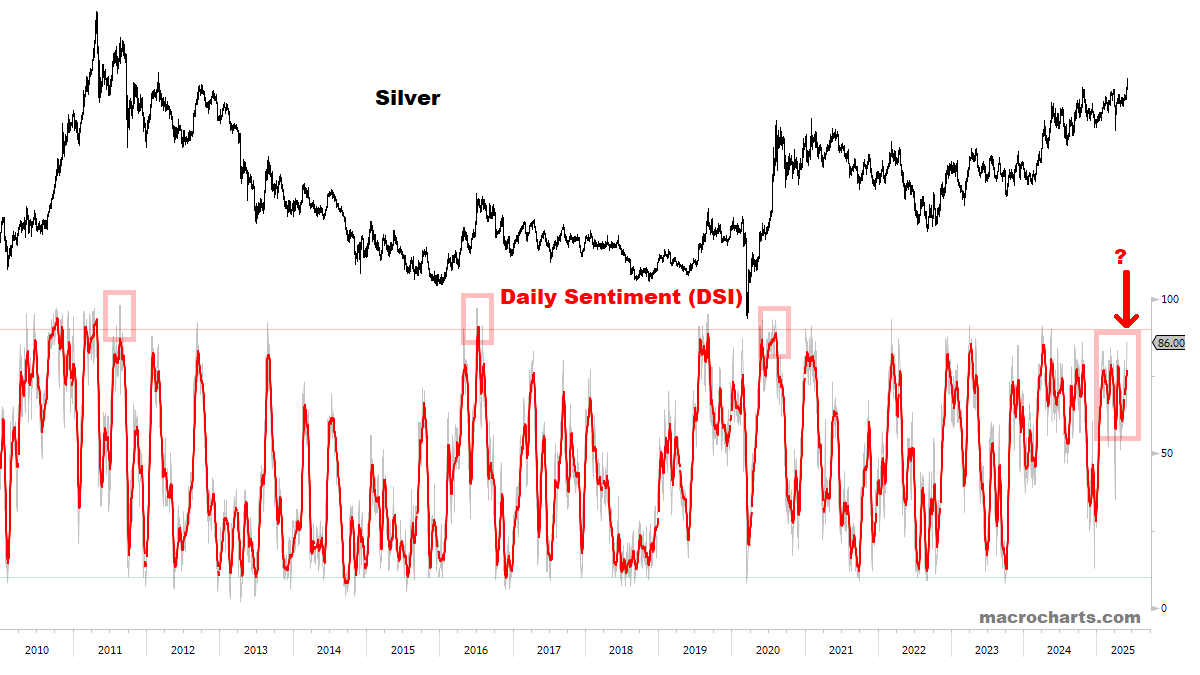
Silver Sentiment is climbing rapidly (as it should be) — and MAY become a tactical concern IF it gets above 90 in the next few weeks. *We’ll send an update to Subscribers in a Post/Thread as this develops.
*For new subscribers, three charts showing “how we got here”:
Gold turned down in April from a historic overbought signal. Previous peaks led to negative 3-6 month performance:
Global Gold ETF Flows turned down from record levels — in the past, buying spikes & exhaustion led to some big tops.

From April 23 update: at the April 22 high of $3500, Gold was almost 30% above its 200dma (horizontal blue line) — matching some big blow-offs in history.

KEY TECHNICAL CHARTS
A QUALITATIVE ASSESSMENT (CONTINUED)
On April 30 in “What’s Next For Stocks?”, I wrote:
In a Bull *or* Bear Market rally, the market rewards disciplined, patient investors that look for strong risk/reward setups (Long the leaders on the way up *and* Short the laggards when rally participation shows exhaustion).
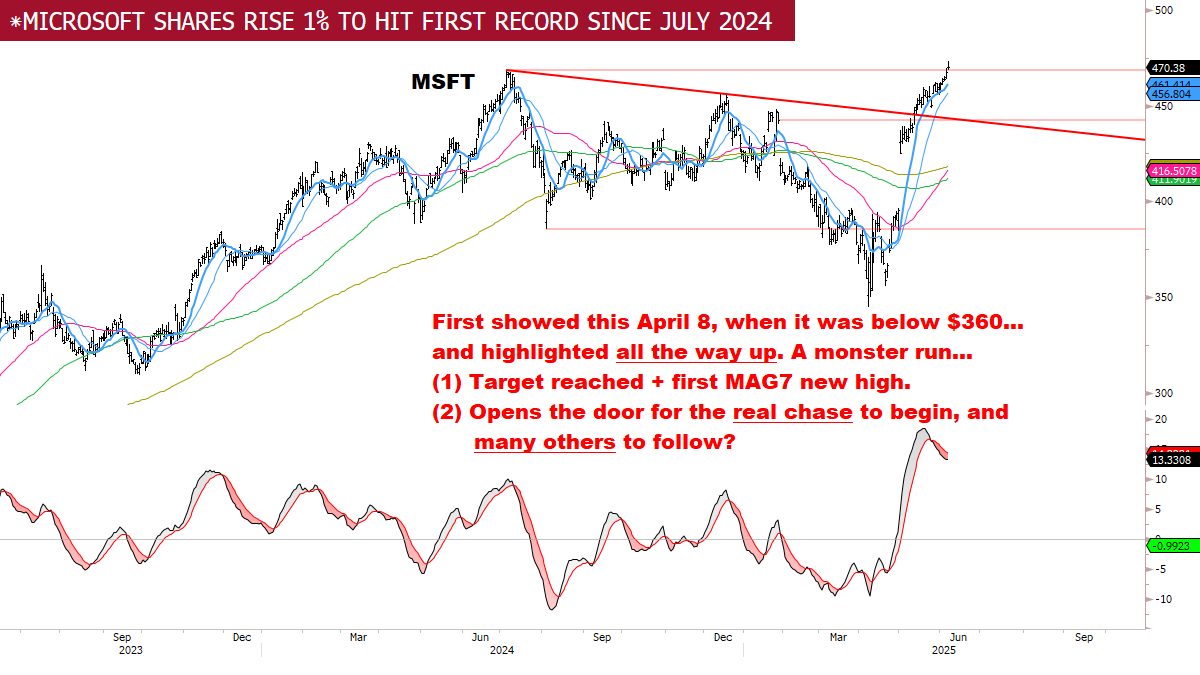
Quality names tend to lead the initial rally, while investors continue to doubt how far the rally can go. (*There are many strong setups currently as discussed — and evidence continues to build in this direction.)
But inevitably, at some point in every rally, the wall of worry finally crumbles and even the garbage gets bought.
This extreme risk-seeking behavior is fueled by two forces: performance-chasing, and general FOMO taking over.
In other words: all stock rallies typically end the same way: (1) Looking around today, quantitatively and qualitatively I don’t think we’re quite there yet. (2) I also think it will be a much different market picture in a few weeks’ time.
Stocks moving towards a climax — are we there yet?
(1) Challenging every consensus view out there: “You ain't seen nothing yet”. Strap yourself in…
(2) If we look in the right places, you can see a turning point in sentiment — but it’s NOT what everyone is thinking…
Here’s what I see:


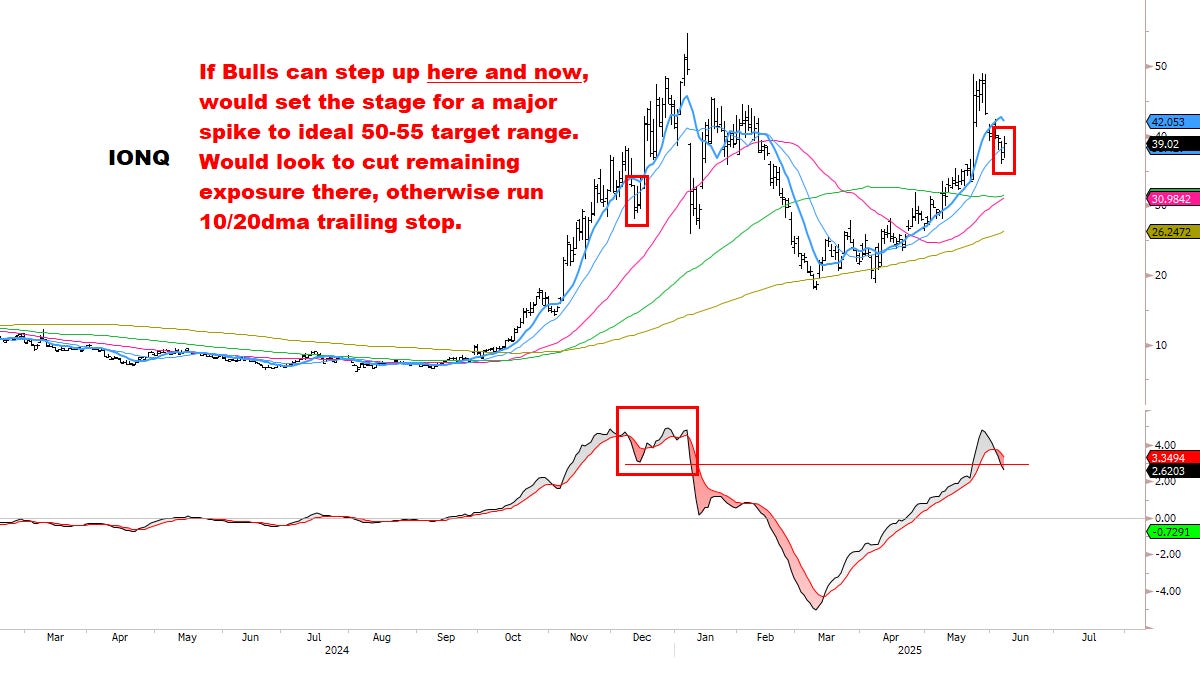
Extreme High-Beta *starting* to move (✅check), High Short-interest moving (✅check), Low-Quality moving (✅check), plus some *early* evidence of “bottom-of-the-barrel” going as well (✅check).
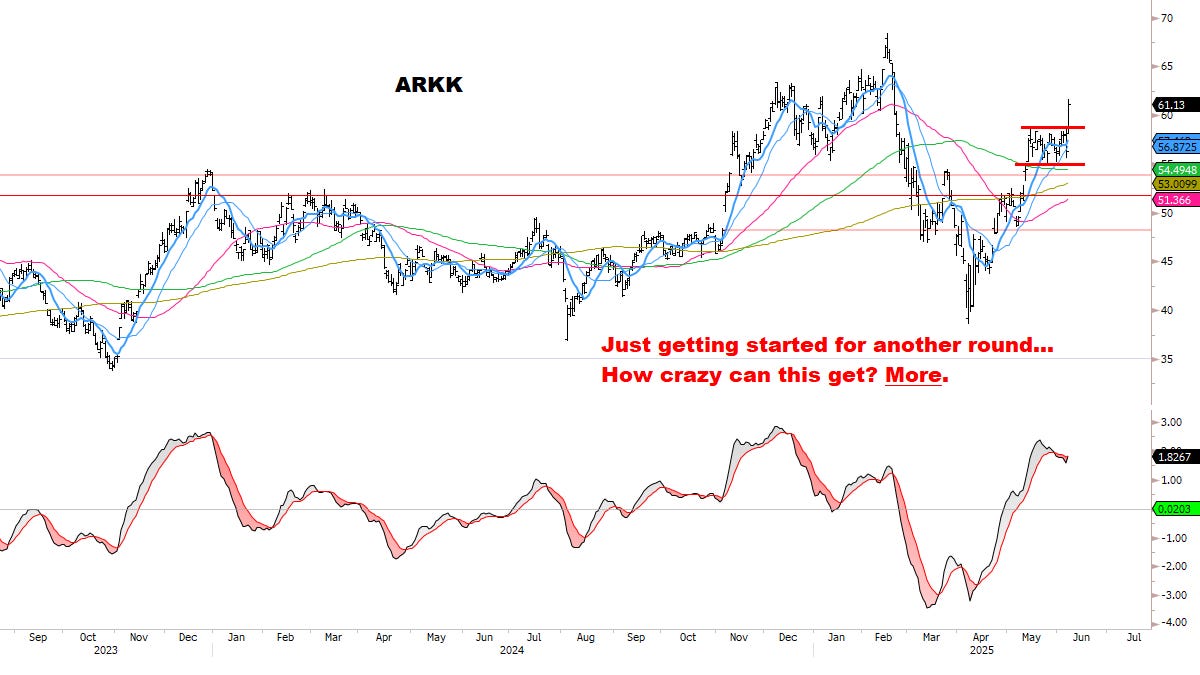
More speculative names which are getting attention:


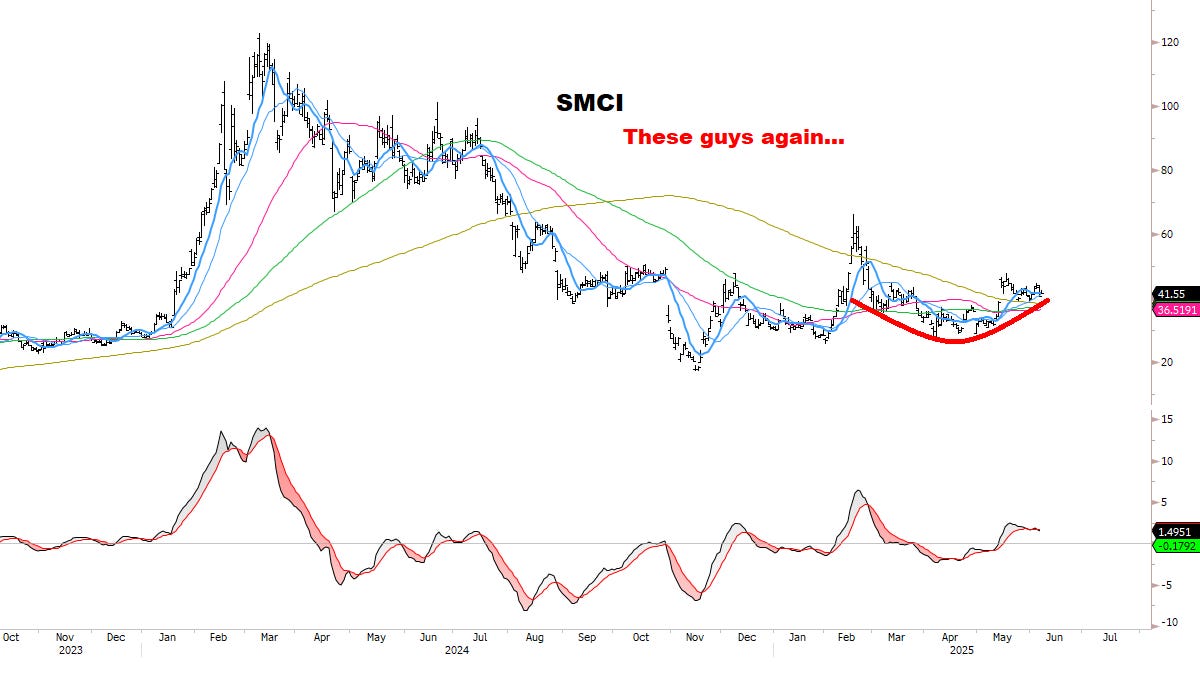

Looking through the stack, you can see the early stages of an acceleration in sentiment — which eventually looks headed to pure & uncontrolled speculation…
So: how much more is there?
Well, many charts have room to go vertical… that’s just what they do when real speculation kicks in.
And it’s important to note that TRASH stocks are not trading “FULL TILT” yet (⬜pending). One of those things which takes time… but you’ll DEFINITELY know it when you see it. We’re not there yet — but stay tuned.
As always: focus on what stocks are doing — and let the *market* tell you what’s next:
Stocks closed at the high of the week (again).
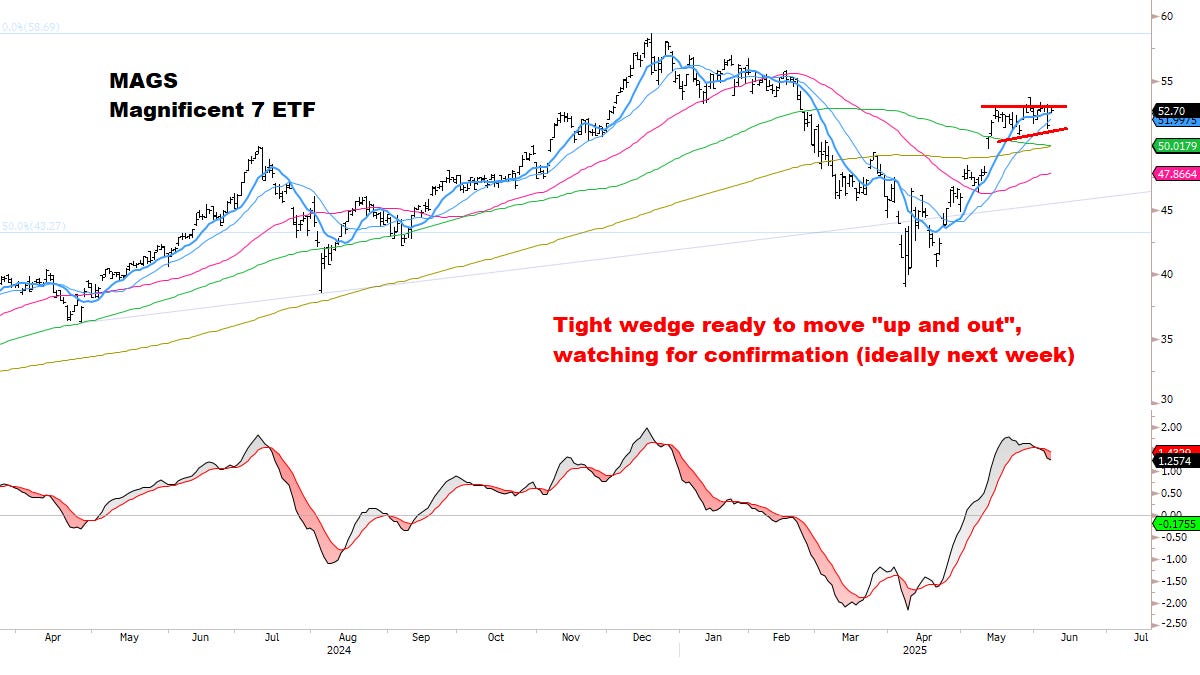
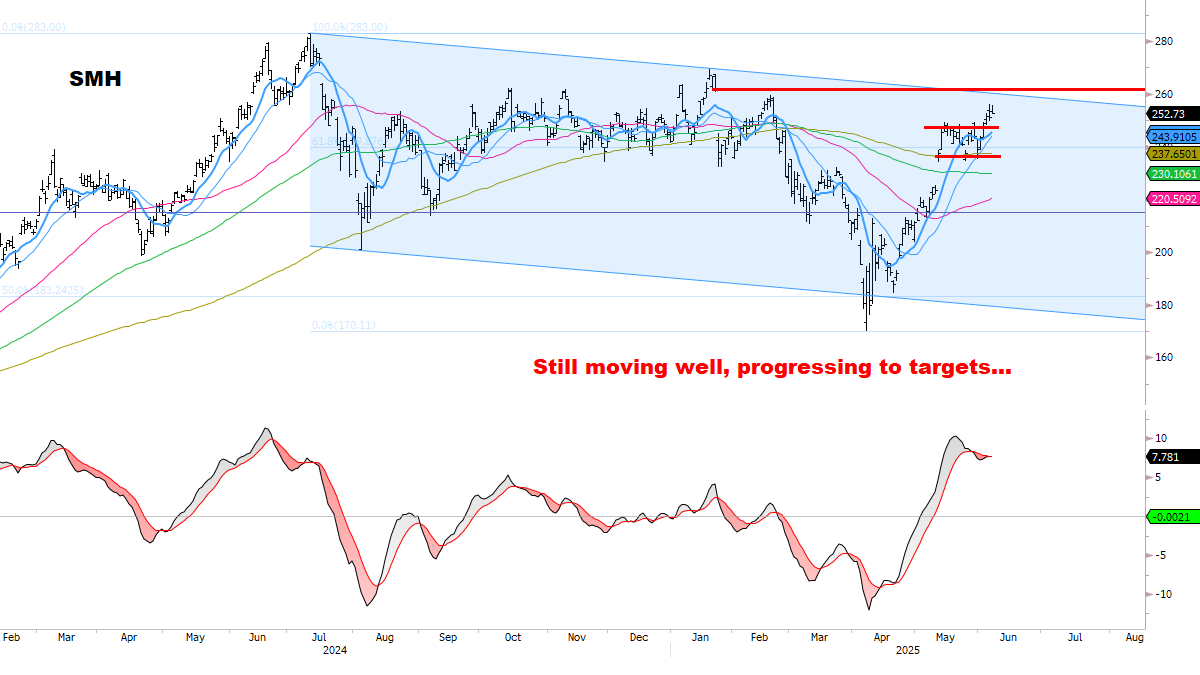
Sectors & Groups which led: #1 Semiconductors, #2 Biotech, #3 Comm Services, #4 Russell, #5 Technology.
Difficult to build a top while these areas continue to lead the market AND *move in synch*.
Uptrends remain intact, with no bearish reversals in any major Index.
VIX and Credit Spreads continue trending DOWN.
Max pain scenario remains: low-volatility grind to new summer highs.


Meanwhile:
Barron’s: “The S&P Just Hit 6000. Start Worrying.”


Updated Stocks Scan:
Through the end of May 2025, the average stock in our Core Watchlist is up +40%, with a few almost doubling — a strong outperformance relative to the market.
As before, focused on: Stocks meeting strict criteria for (1) relative strength, (2) improving momentum, (3) defined risk. We’ll keep building on this list as signals develop.
SCAN: S&P, NDX, Consumer Discretionary, Semiconductors, Speculative/High-Beta.
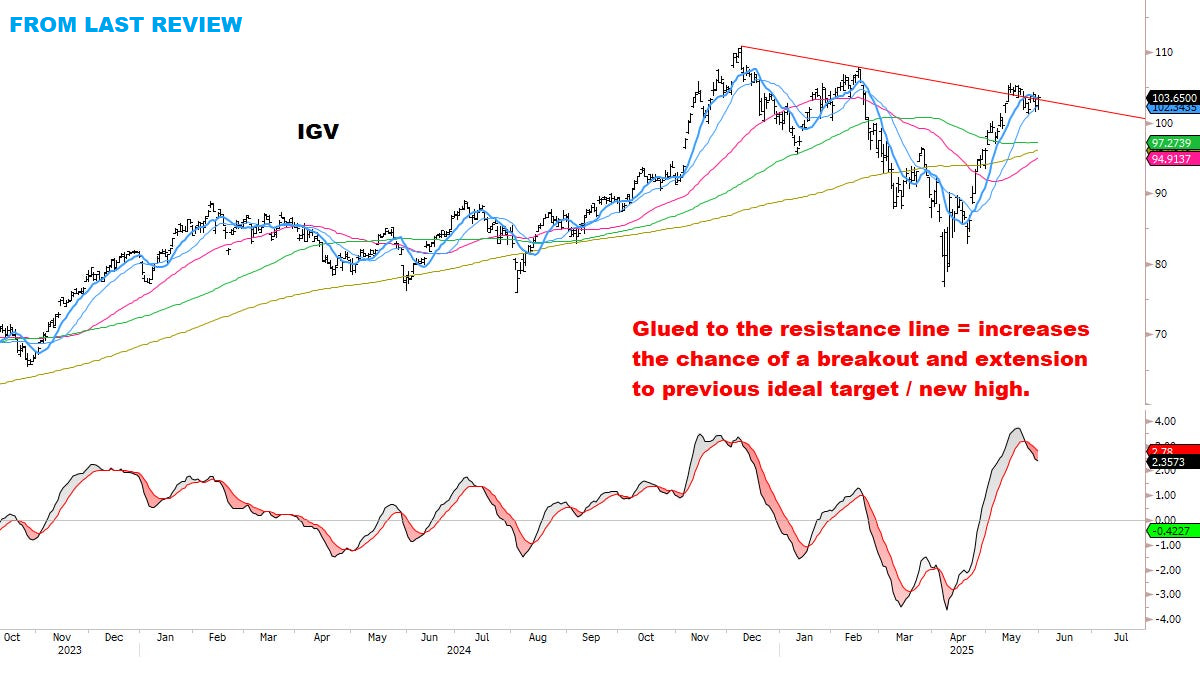
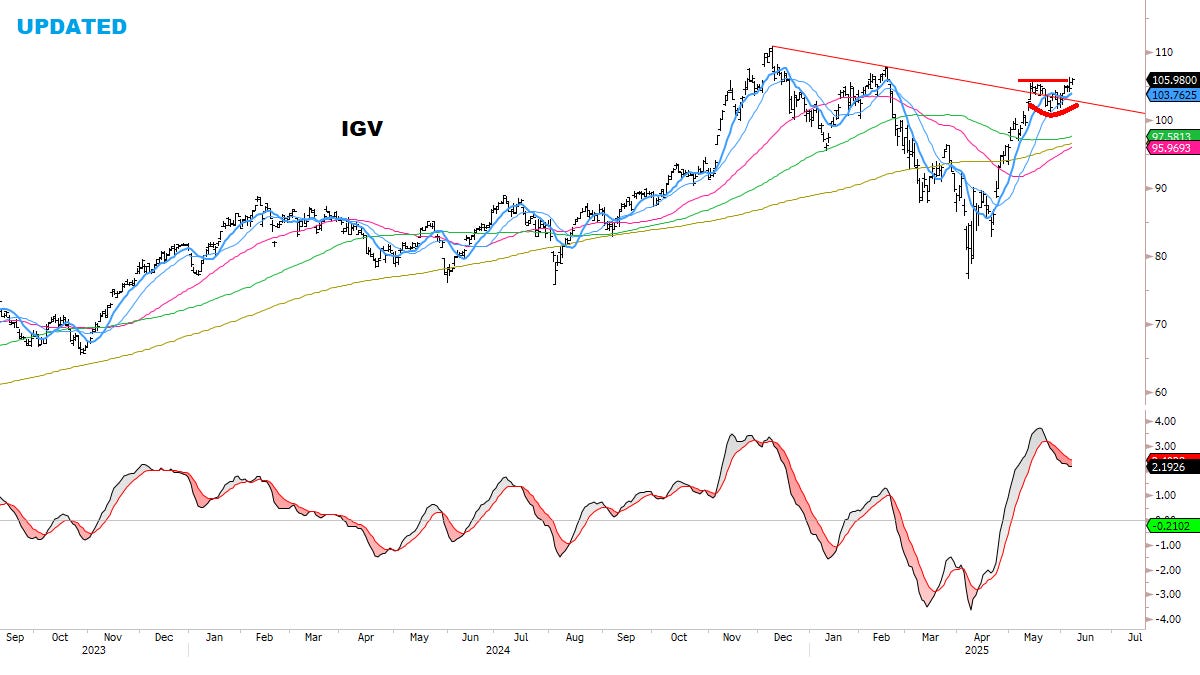
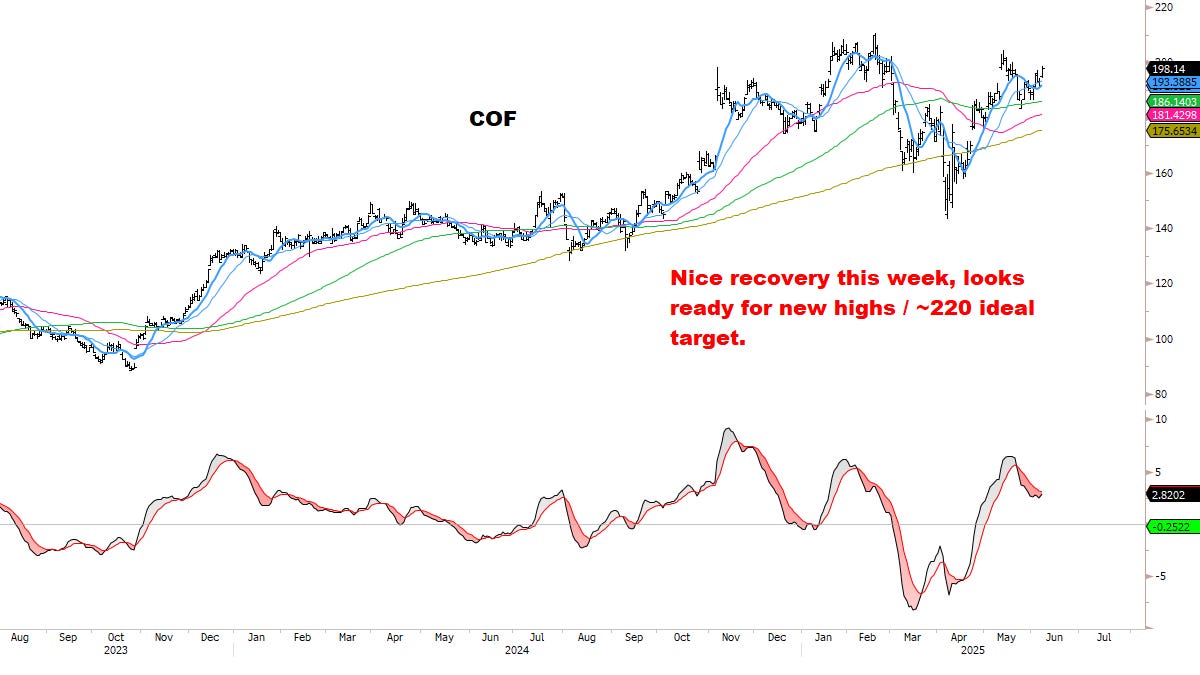
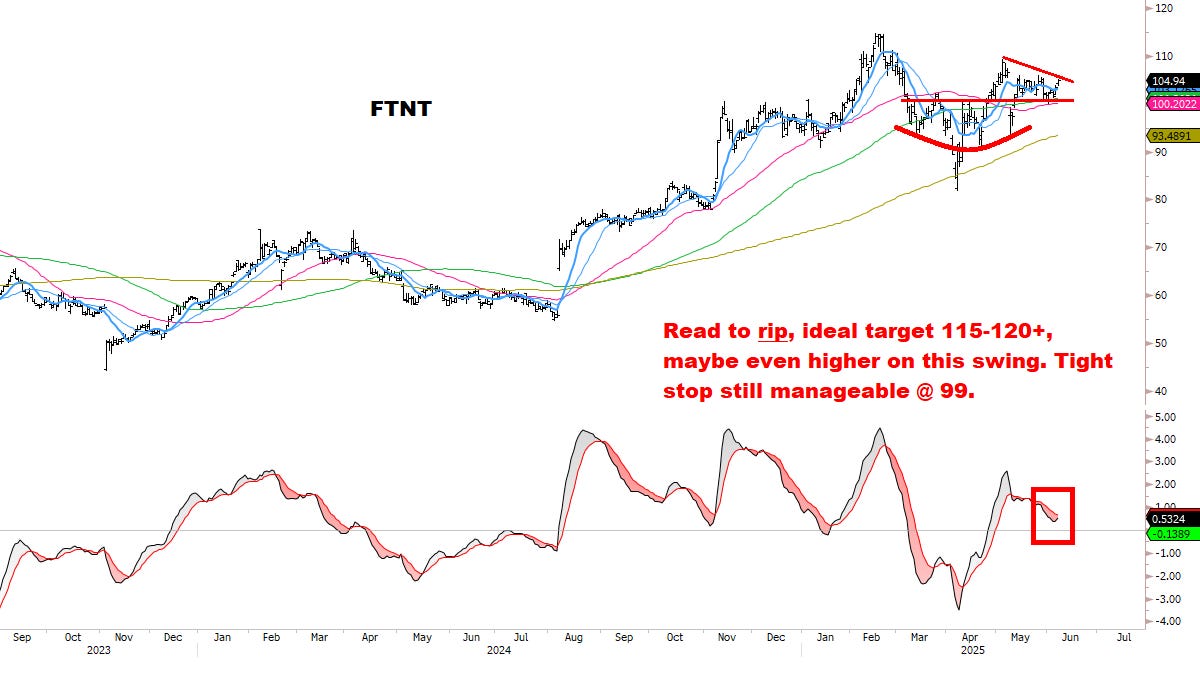
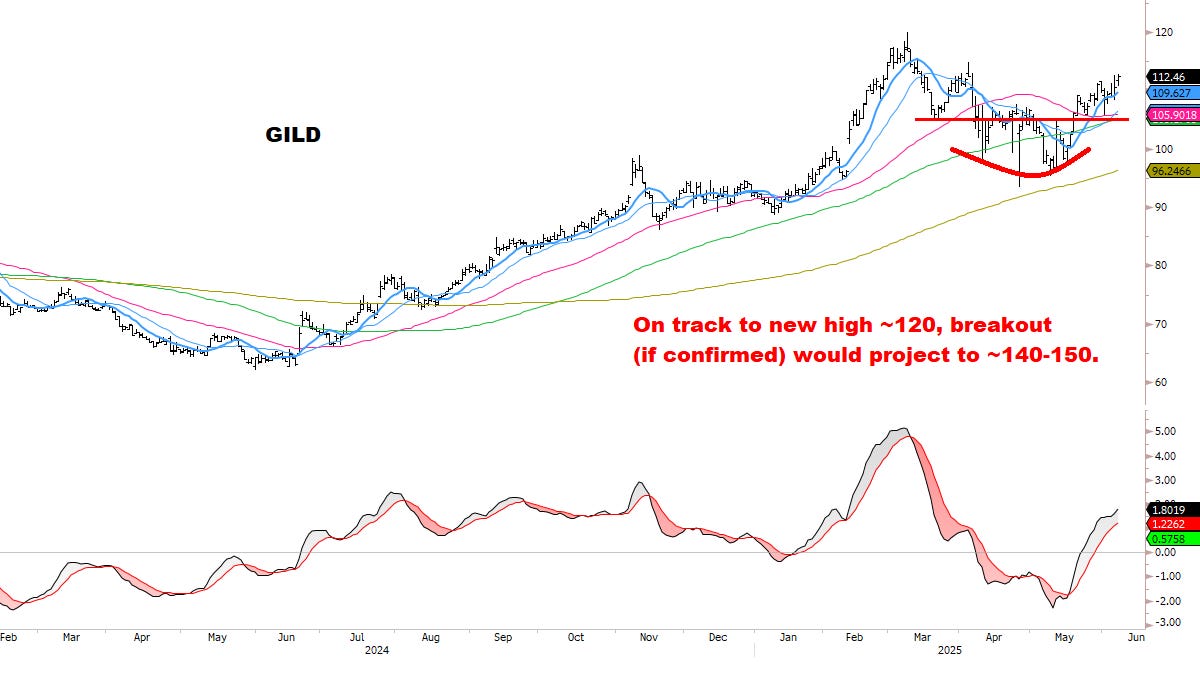
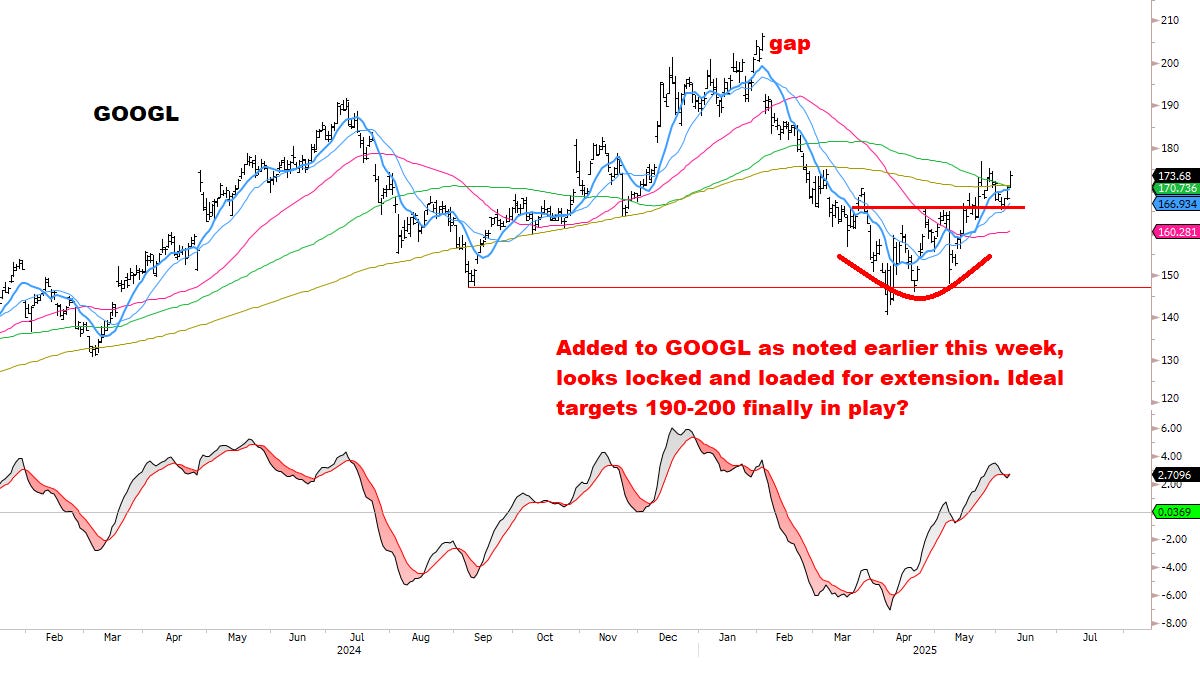
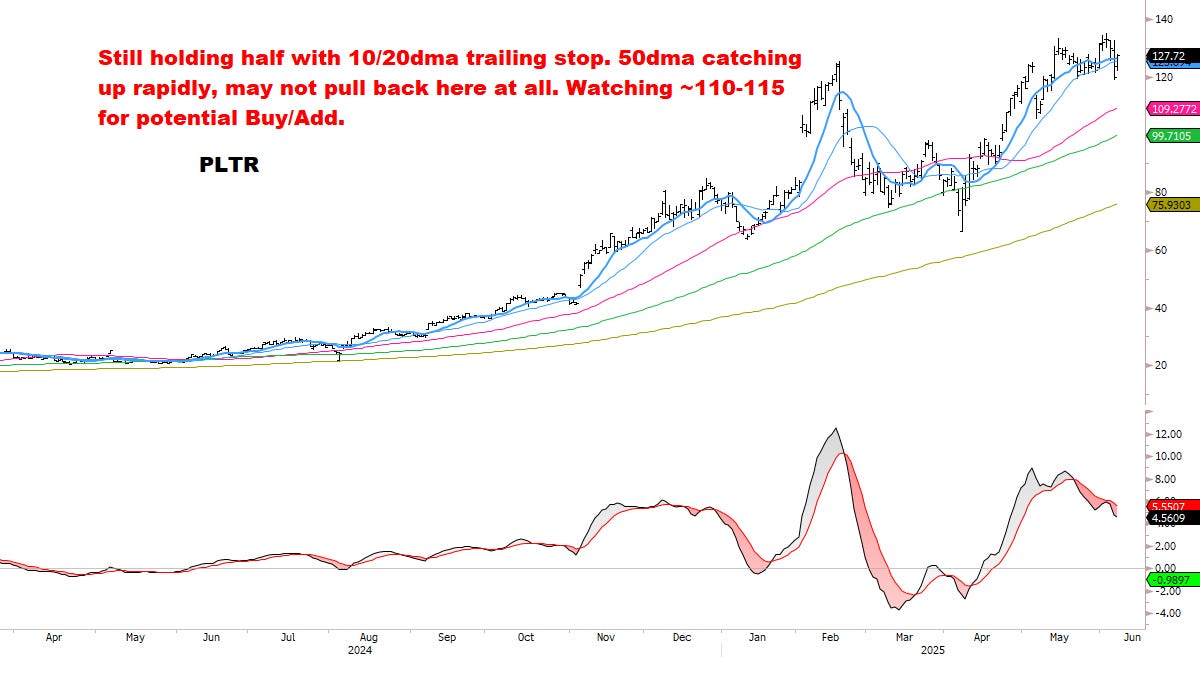
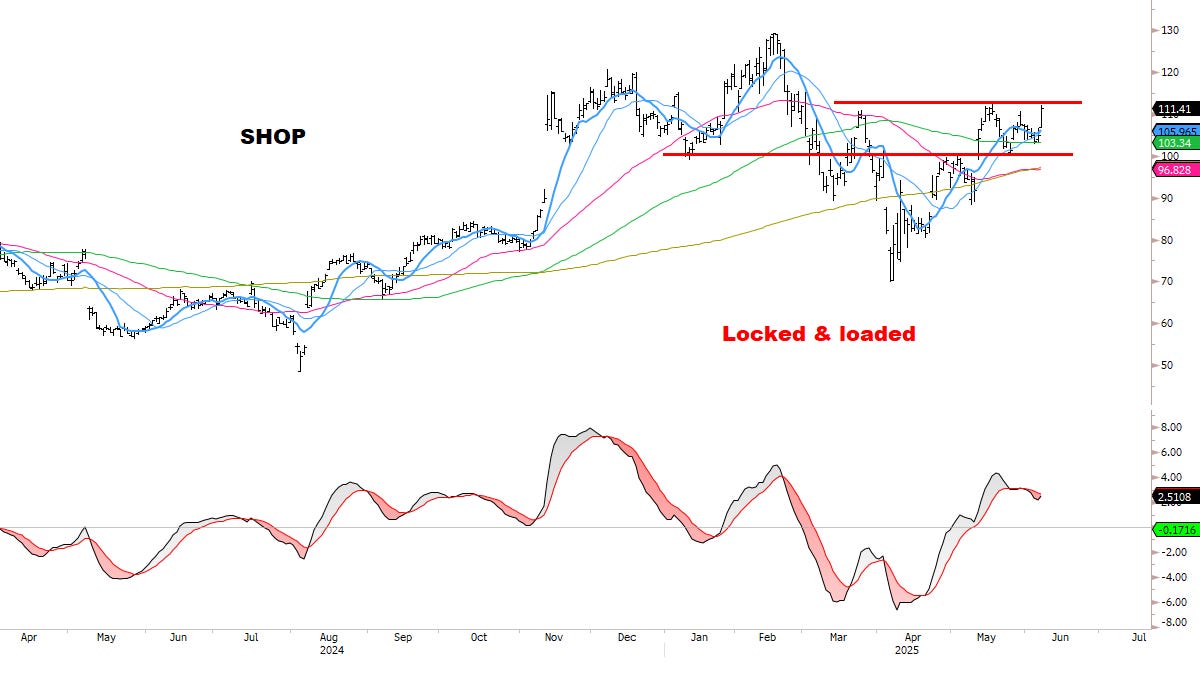
Many new names this week — and they’re getting snapped "up and out" to join the advance. Meanwhile true leaders still motoring higher with no pullbacks. Still a lot of opportunity on the radar:


RATES
Bonds moving “on schedule” — another BIG inflection point?


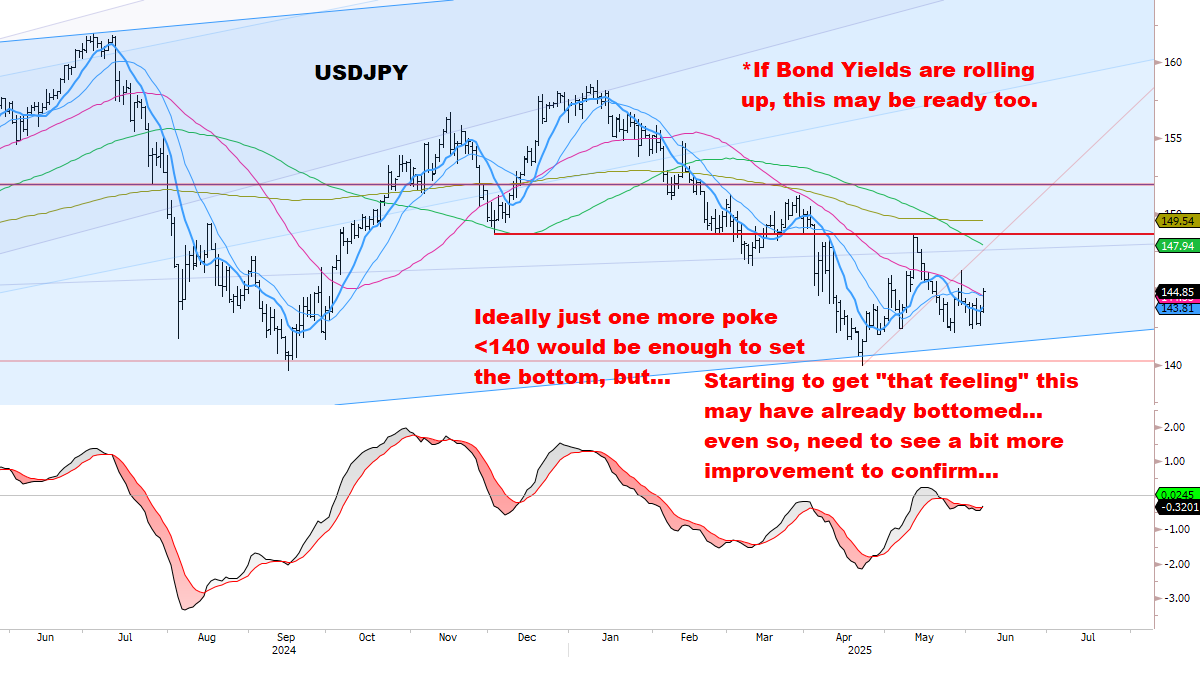
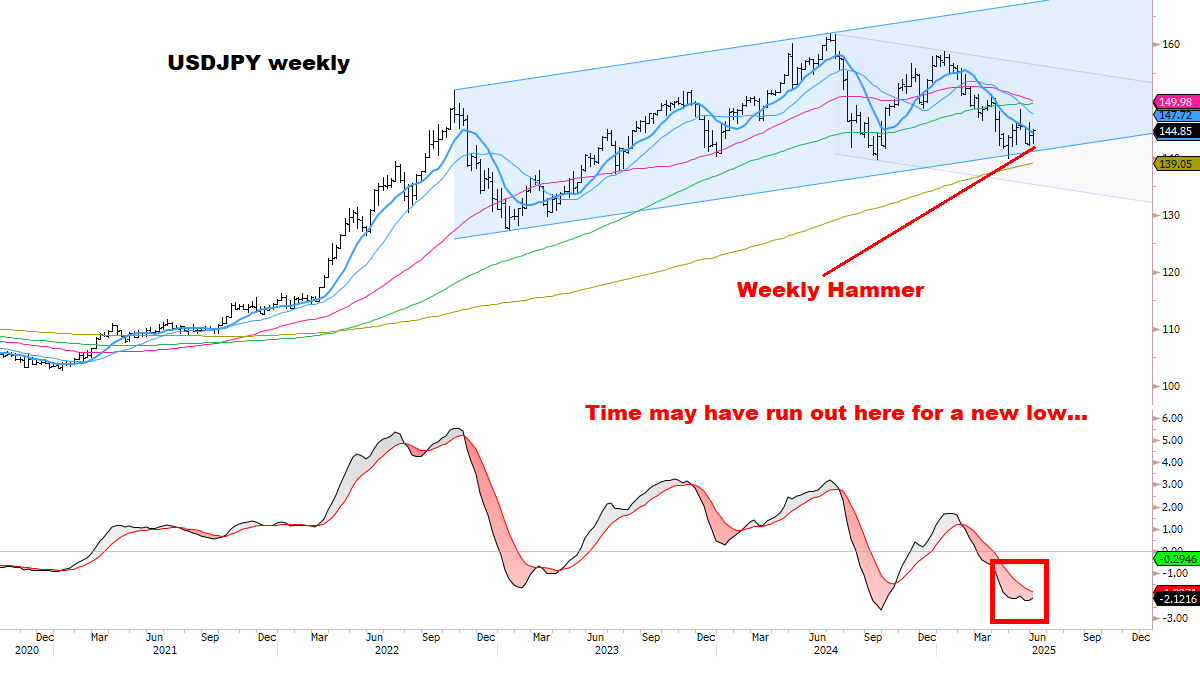
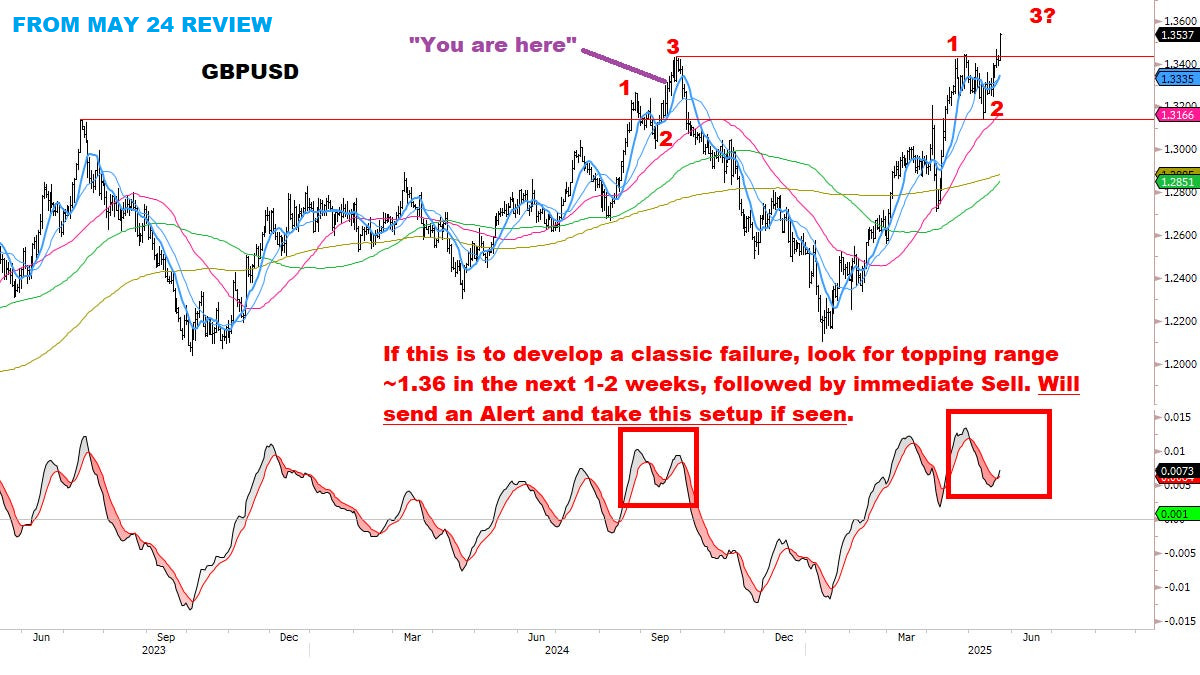
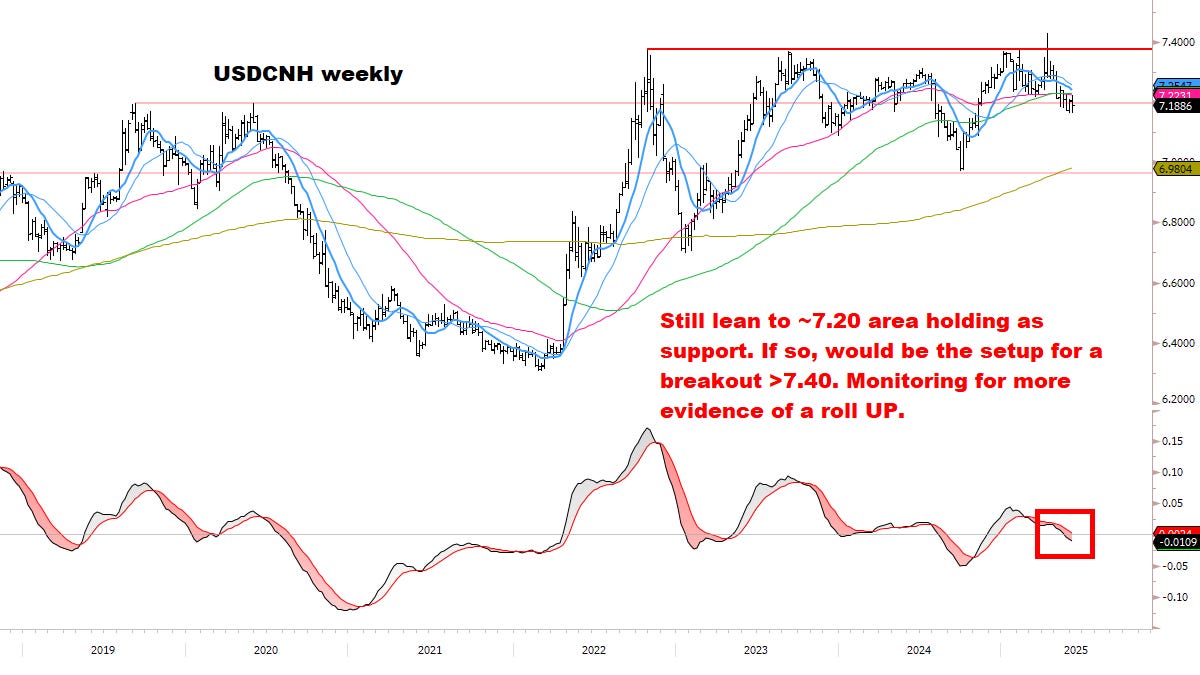
CURRENCIES
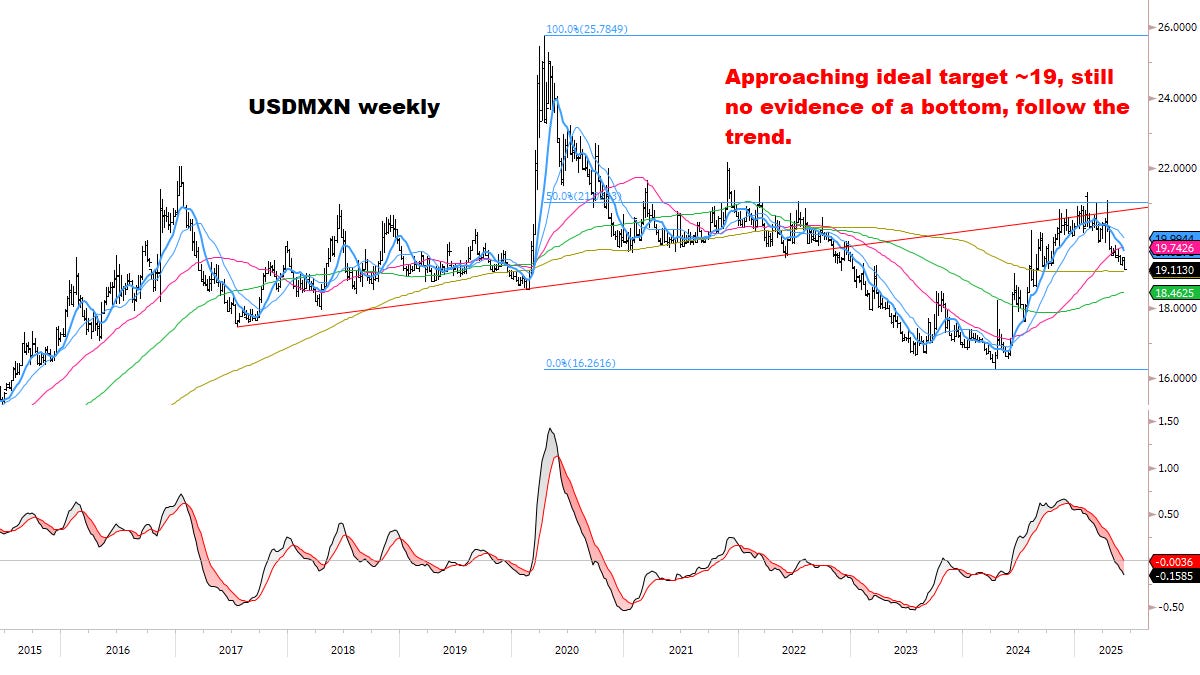
The Dollar is at a critical moment where it needs to decide if the bottom is complete, or if the trend remains lower.
My base case is that the trend remains lower.
On the other side of this, think there’s a major Long USD opportunity setting up — so don’t want to lose sight of the big picture.
Paying close attention to how these moves develop over the next few weeks, and if divergences begin to form.
Remain focused on the Big Four and looking to get aggressive:


OIL & ENERGY
This week’s failure to break down on bad news was important (and short-term bullish):

Energy still struggling at resistance, watching for Short entry & will update in a Thread/Post. As before: has to be a compelling and tight/asymmetric setup, otherwise pass.


METALS


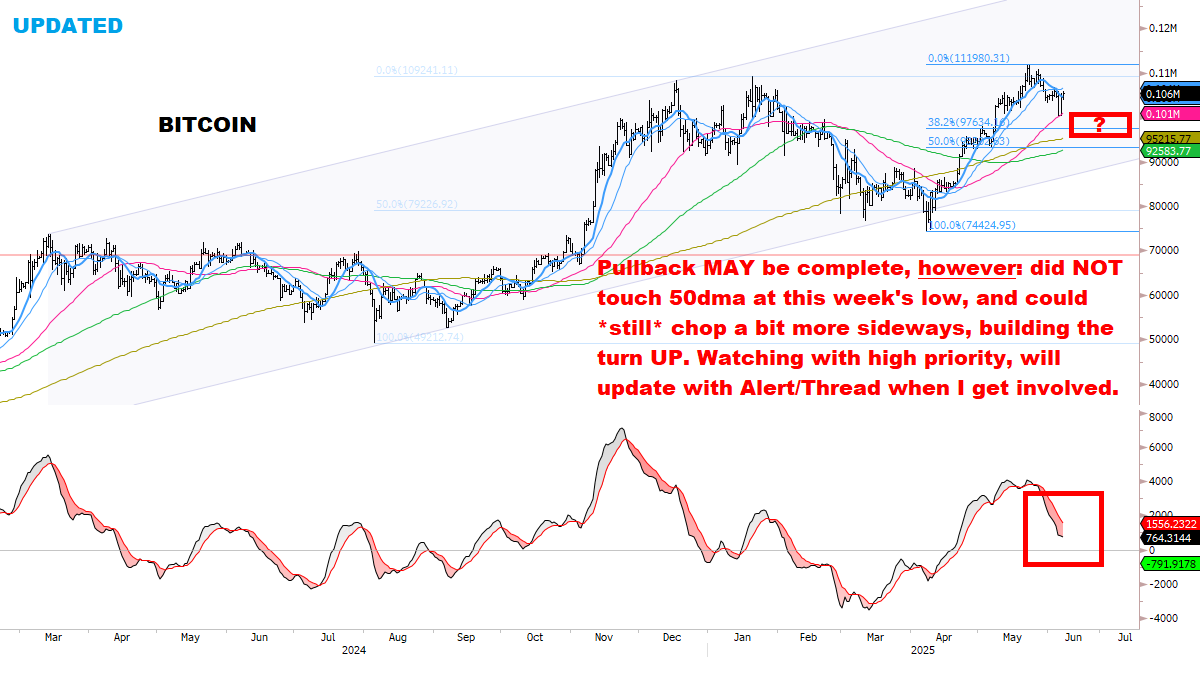
BITCOIN
Remains my #1 area of interest.
*Tracking our pullback scenario with *high priority* — bottom MAY already be in:

Continue to think Bitcoin could be the true leader (and has been since April):

Tracking pullback scenario:

Have a great weekend.
Thanks for reading.
Onwards and upwards, -MC
*If you enjoyed this report, likes are much appreciated…