


100+ Charts & Commentary on all major Markets — for your weekend reading.
“Don’t start the week without it”

New all-time highs — just like everyone predicted two months ago…
KEY TOPICS COVERED
In today’s report:
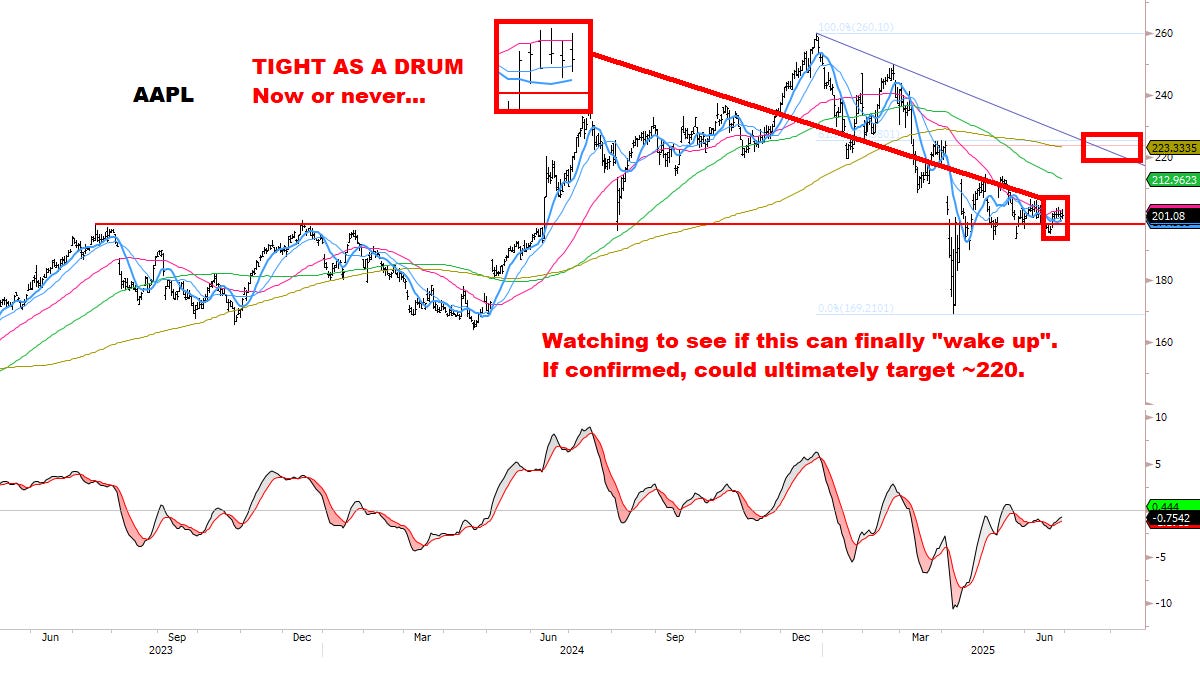
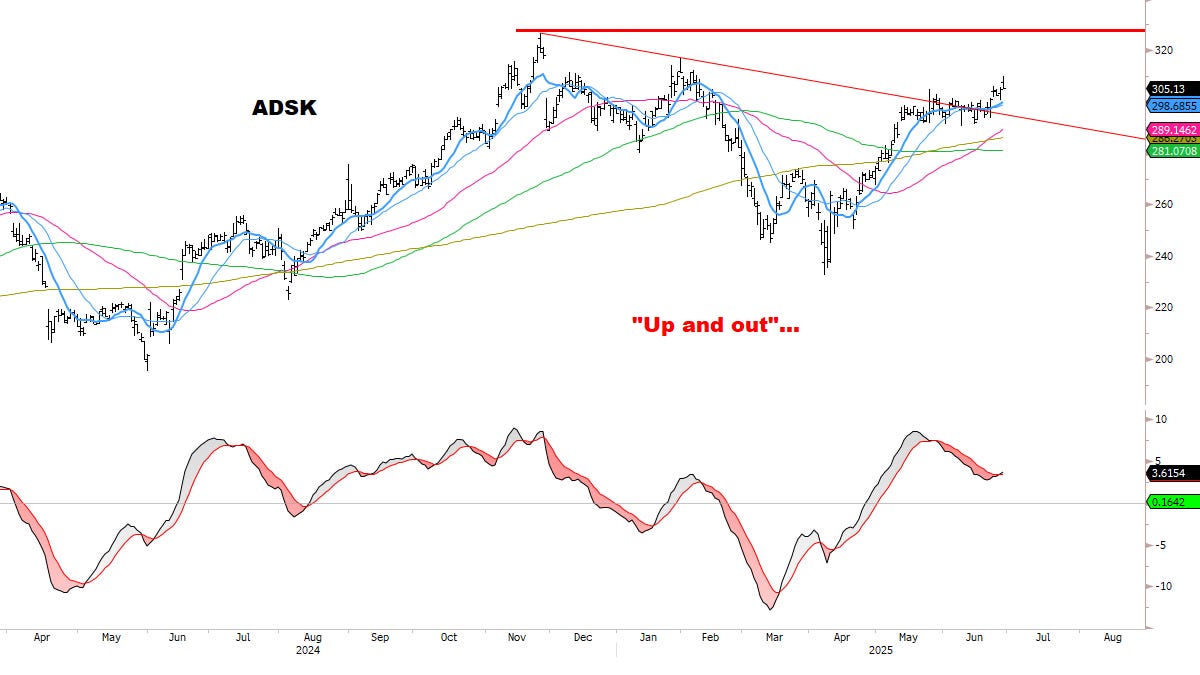
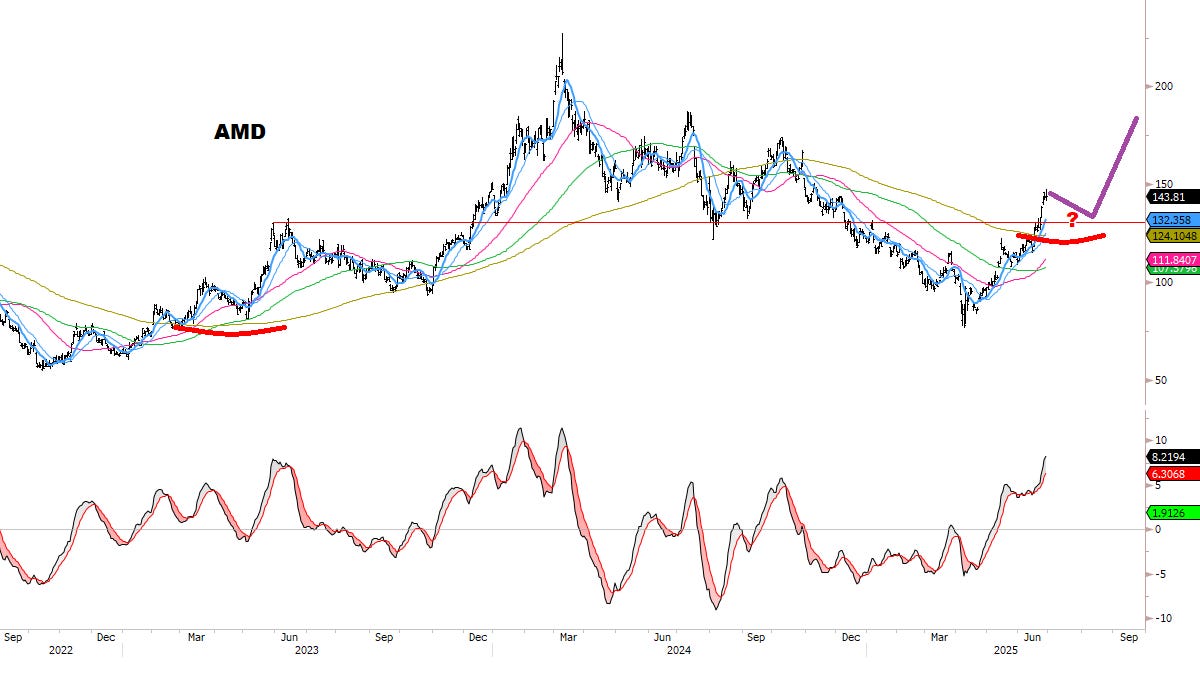
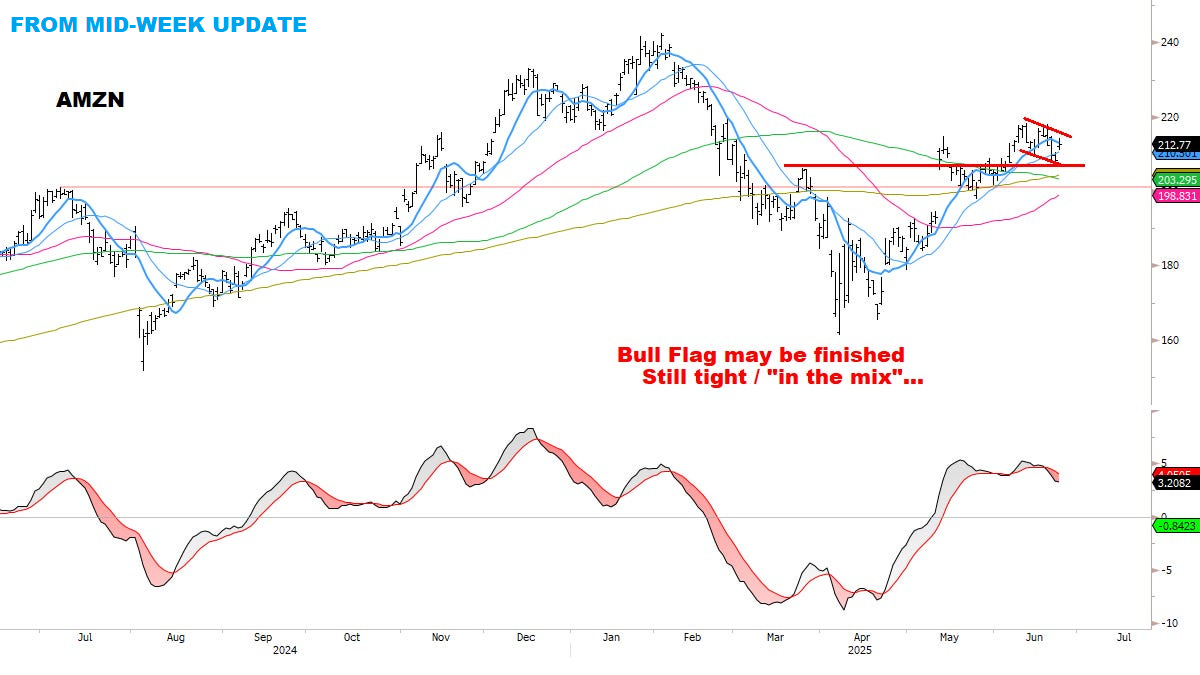
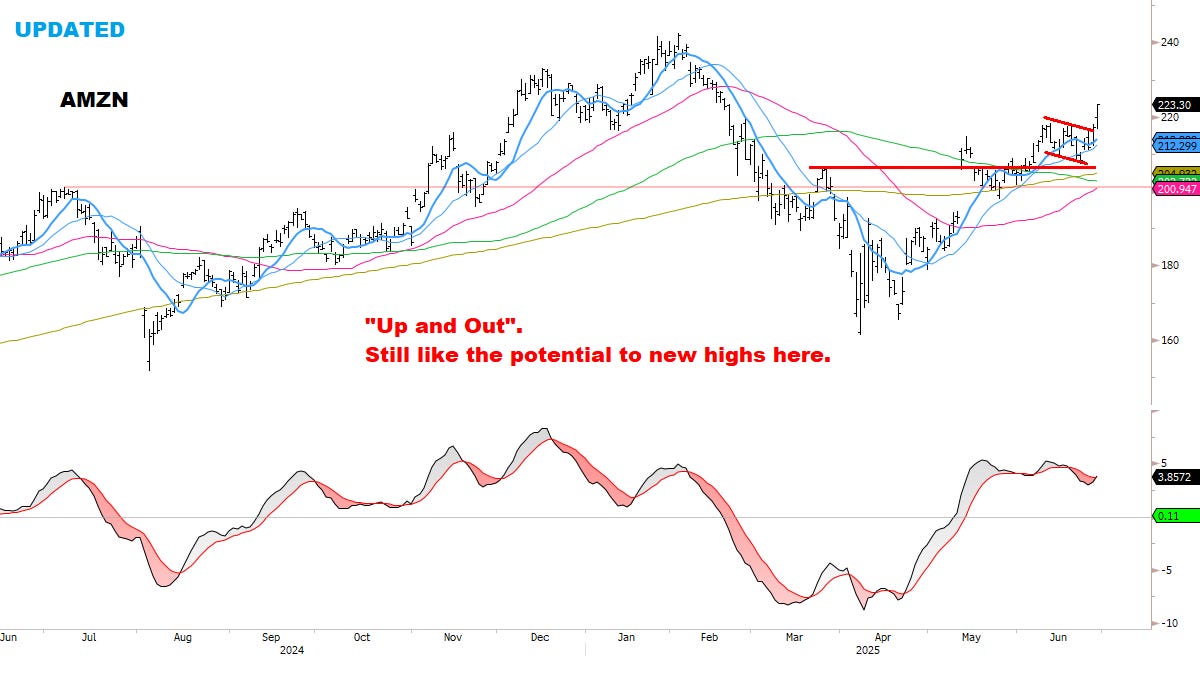
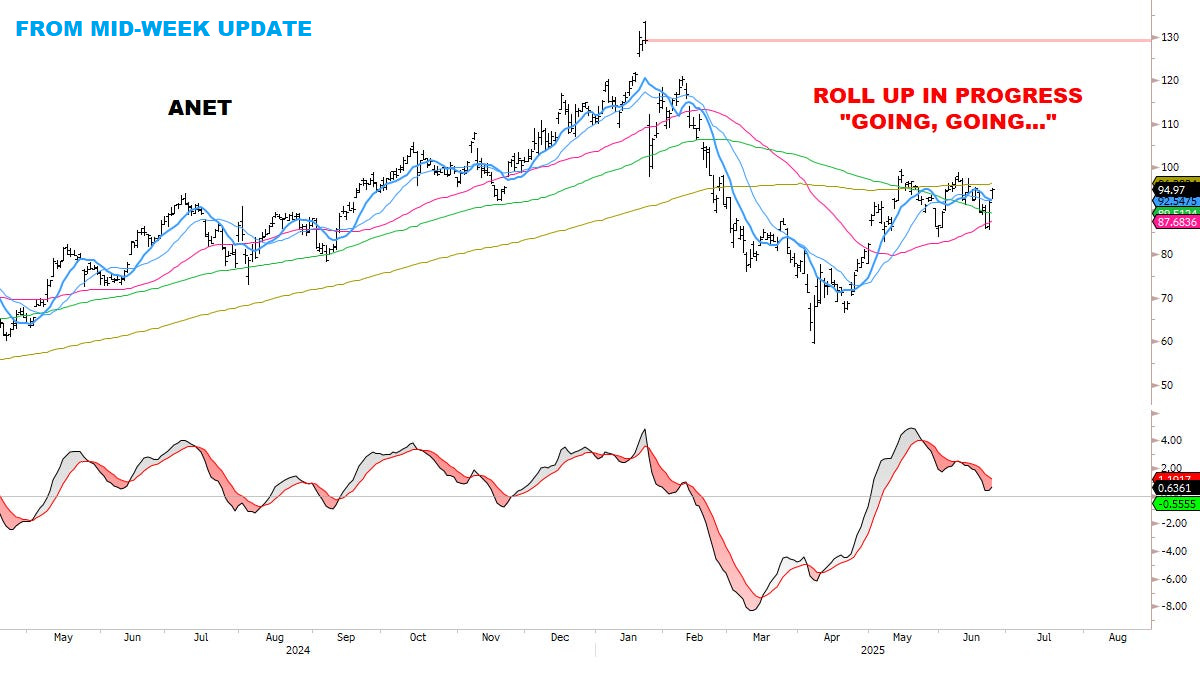
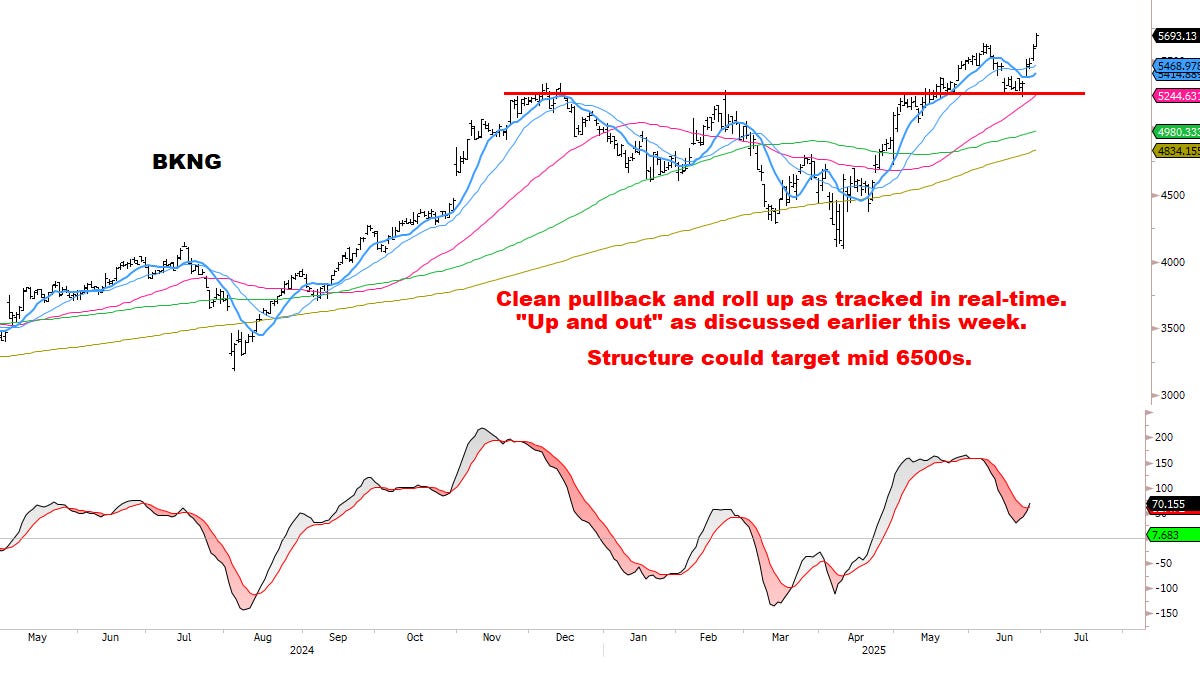
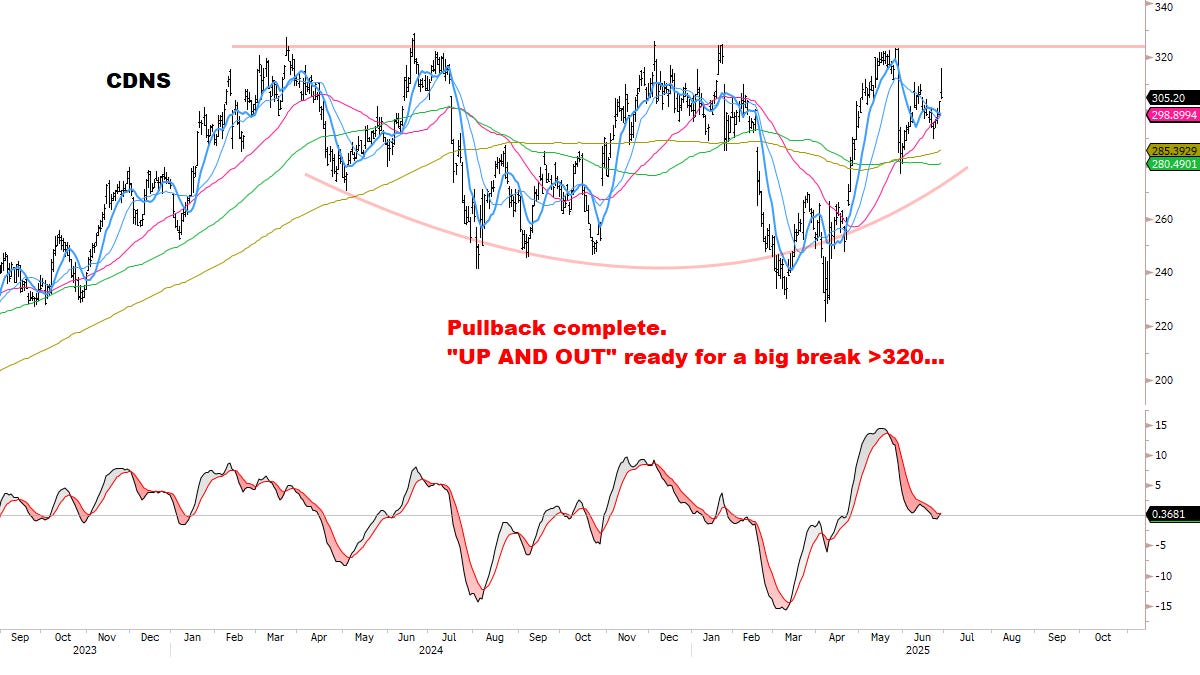
STOCKS: moving UP & OUT on schedule.
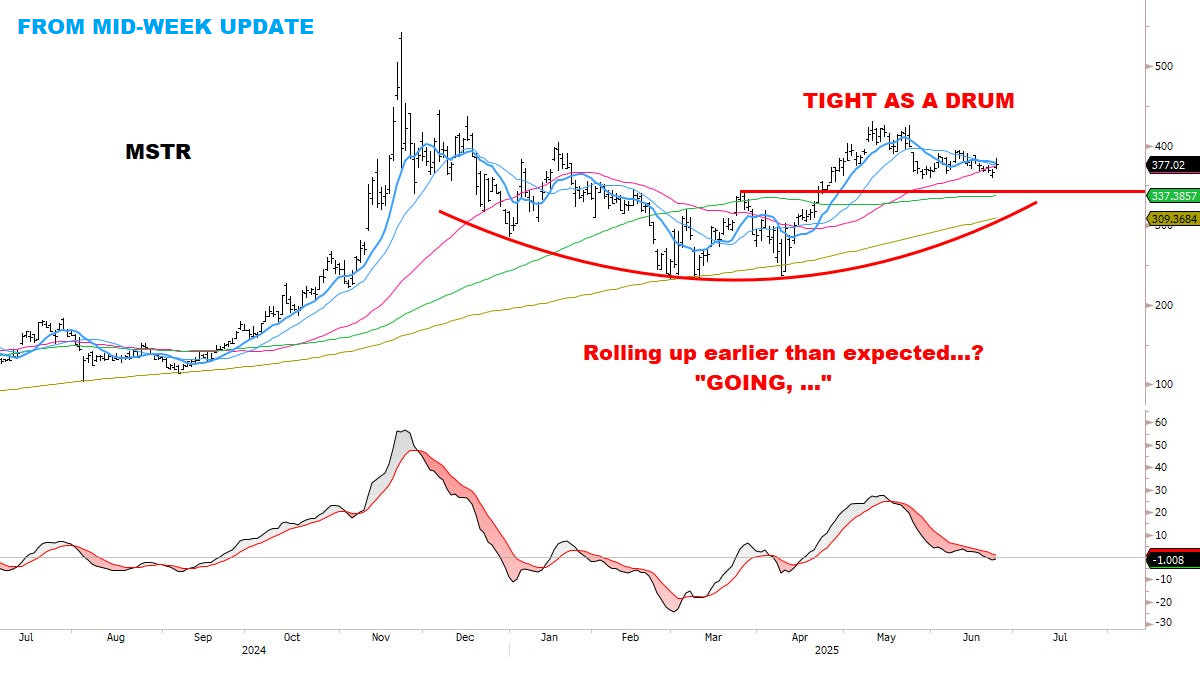
Last week I wrote: “many stocks still look great — ready to run UP & OUT”.
This week was strong confirmation — our top names are *still* leading.
SPECIAL UPDATE: How high can stocks go? Time to update an important topping signal I’ve been monitoring *for the right moment*. Keeping an eye on this (and other signals) closely.
Updated scans & targets: assessing (1) model signals, (2) market behavior, (3) individual stocks.
Scanning for weakness / SHORTS.
BONDS: Turning Bullish?
FX: Watching the Dollar closely.
OIL: An important Top looks to be in.
METALS: Risking a Top. What do they know?
BITCOIN: Tracking the perfect sequence.
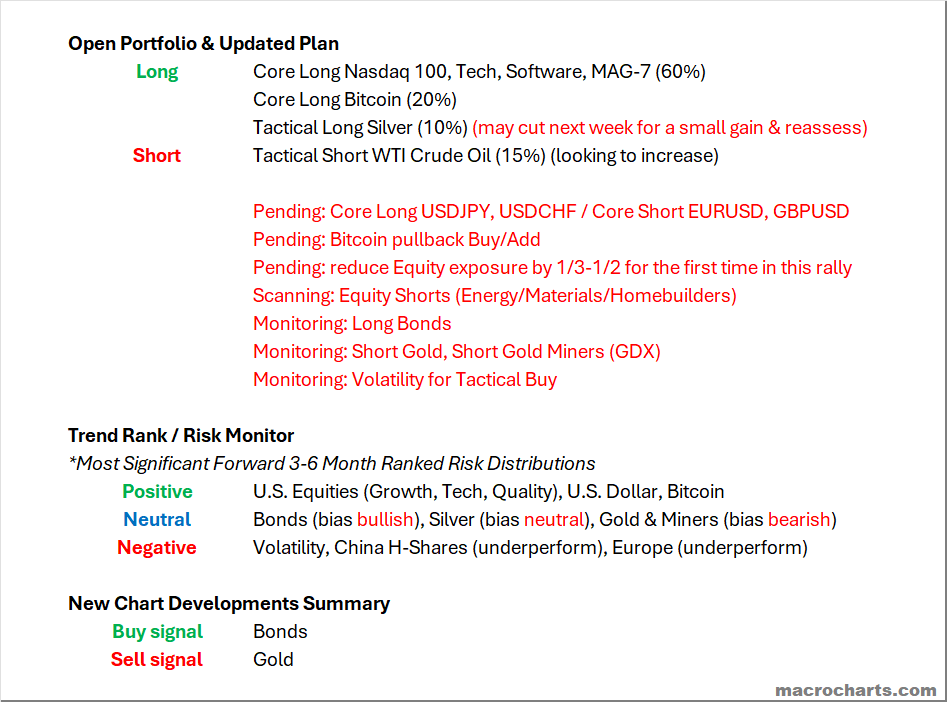
Open Portfolio & Updated Plan
Emphasizing: an open mind could be the difference between a great summer and an average one. It’s a strong year and I intend to keep pushing — eyes on the next big move.
*Several important changes to the Risk Monitor & Watchlist:
CORE MODELS & DATA
STOCKS
ETF Investors are finally joining the rally — as stocks break new highs.
Base case: flows should accelerate, for key reasons previously discussed.
If history is a guide, the path of maximum pain is for the market to grind higher over time, leaving sellers behind. Pullbacks could be limited in scope. This framework continues to be validated by the indexes.
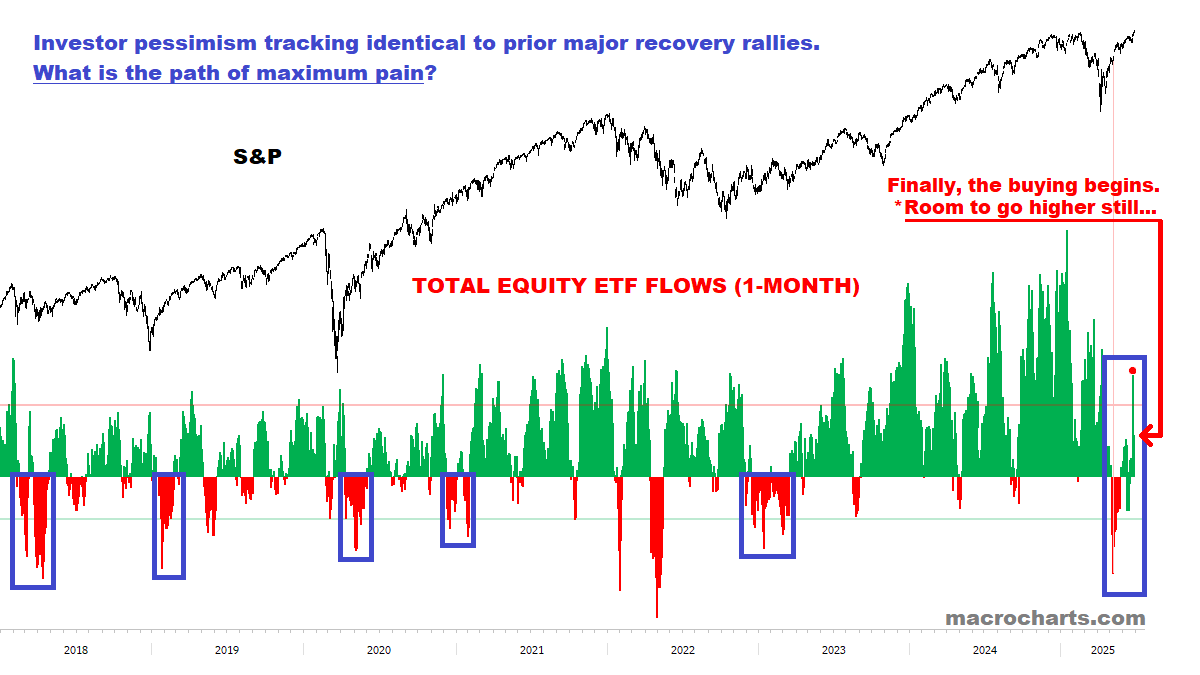
Institutions are also starting to Buy as stocks break new highs:

SPECIAL UPDATE: HOW HIGH CAN STOCKS GO?
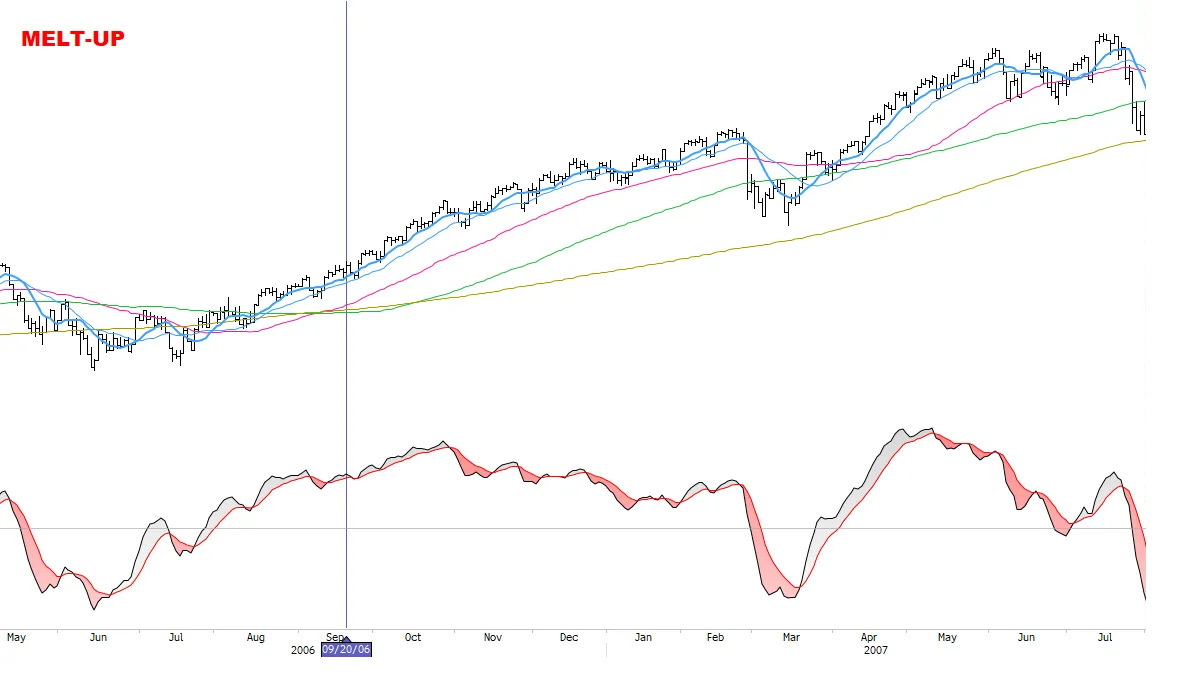
A Melt-Up developing:
In Wednesday’s Closing Thoughts I wrote: “Stocks breaking to new highs with a LOT of money still massively underinvested… Our core scenario looks underway — and ready to accelerate”.
Remember what I wrote in April: “at the April 7 bottom, some well-known bulls were publicly apologizing for their view. At the next top of importance, we could see “mea culpas” from some well-known bears. Such is the nature of the stock market.”
Scanning social media this week, the usual pundits are STILL openly skeptical of the rally.
That’s *not* how tops are made…
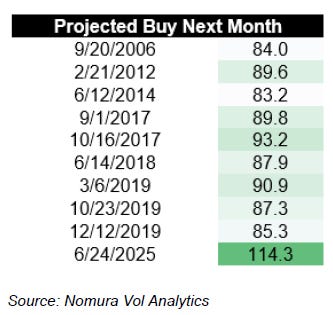
Critically, matching my estimate for potential buying of ~$100Bn (or more):
Article published on Bloomberg this week:
“Nomura's Charlie McElligott says his model is projecting more than $100 billion of equity buying over the next month, the most it has ever predicted. An avalanche of cash could be heading for the stock market over the next month or so, one Wall Street strategist said on Wednesday.
That is the largest figure that the model has ever predicted since it was first deployed in 2004, McElligott said. McElligott said the model's output was largely driven by the looming drop in three-month realized volatility. Realized volatility is a widely used metric for measuring how volatile stocks have actually been over a given period.
McElligott told MarketWatch that, if anything, his model likely underestimates the size of the systematic universe. Most of the firms using these strategies are hedge-fund investors. That can make it difficult to assess the exact amount of capital they have available to deploy.
But in the past, when it has flagged a potential surge in buying from systematic traders, McElligott's model has presaged strong returns for stocks, particularly over the next month or two, as the chart below shows. The model has predicted gains over the short term with 100% accuracy, and strong excess returns — or returns beyond what should have been expected — as well.”
[BELOW: priors saw S&P higher 100% of the time 2-3 months out, with *significant “right tail” rallies*. This further supports my scenario for a low-volatility summer melt-up — as we’ve been discussing for a while. Again, the *perfect environment* for stock-picking.]
TABLE OF PRIOR MODEL RECORDS:
CHARTS OF PRIOR MODEL RECORDS — note the *significant “right tail” rallies”:
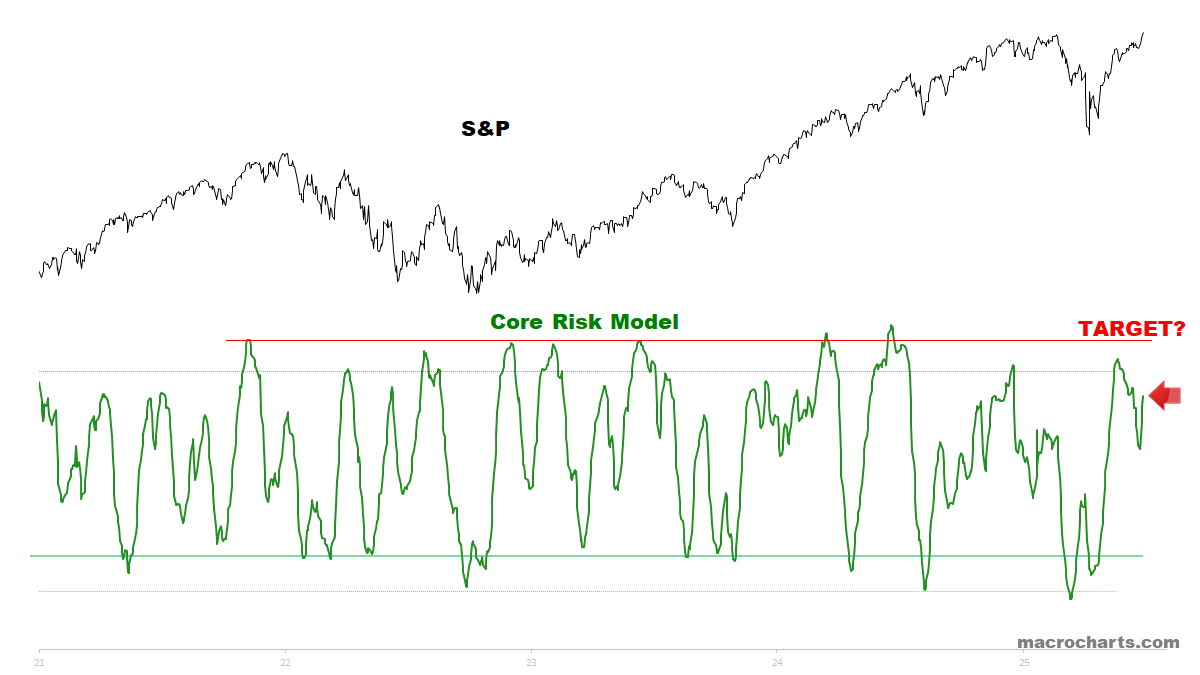
Core Risk Models have room to get overbought — *especially if a full-blown melt-up is underway.
When THIS reaches topping range, I’ll raise cash and look to put on Tactical hedges. Not before.
When the time comes, we’ll be sharing this with Subscribers only. No public sites or social media.
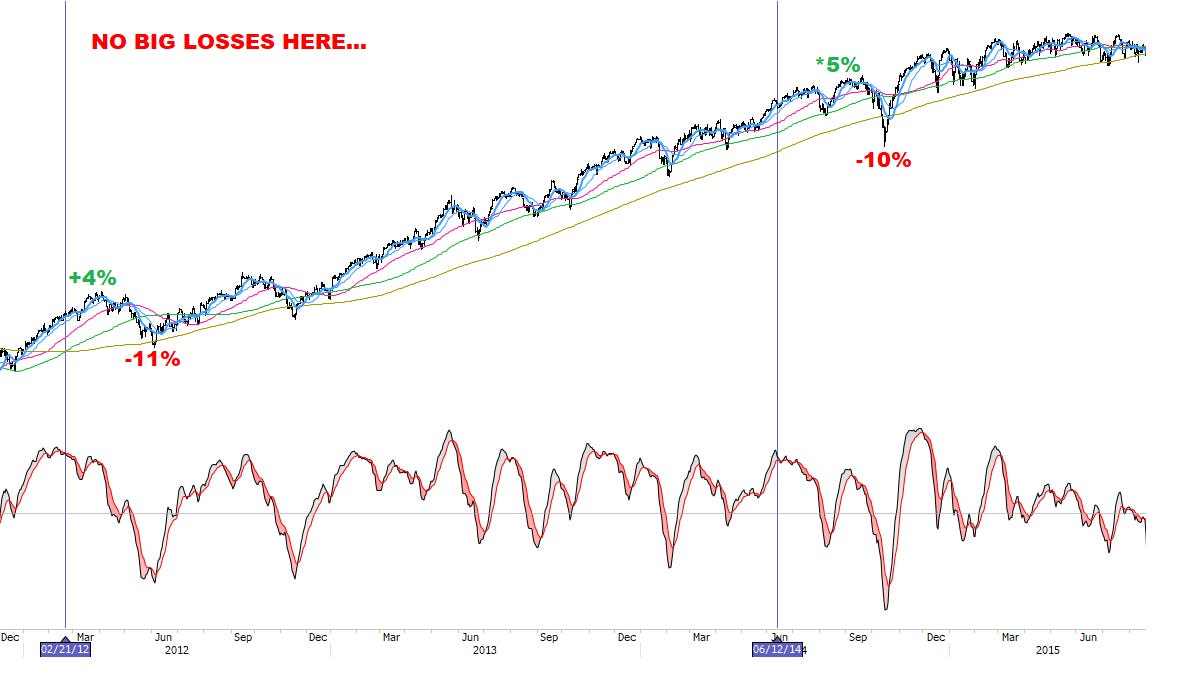
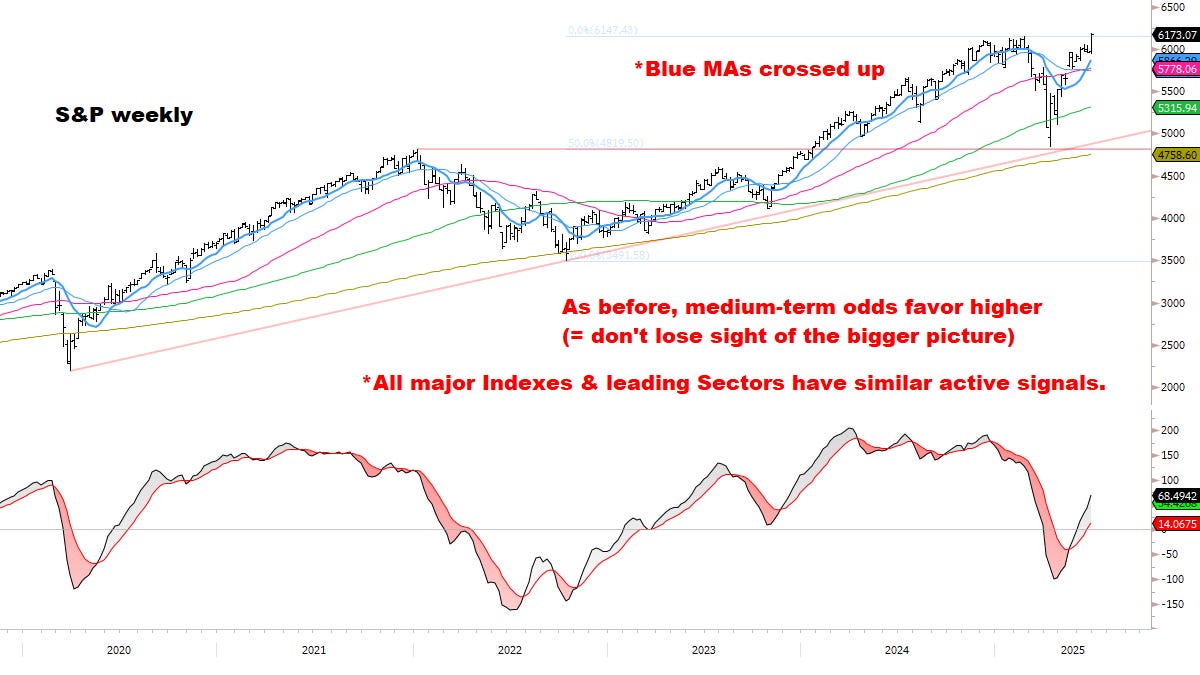
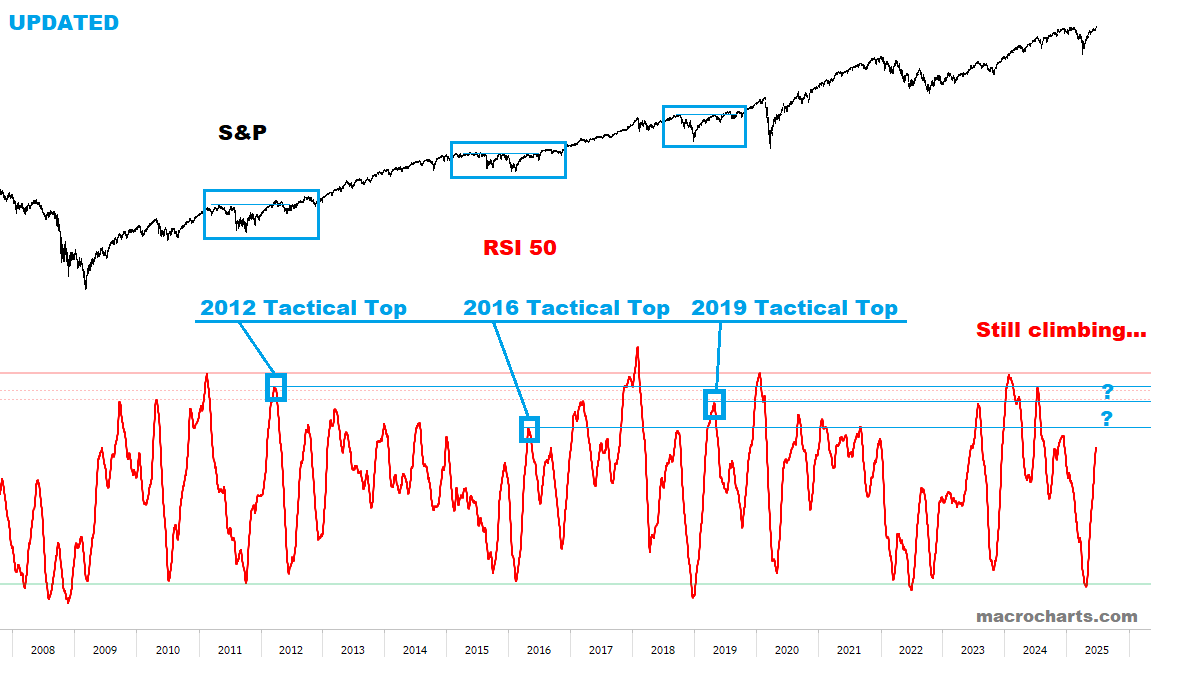
We continue to track this closely for an ideal top into late summer — note “Golden cross” is imminent:
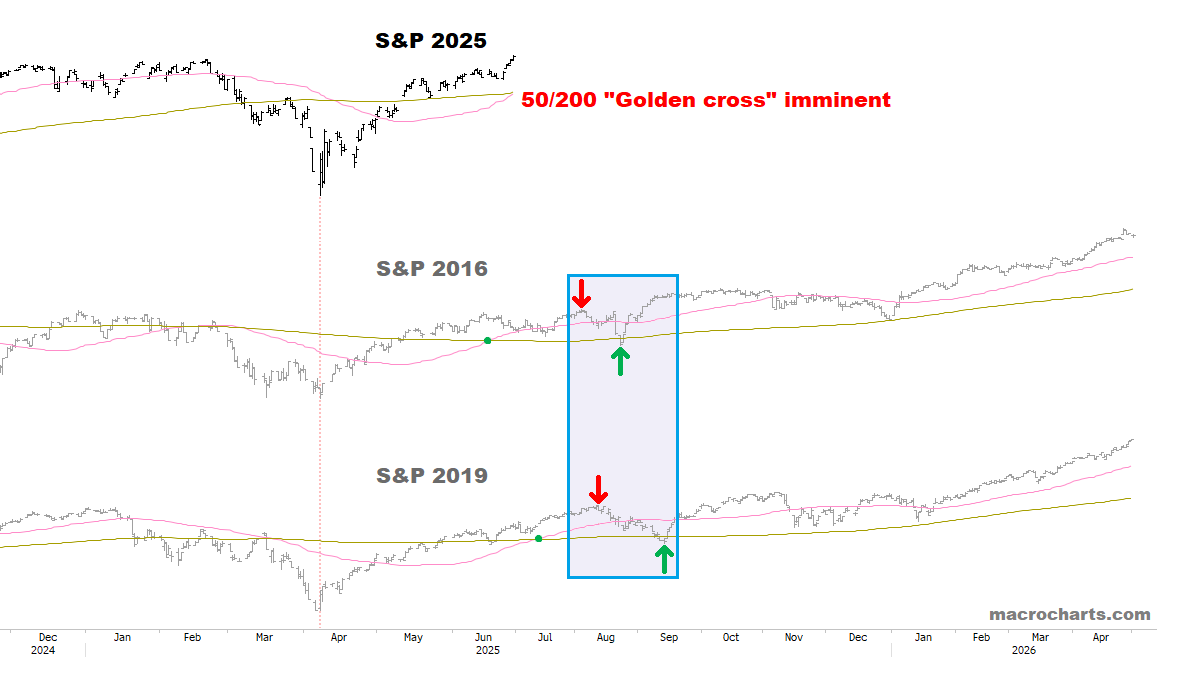
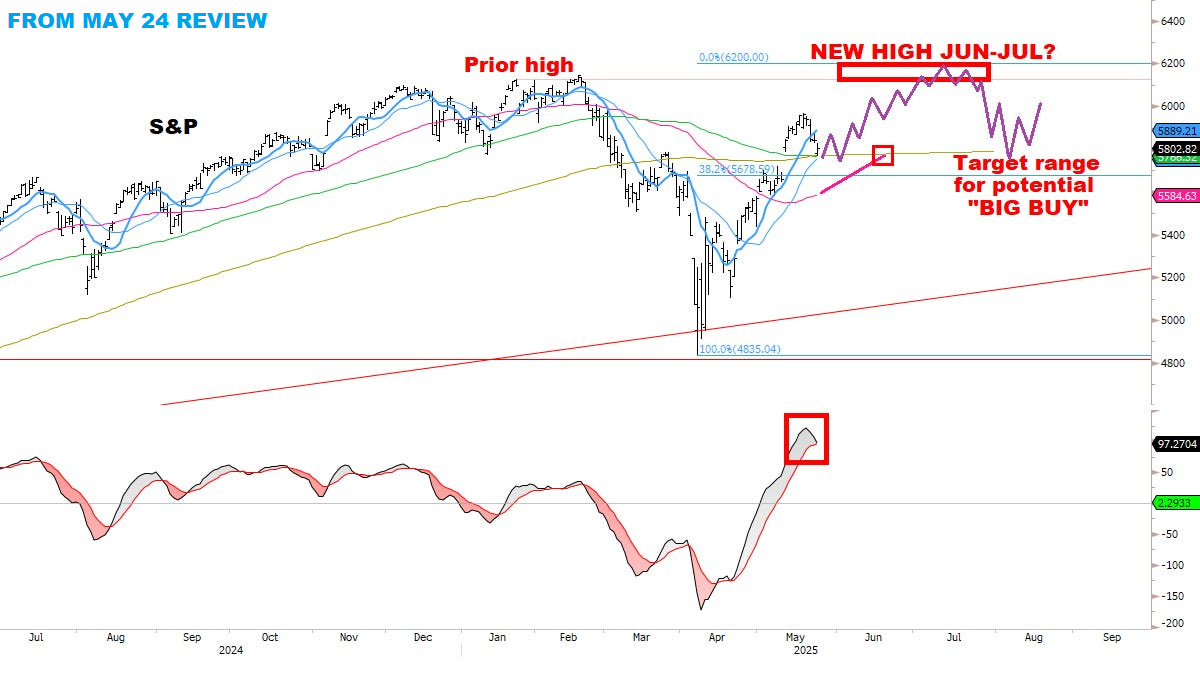
As discussed May 24:
“If the sequence continues, dips should remain shallow for the next few weeks, with the market in a slight upward bias. Overall, a *perfect environment* for stock-picking. *Also: not yet an optimal setup to Short Indexes or buy Volatility.”
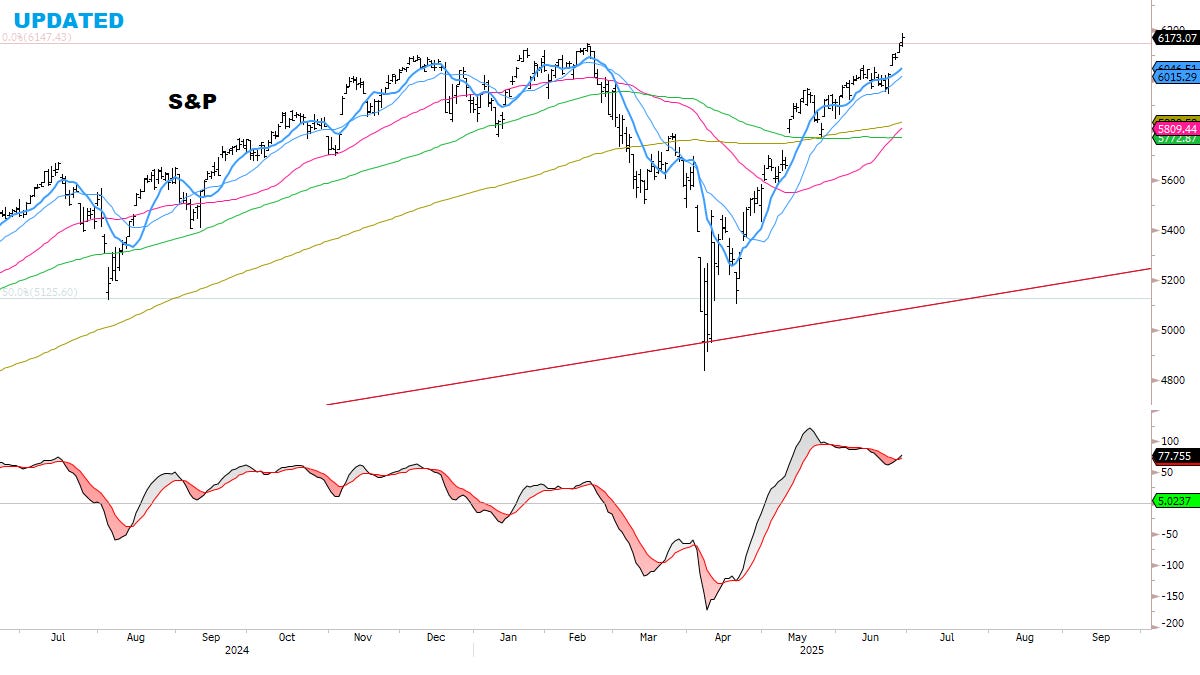
*This framework continues to be validated by the market, and remains my base case for now.
As always: an open mind could be the difference between a great summer and an average one. It’s a strong year and I intend to keep pushing — eyes open to the next big move.
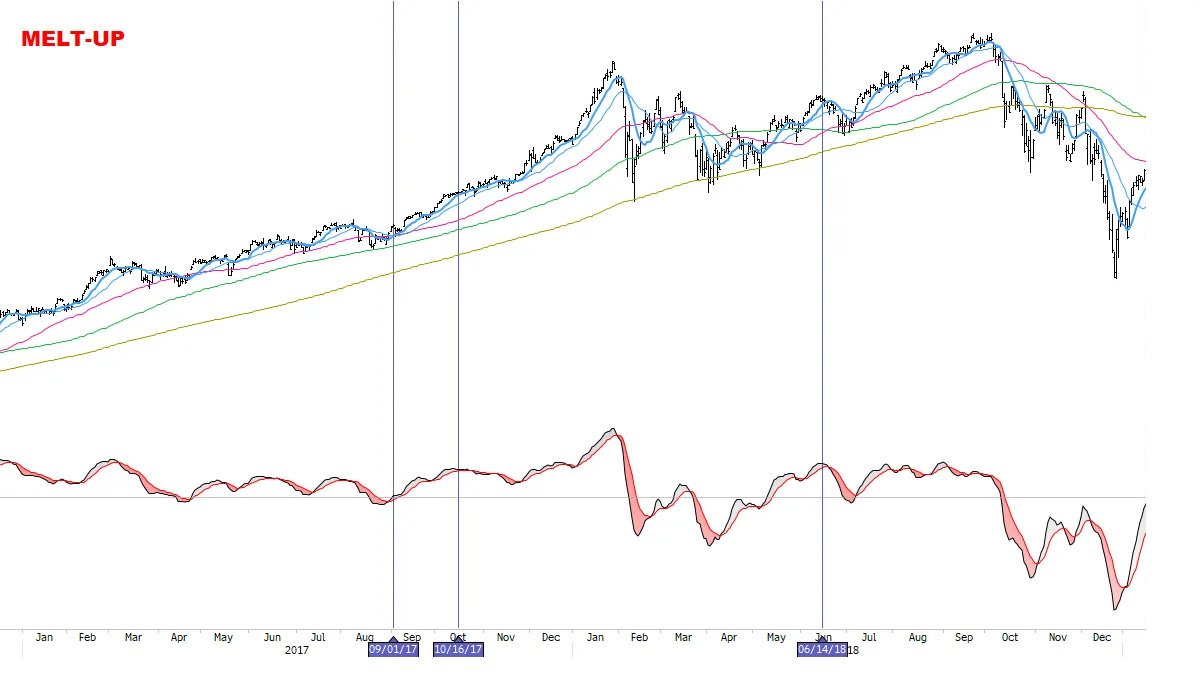
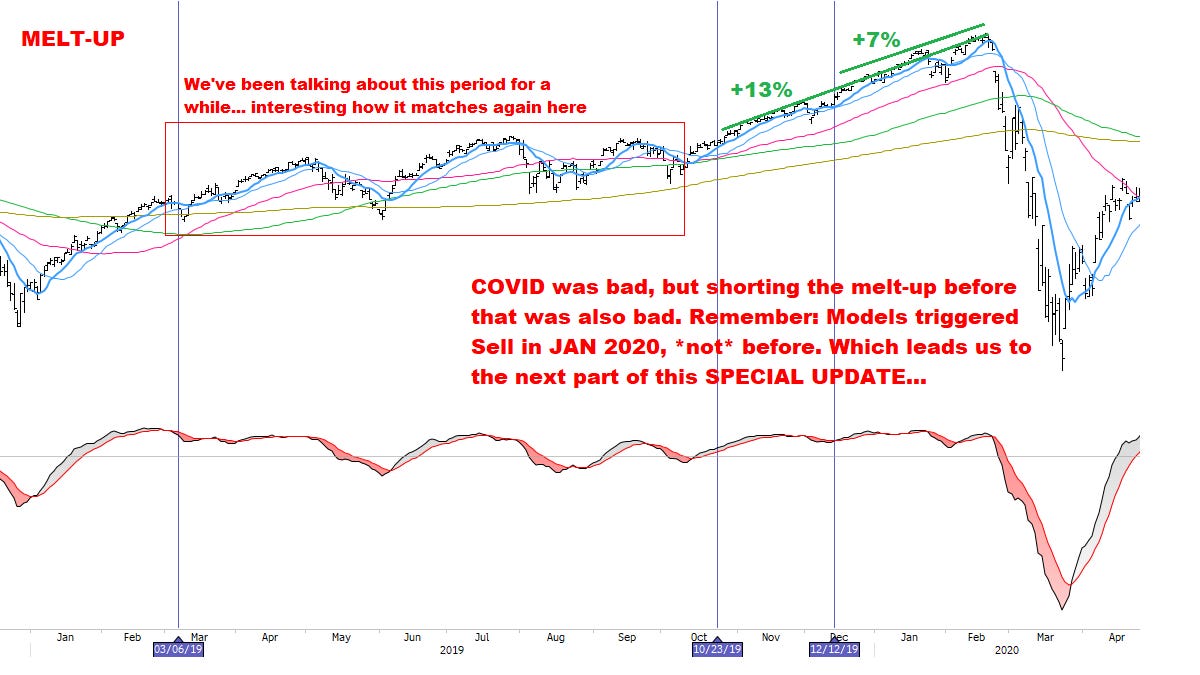
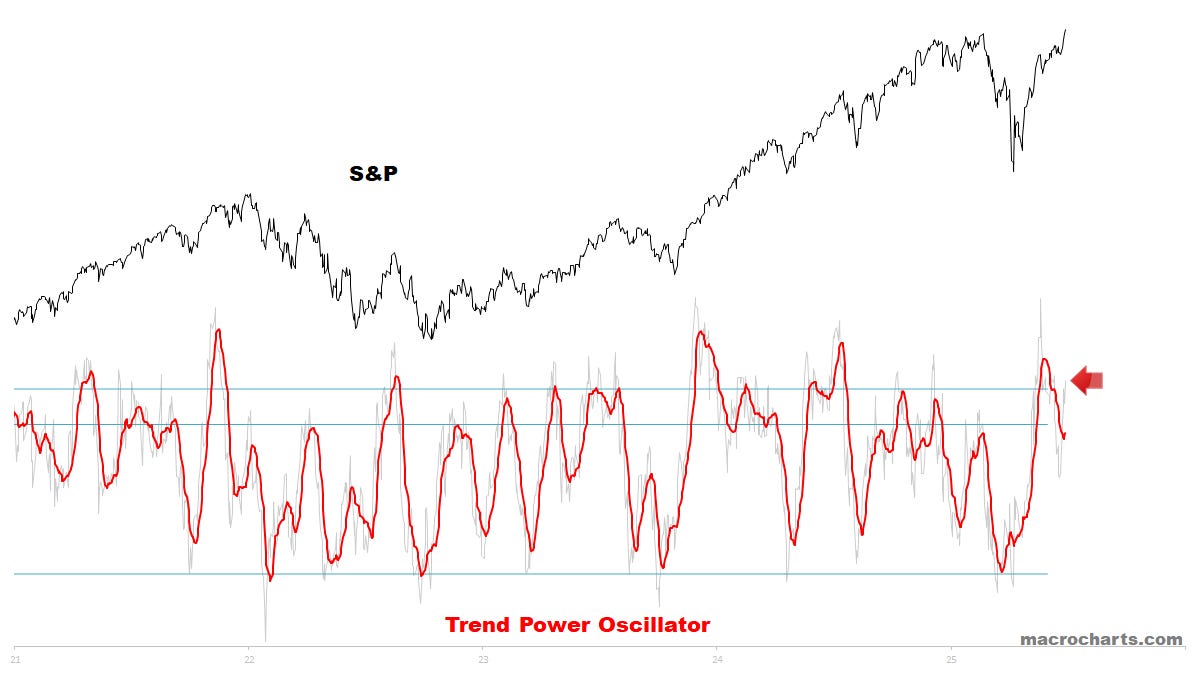
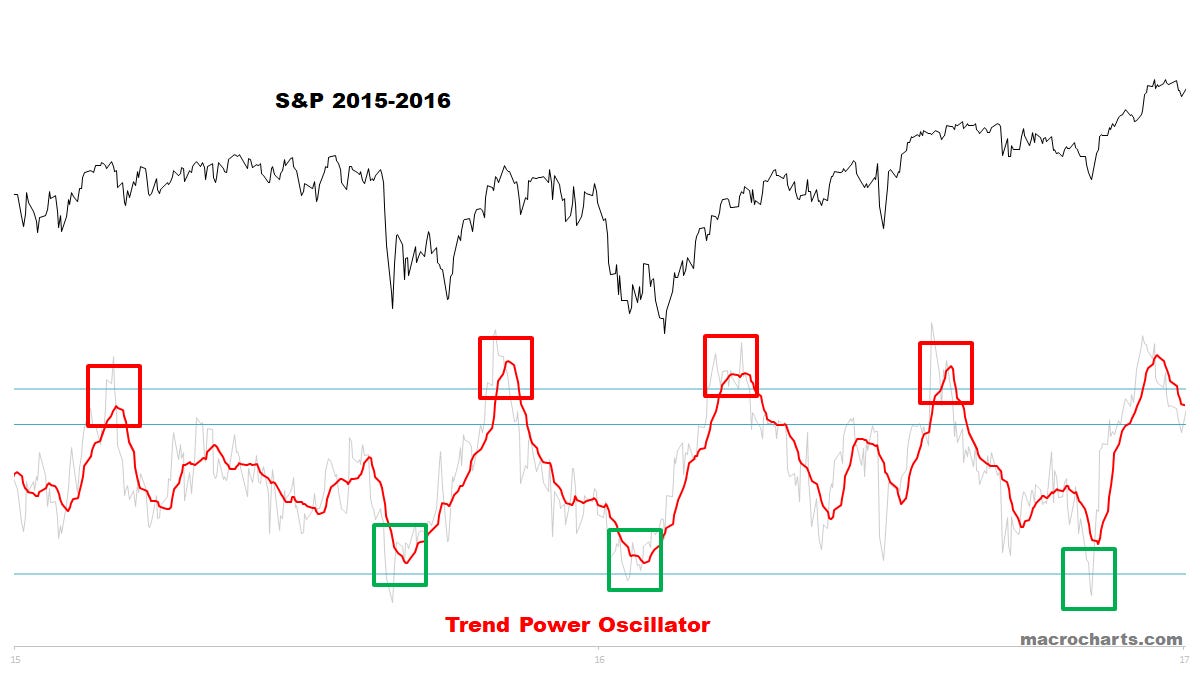
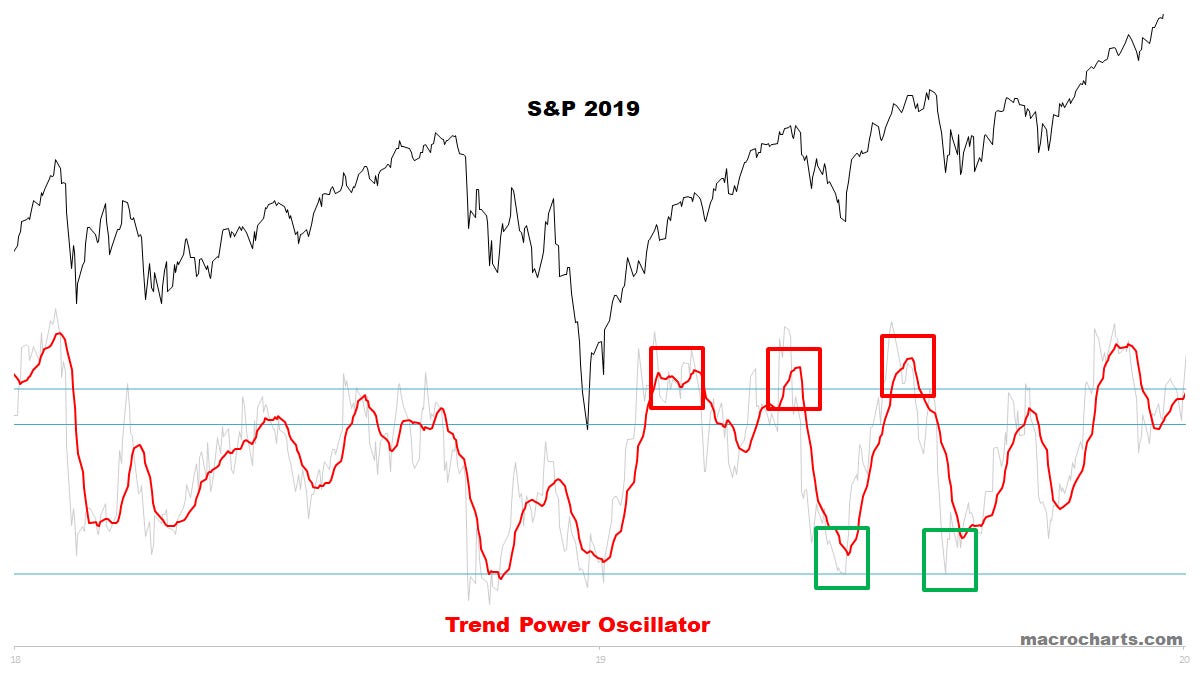
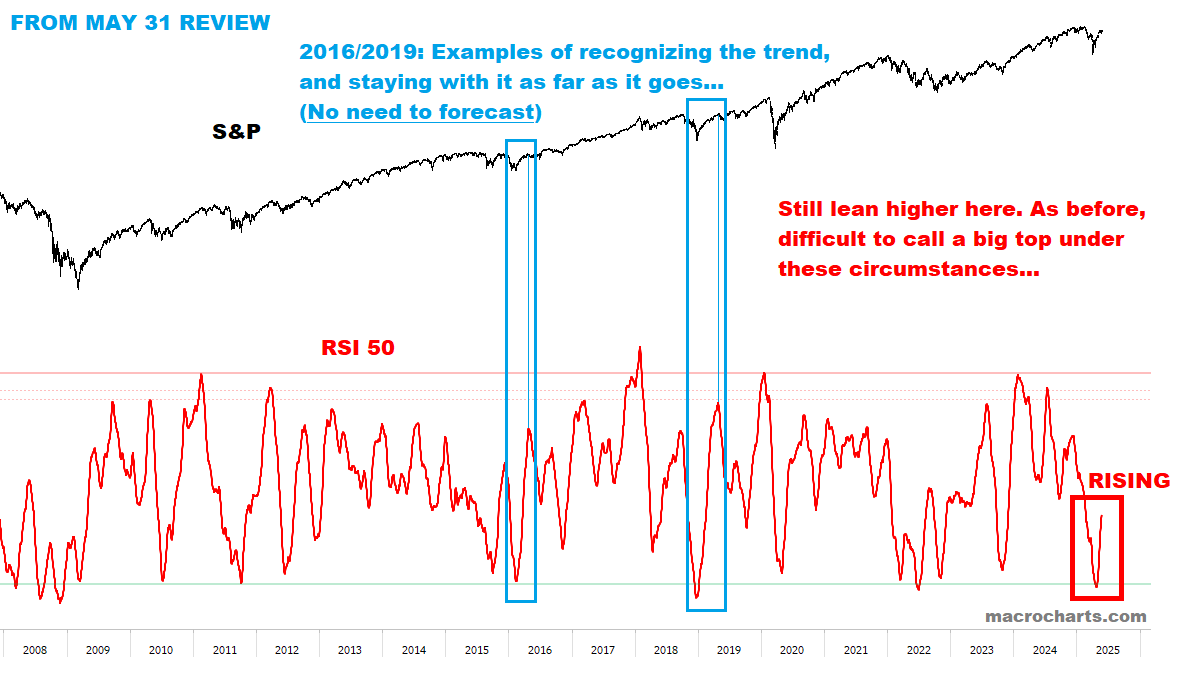
Trend Power Oscillator is moving to overbought again — still tracking the 2016/2019 scenario.
When THIS reaches topping range, I’ll raise cash and look to put on Tactical hedges. Not before.
When the time comes, we’ll be sharing this with Subscribers only. No public sites or social media.
Remember:
High-Low Oscillator has room to push to target range:
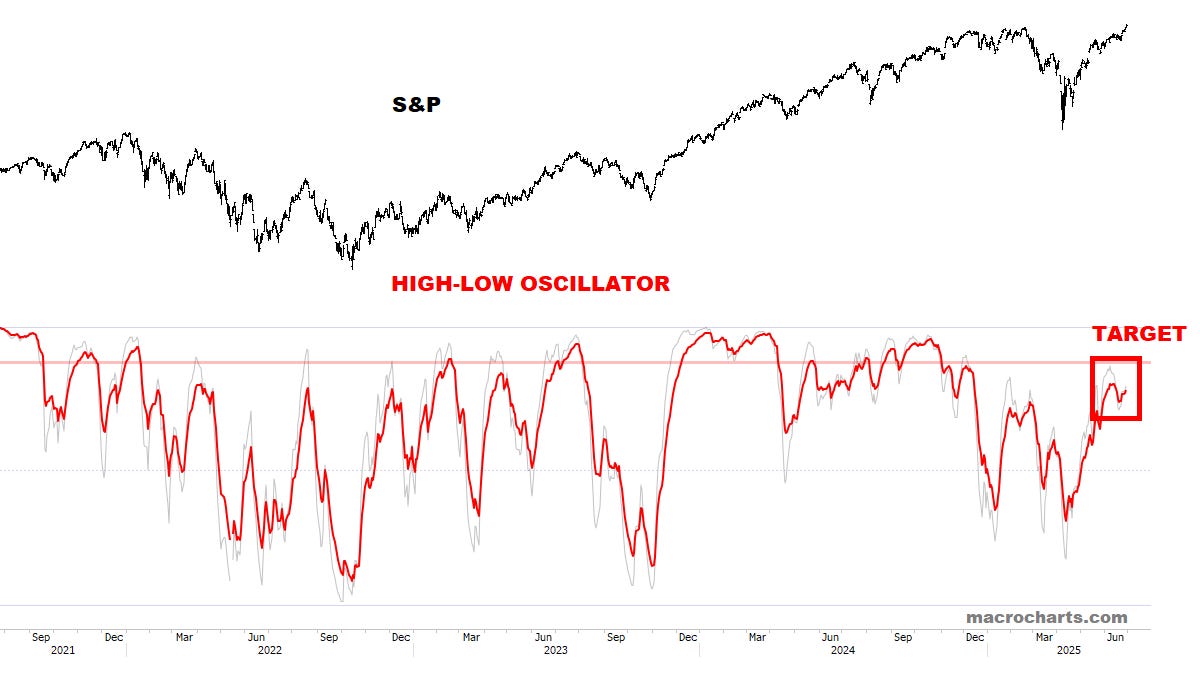
Reiterate: on track for new highs in all key areas, before a bigger correction is seen.
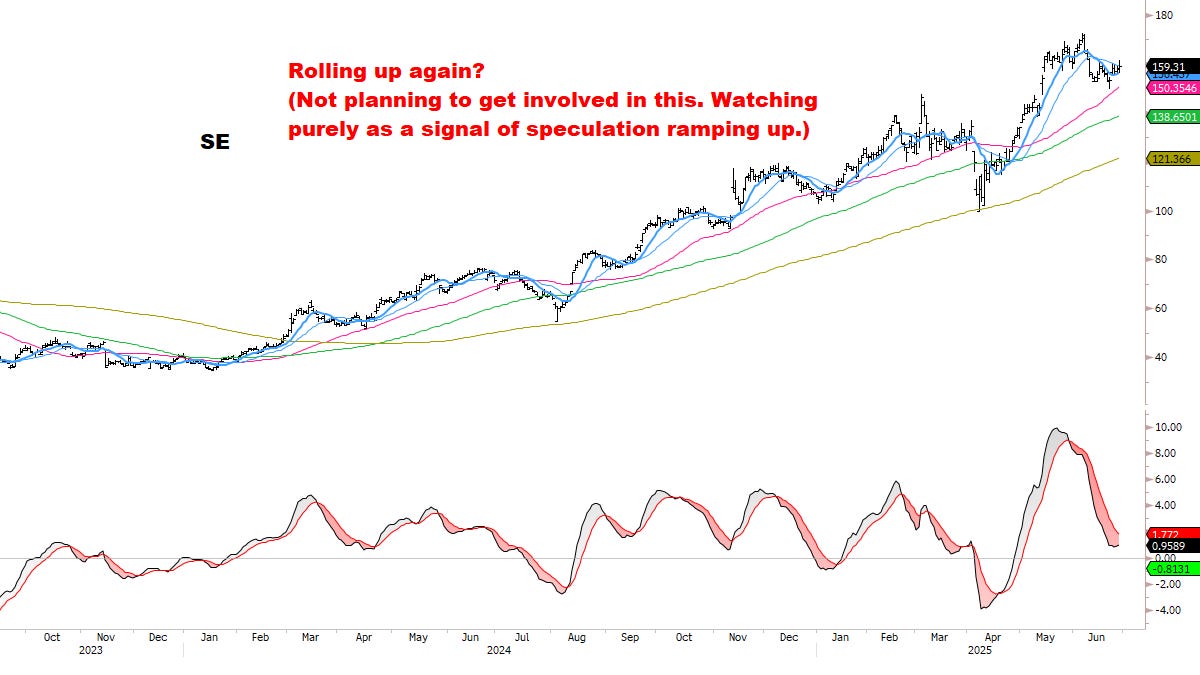
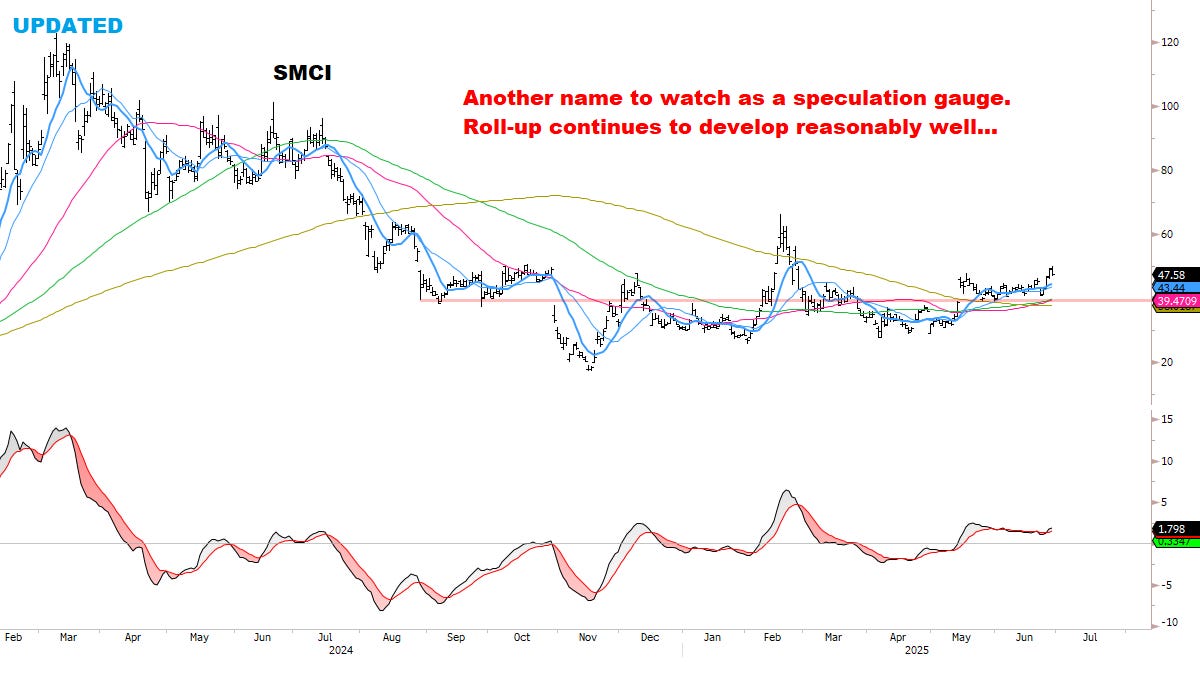
Base case: speculation and more importantly flows should ramp up rapidly as new highs continue to expand.
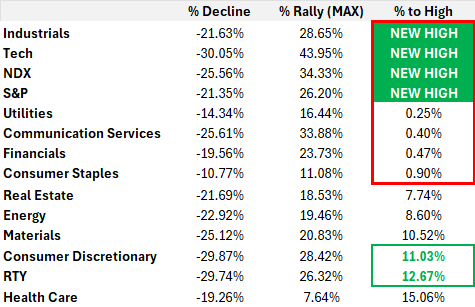
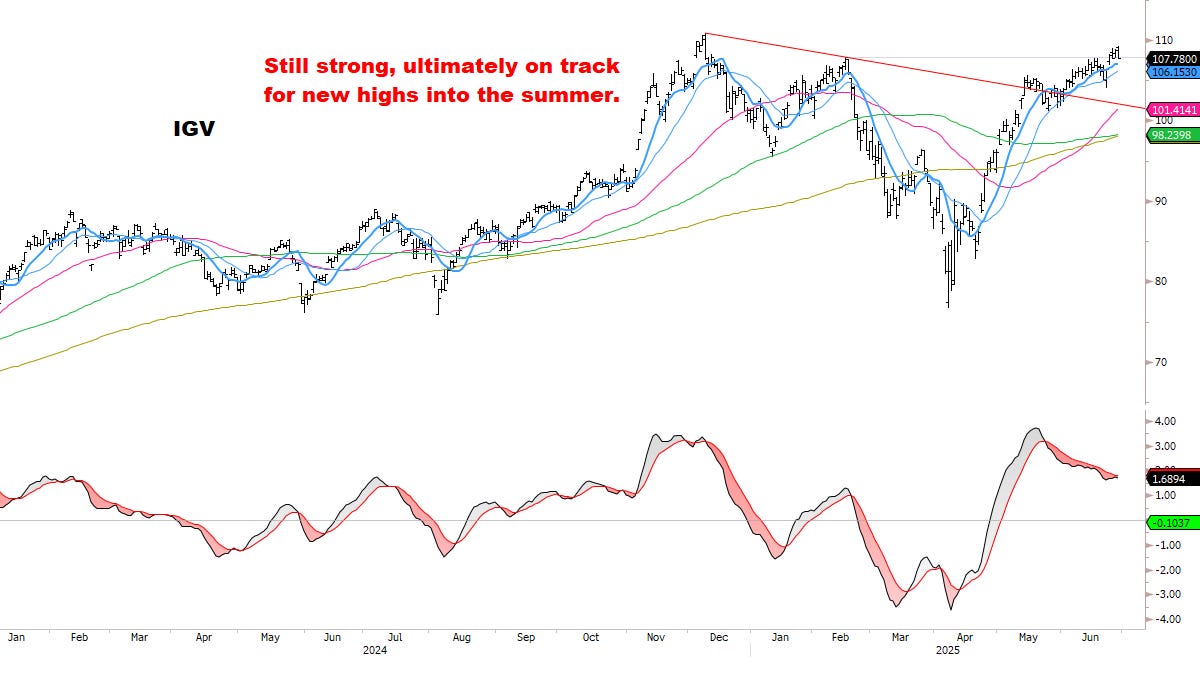
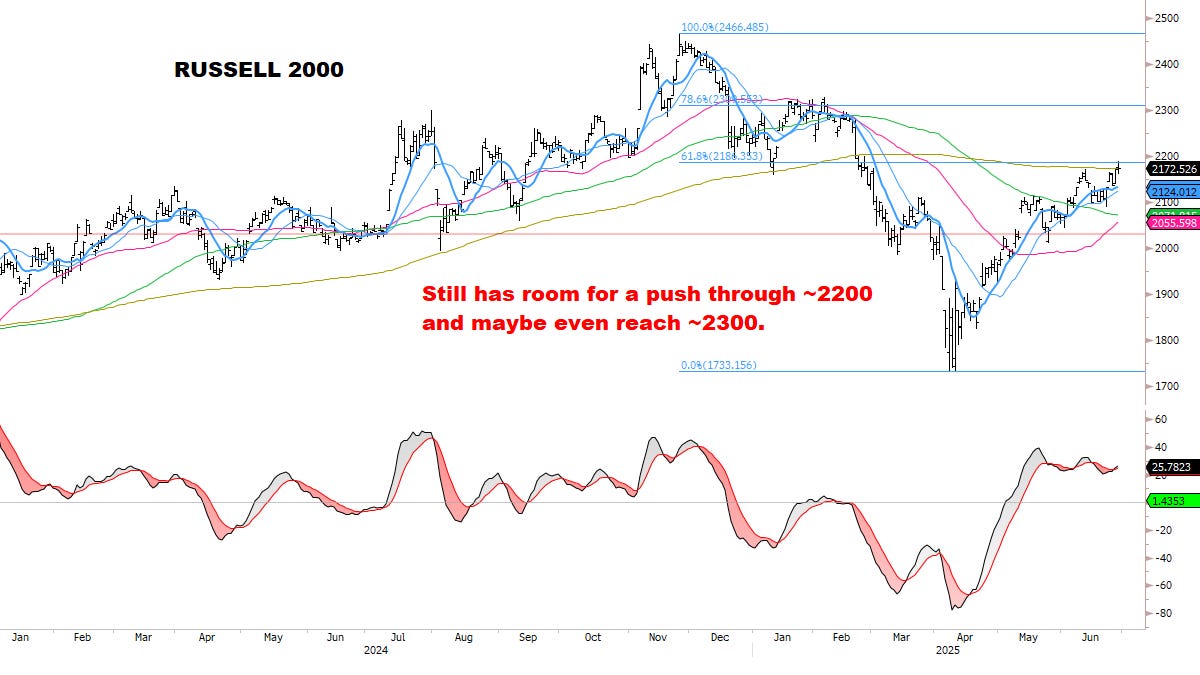
Consumer Discretionary and Russell are breaking out (see CHARTS section later) — both are joining the rally at a critical moment. They are now GREEN below, as they seem able to recover another chunk of their drawdown.
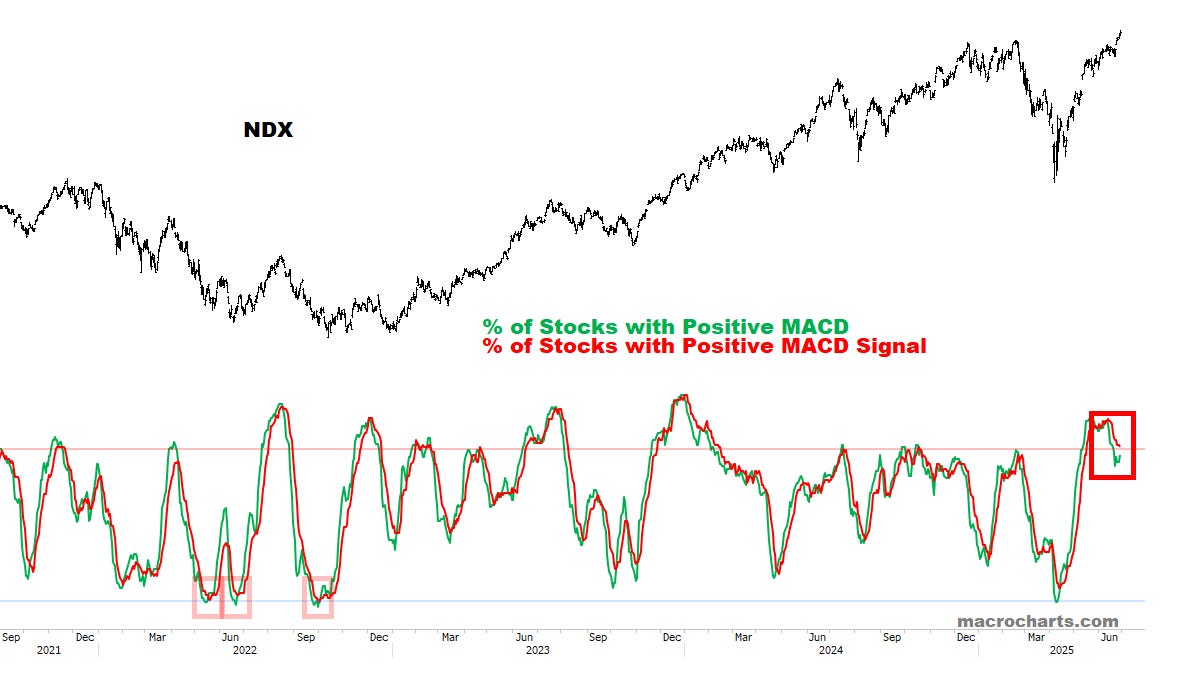
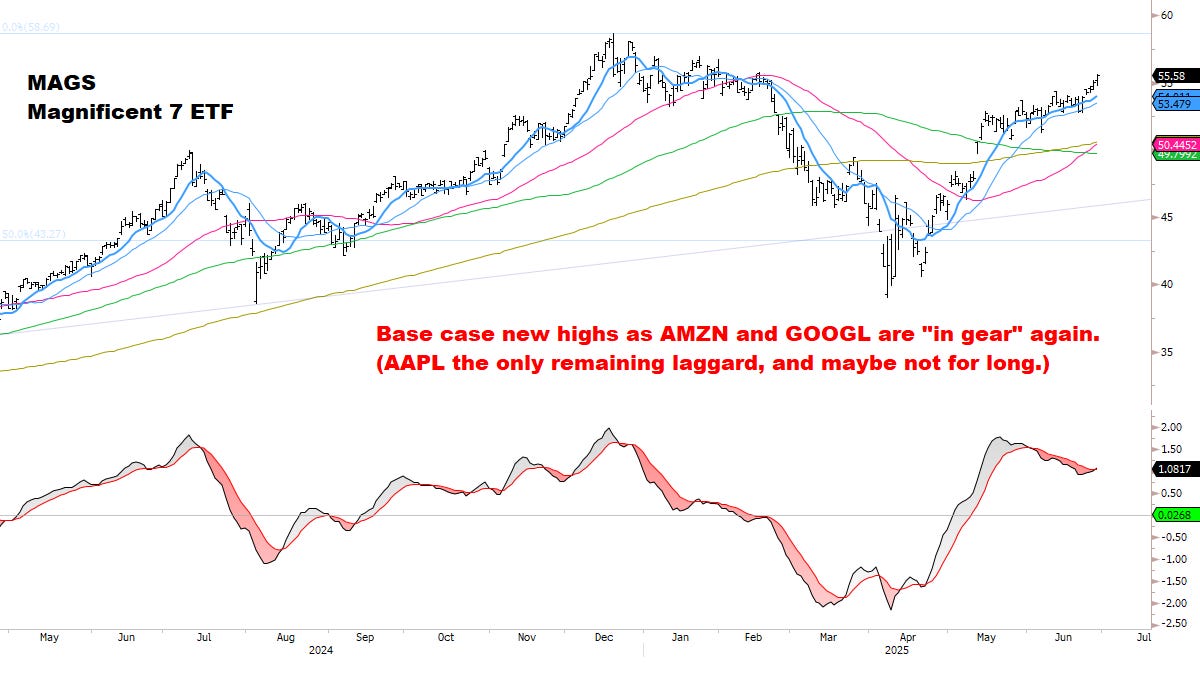
NDX is still showing significant strength — *an important bullish sign:

MACD Profiles are in pullback mode but may be rolling up again (normal rally behavior):

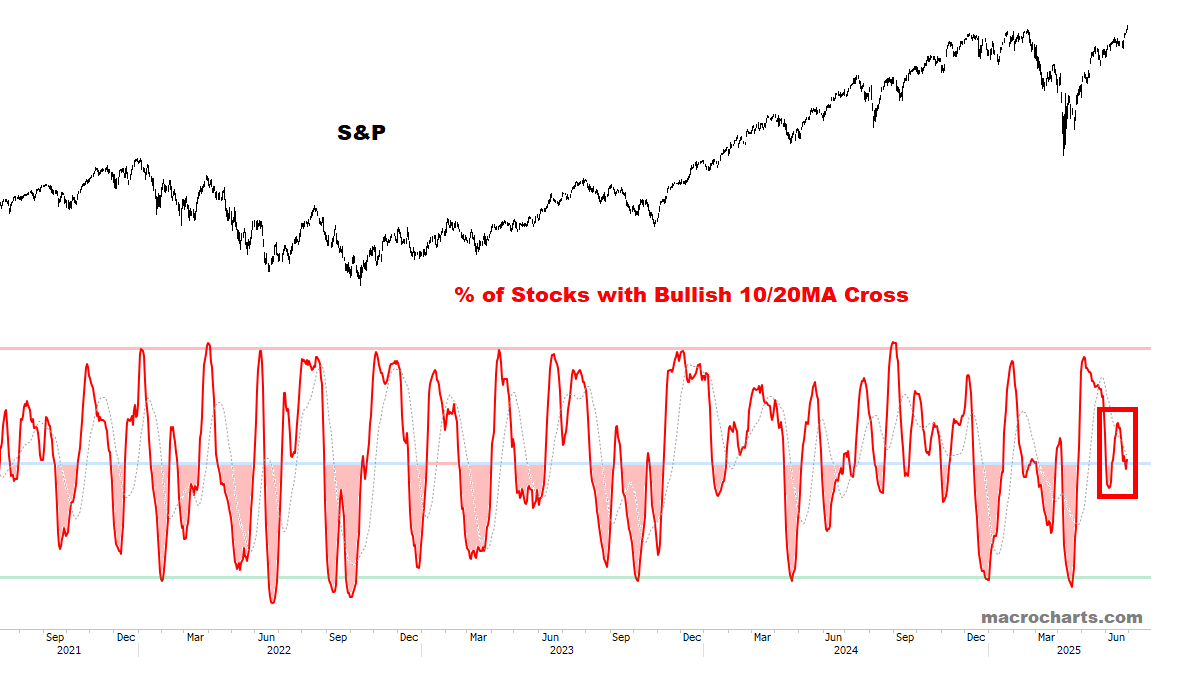
Stocks with a Bullish Cross are turning UP from neutral range (Bullish):
Long-term Breadth continues to expand bullishly:
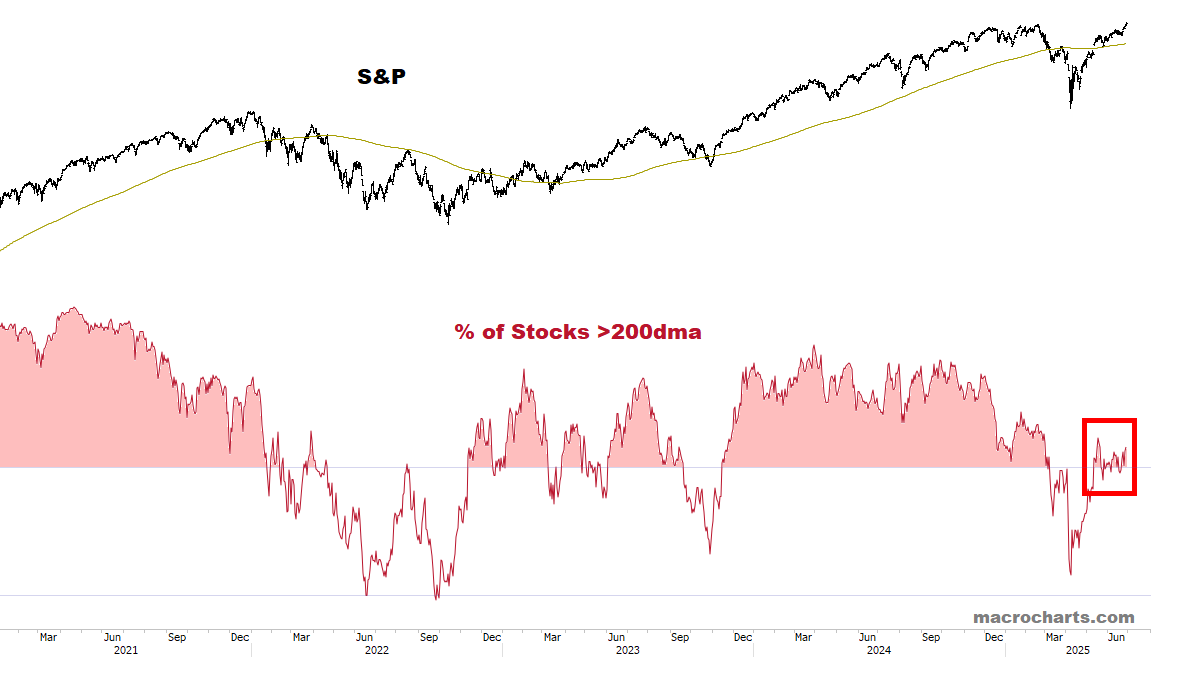
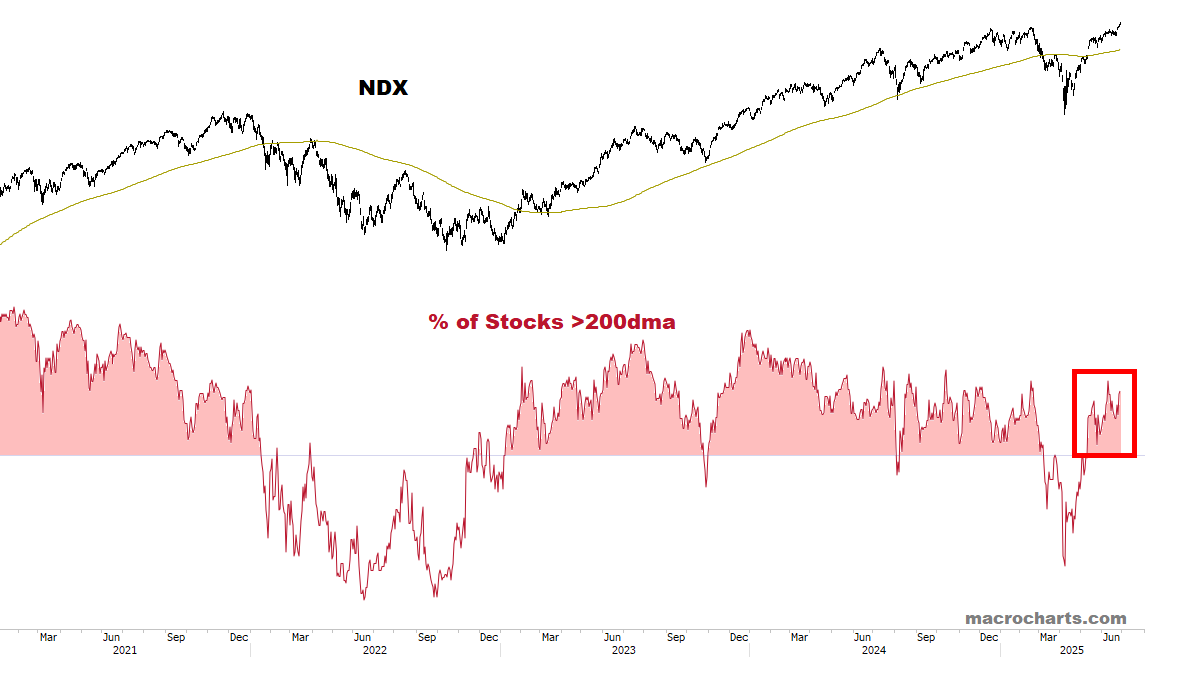
Intermediate Breadth has room to get “historically overbought” — especially if a melt-up is underway (our base case).

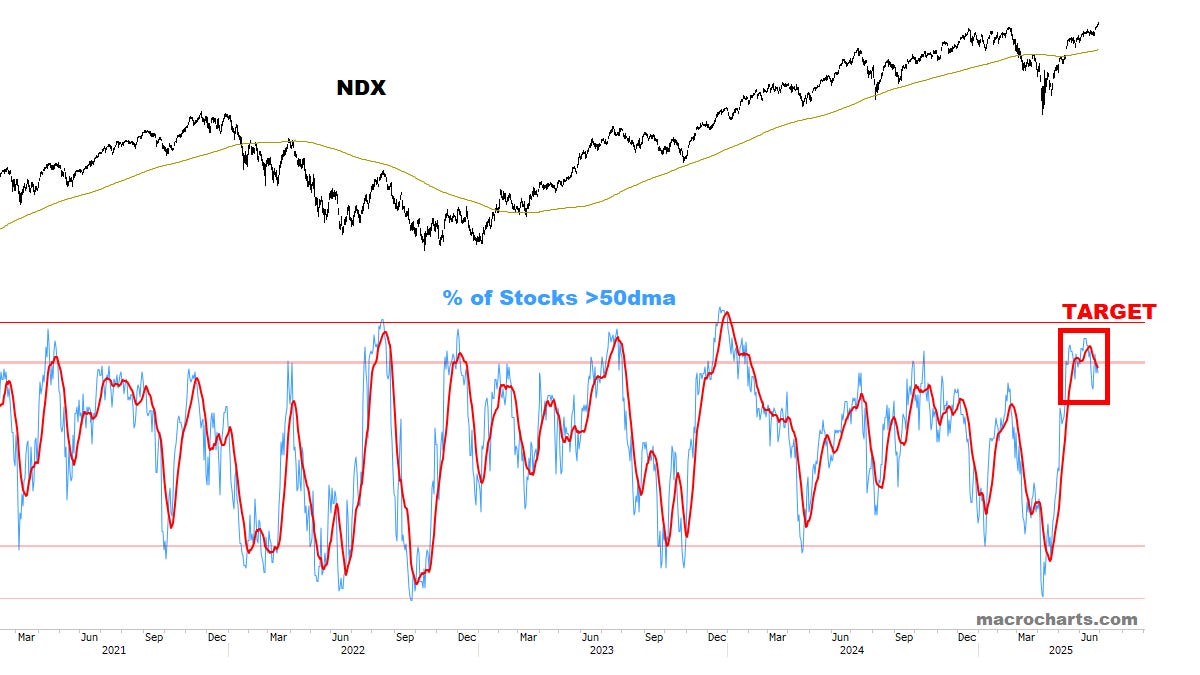
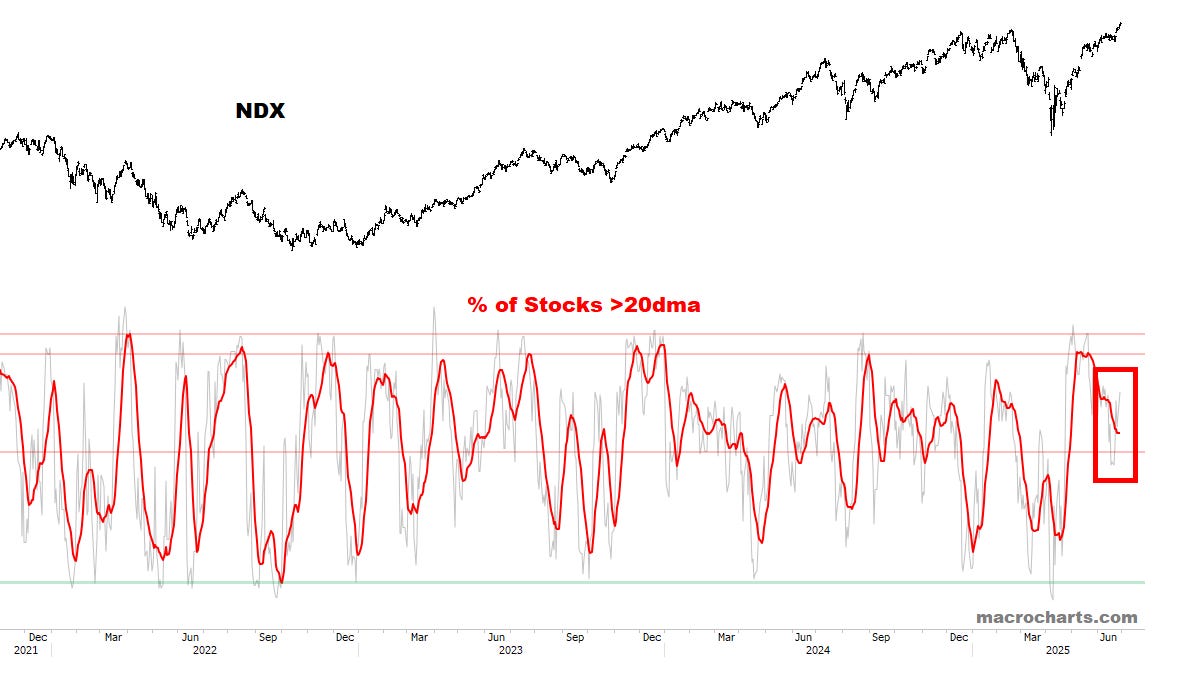
Short-Term Breadth is in position to turn back UP, which could target another push to “extreme overbought”:

Summation Index is back on a Buy signal — this is classic “melt-up” behavior:

CTA Equity Trend positioning has room to get more extended:

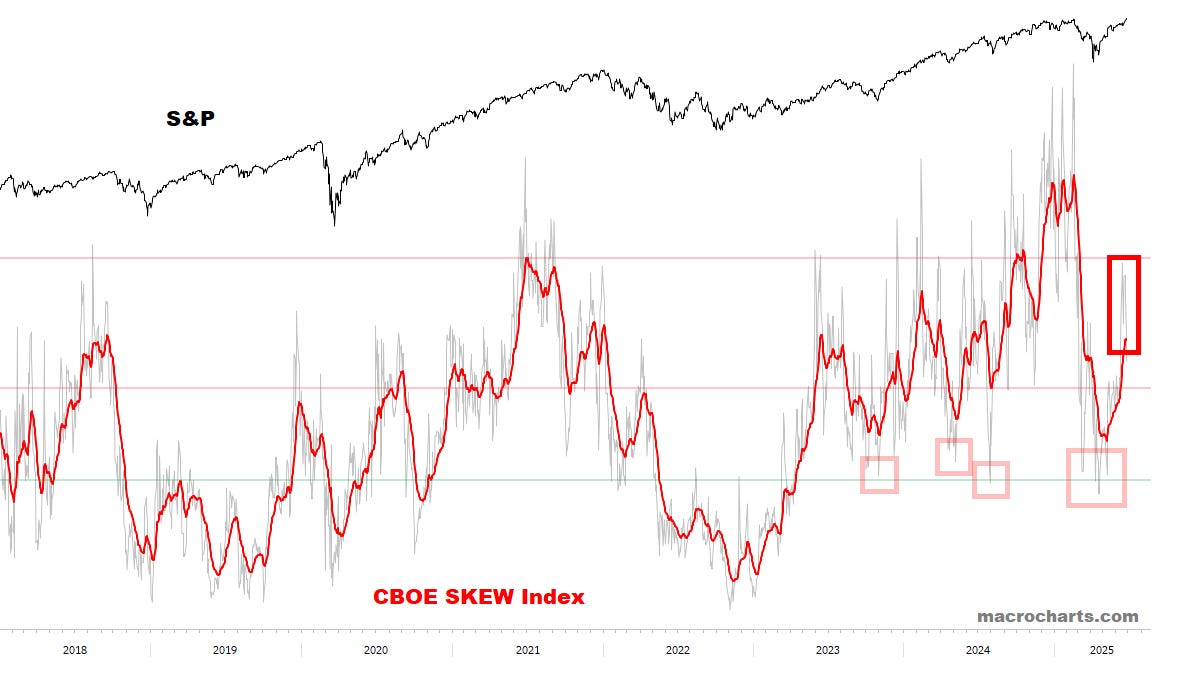
Option Skews have room to get more extended:
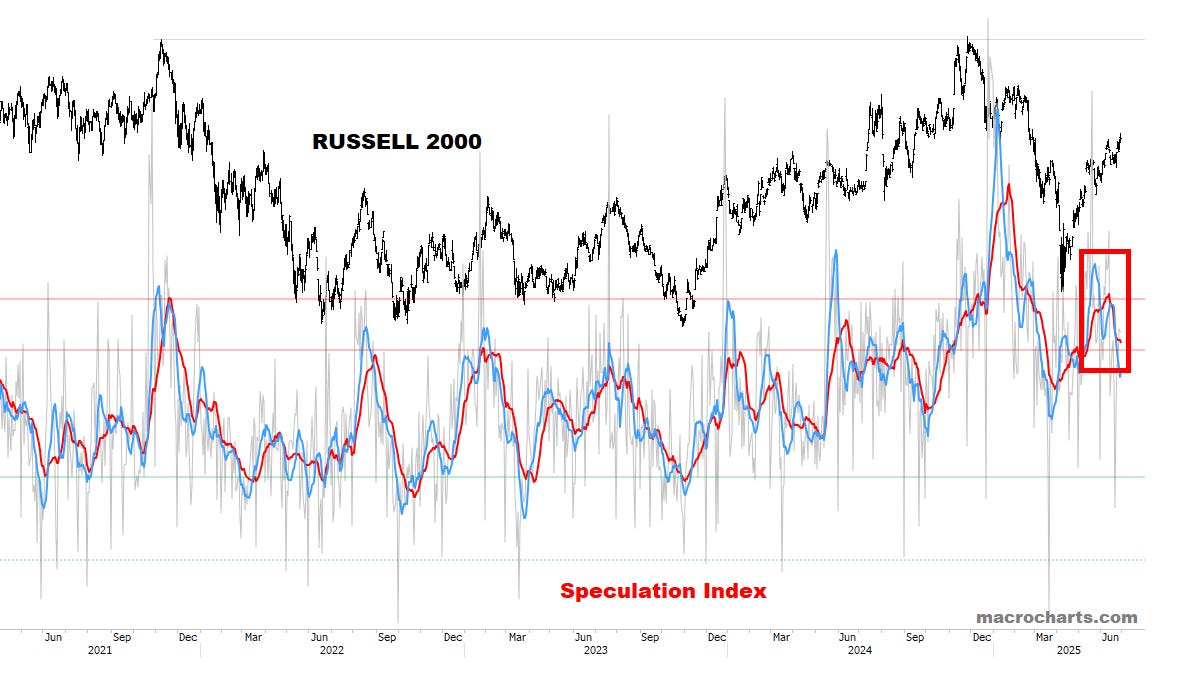
Speculation Index remains a concern — although the Russell chart looks constructive for a breakout (more on this later), I remain focused on Large-cap Growth/Tech for now:
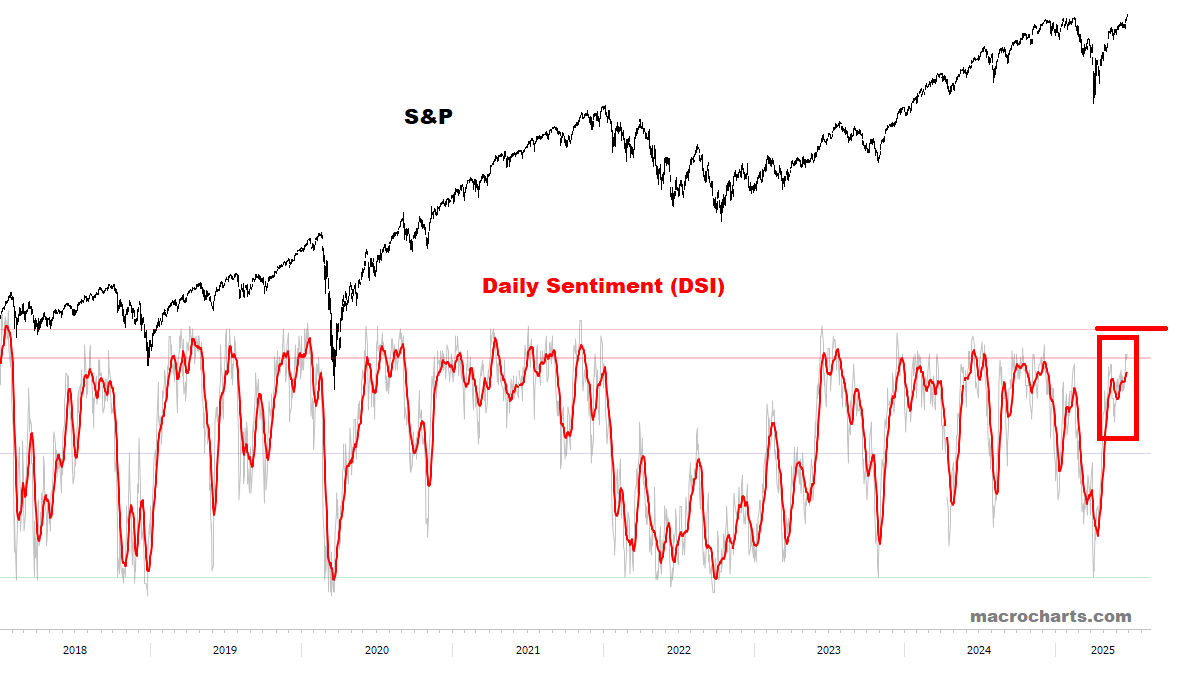
Equity Sentiment could spike higher if a summer melt-up is unfolding (our base case):

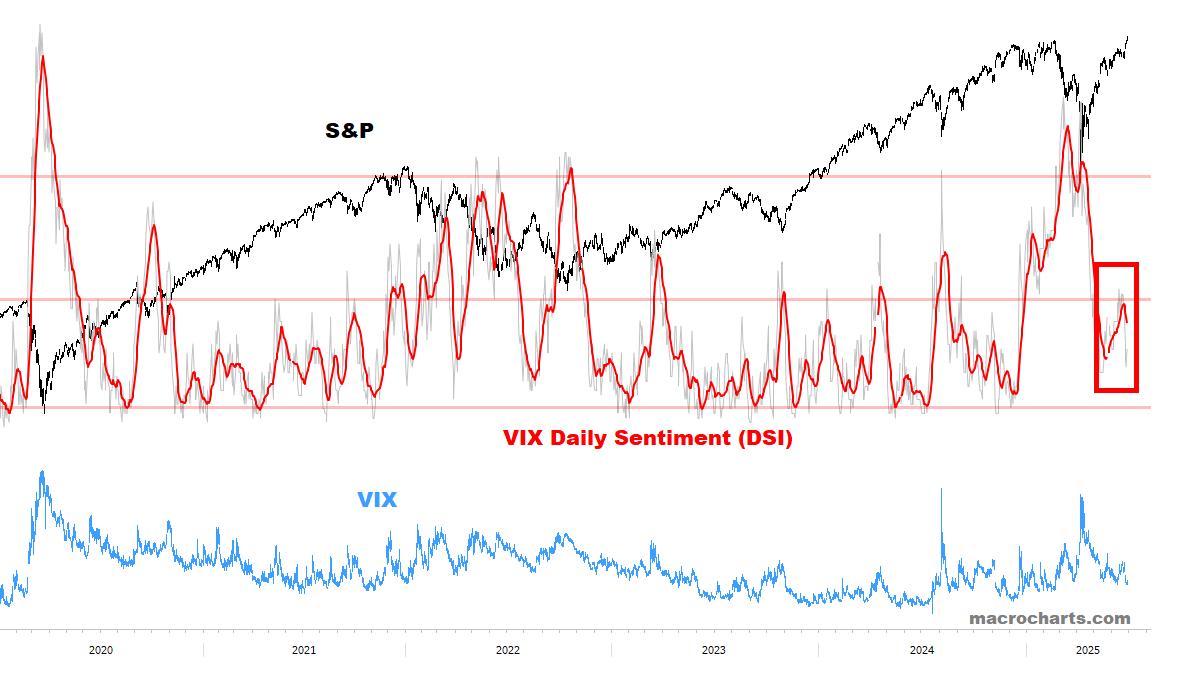
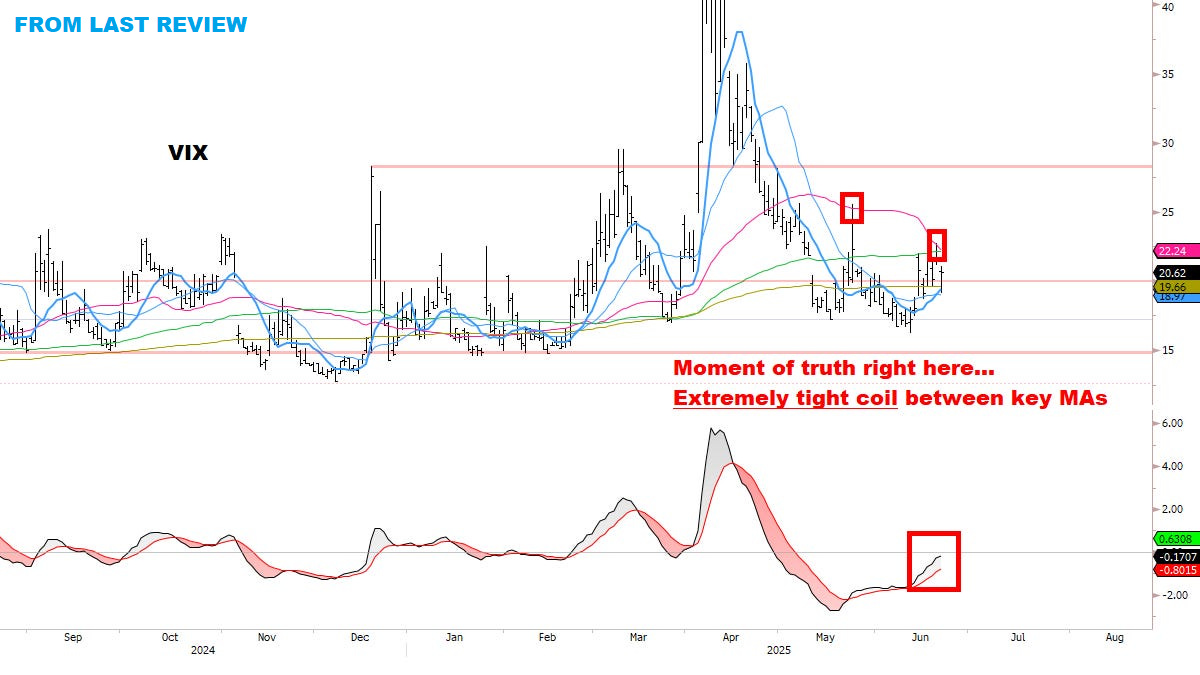
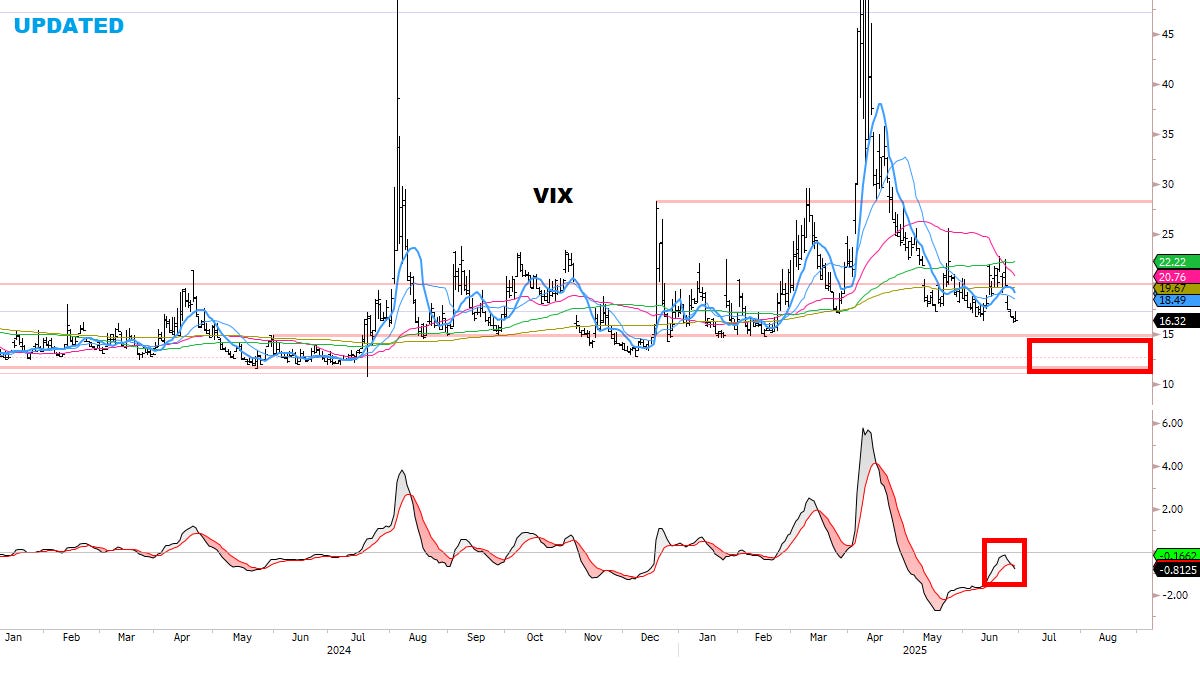
VIX Sentiment is turning DOWN from another top — and looks headed to our ideal targets (*much lower):
VIX — comments from last week: “forming a tight coil after testing ALL key moving averages. Think this should resolve lower”:


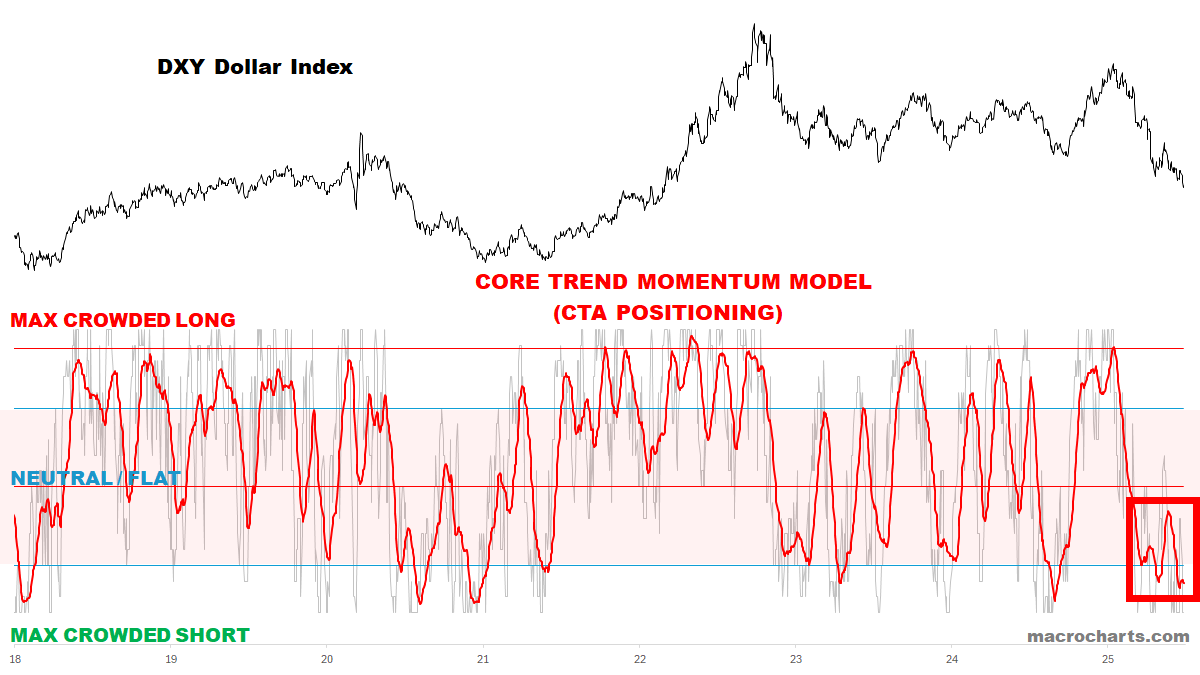
DOLLAR
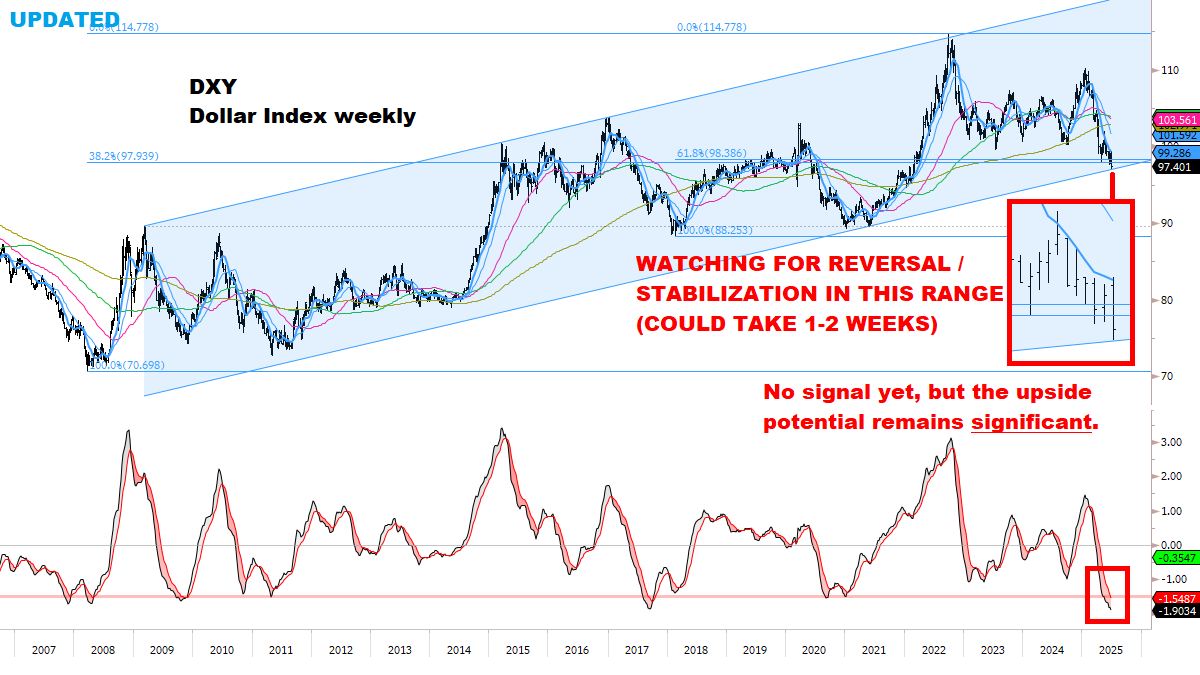
Watching closely for a potential bottom.
CTA Dollar Trend positioning is in bottoming range:
Dollar Sentiment is in capitulation range:

Dollar Net Short Positioning has broken -$20Bn, nearly tied with the JULY 2023 bottom.
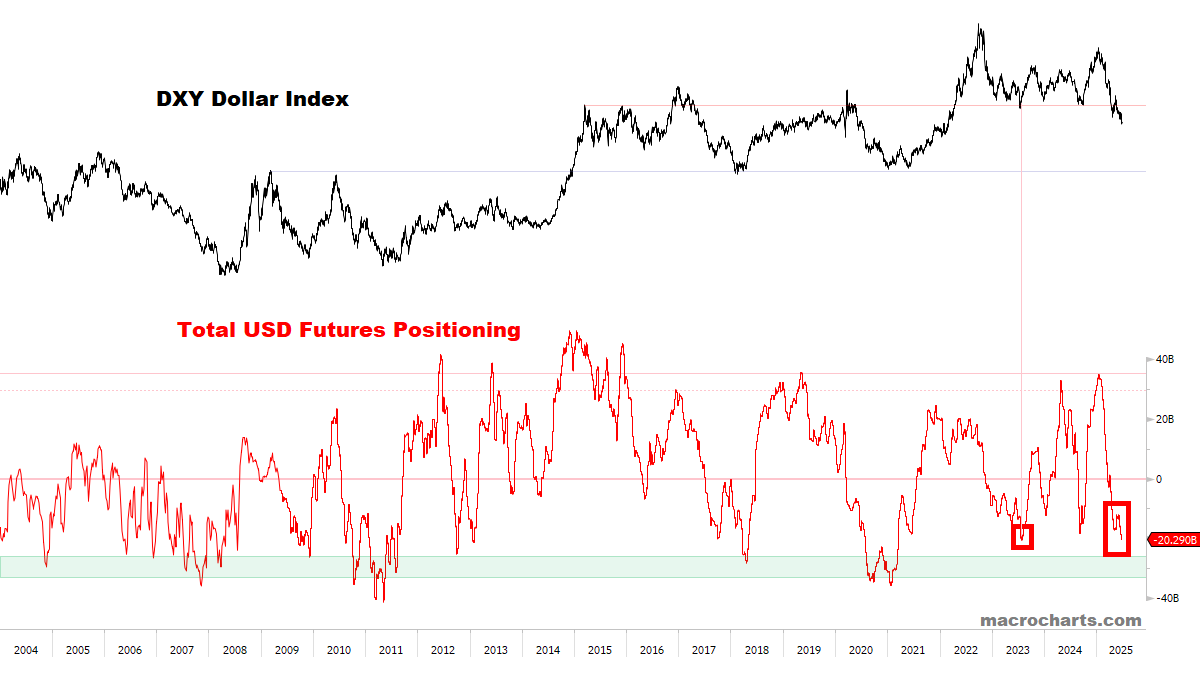
Big picture, the Dollar has significant room to recover:

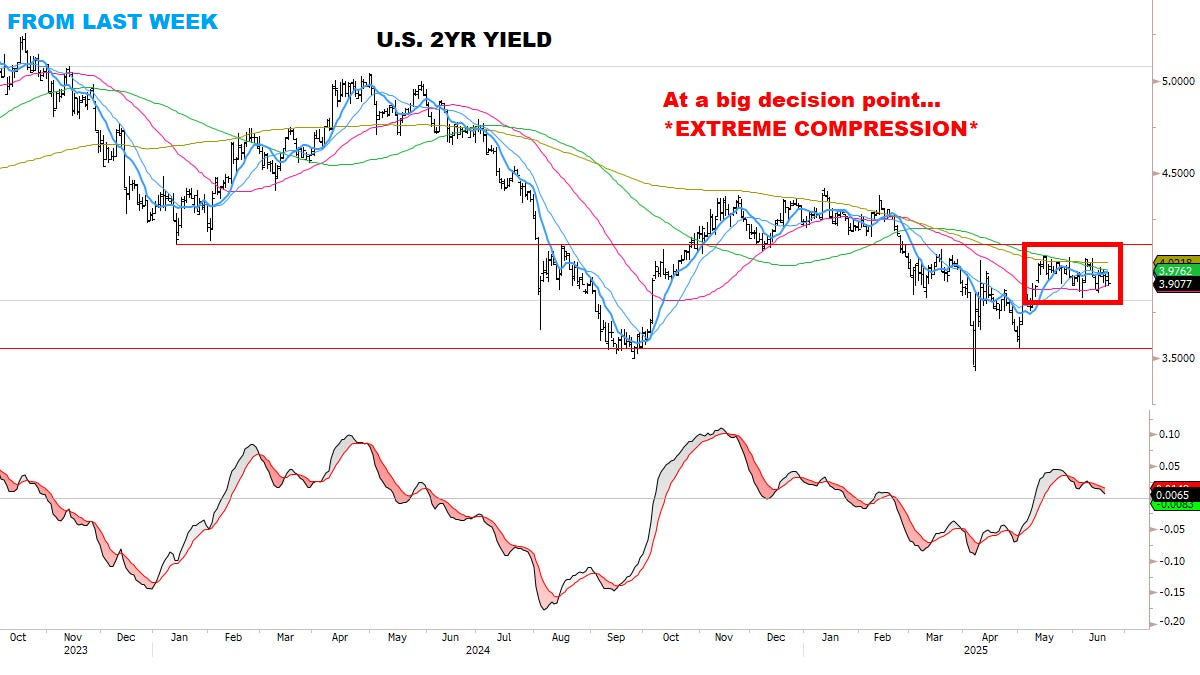
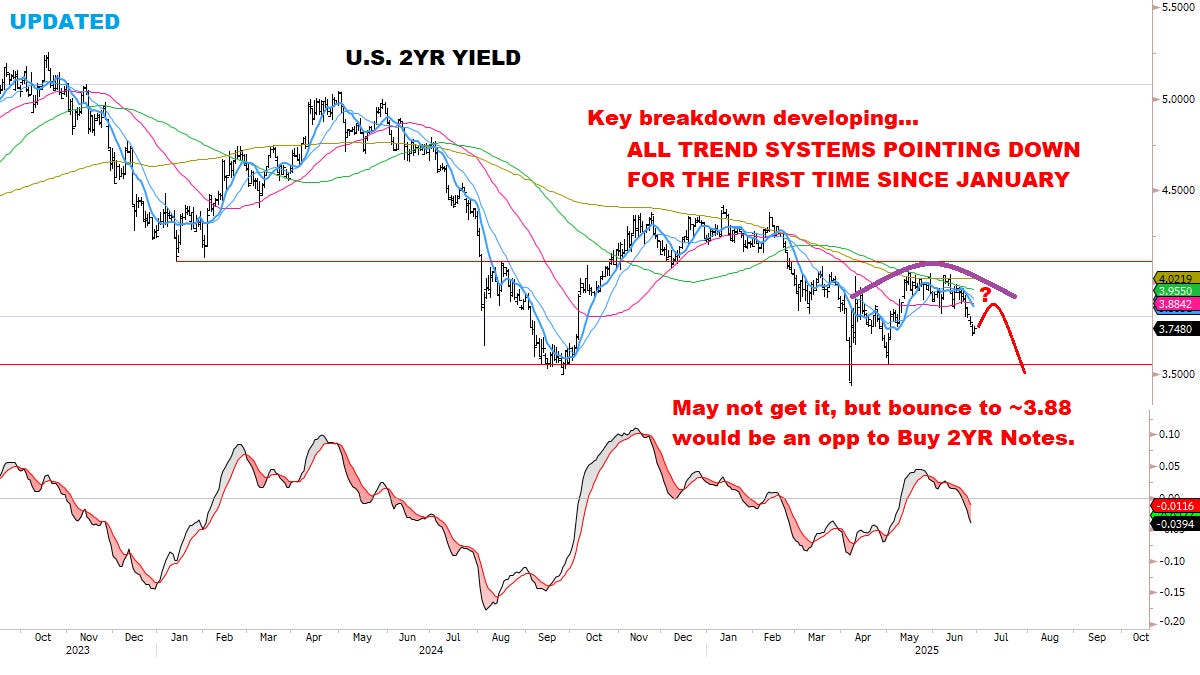
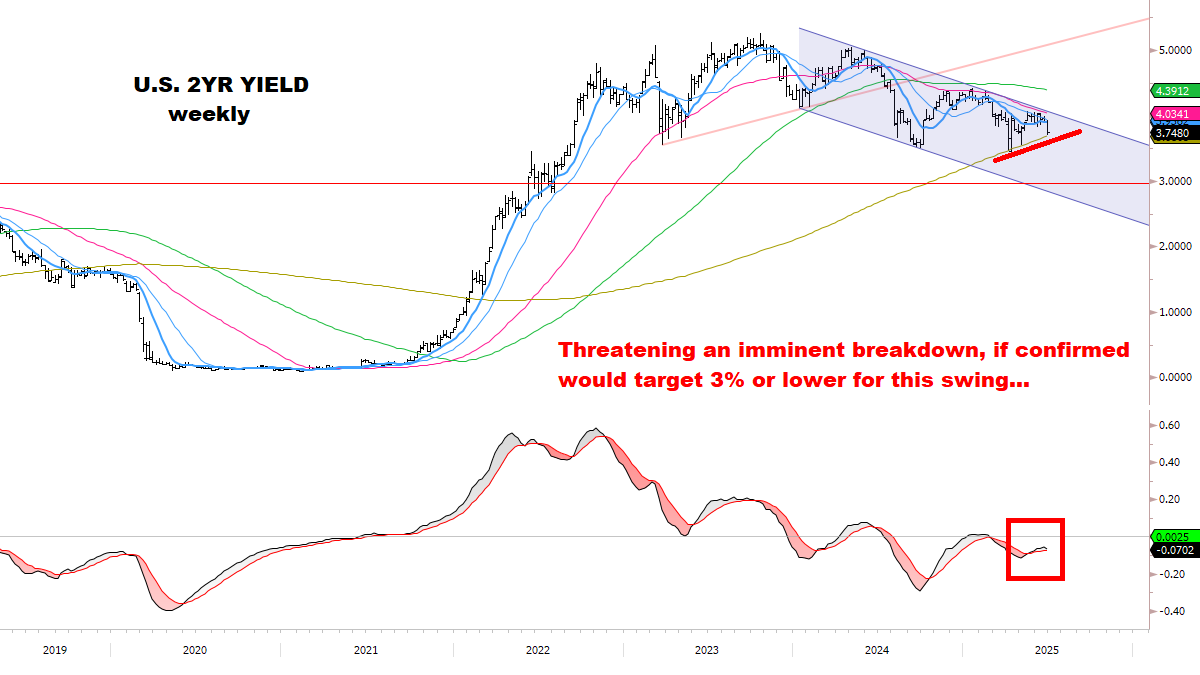
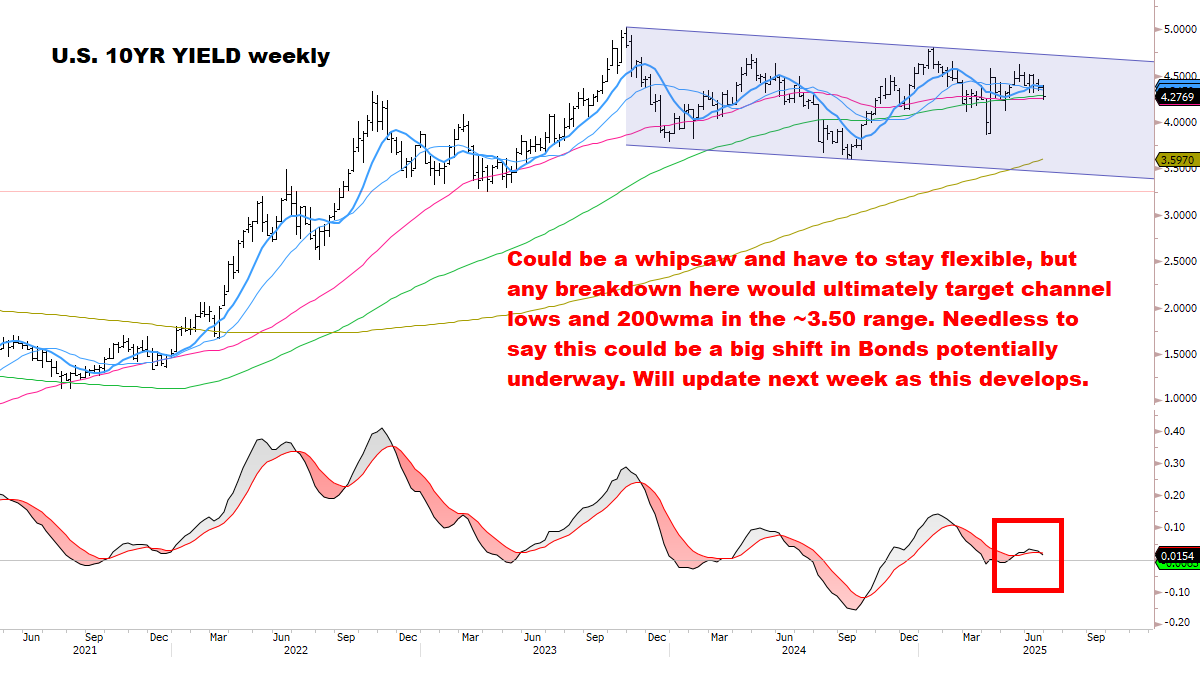
BONDS
Turning Bullish?
✅ Upgraded Bond bias to bullish.
✅ Added Bonds to Long candidate list.
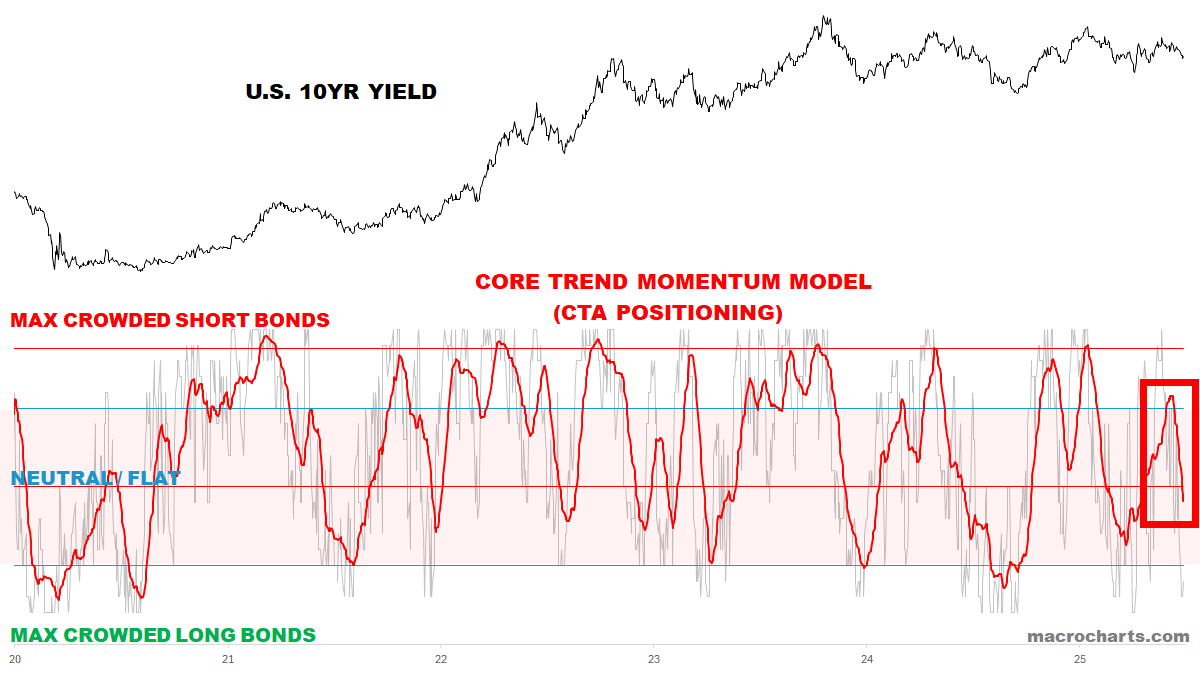
CTA Rates Trend positioning has already moved — but still has room to get extreme:
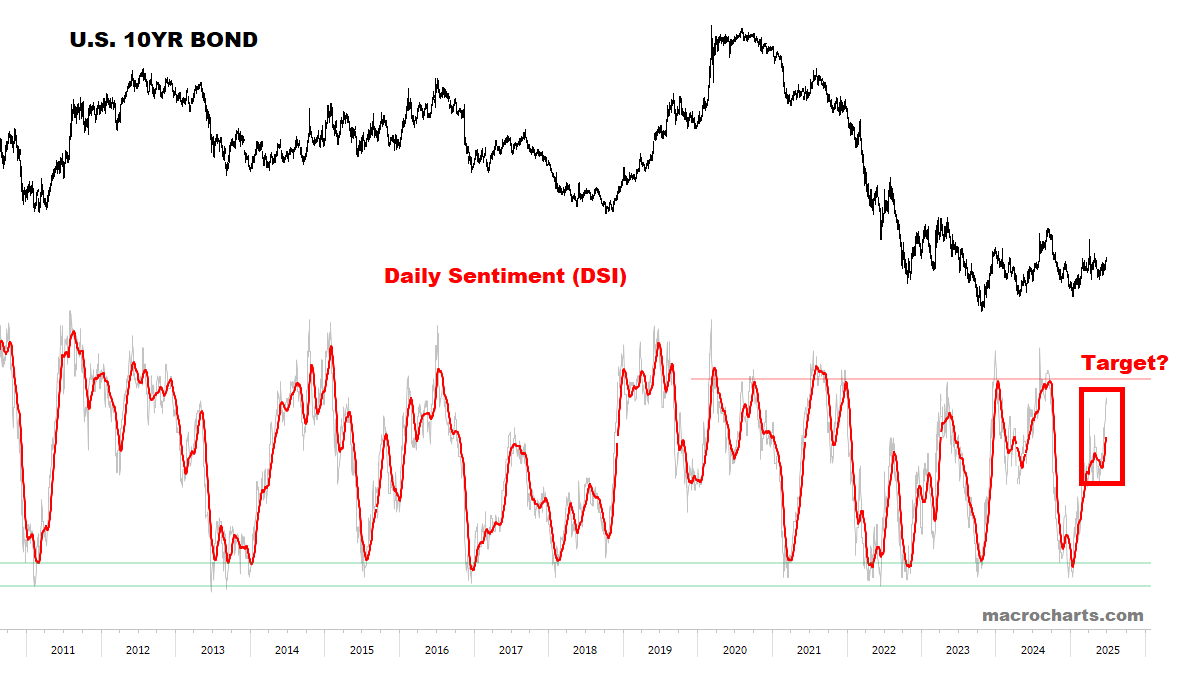
Bond Sentiment is trending higher and could push to overbought:
Buy signals are triggering (for Bond Prices) — what do Bonds know?

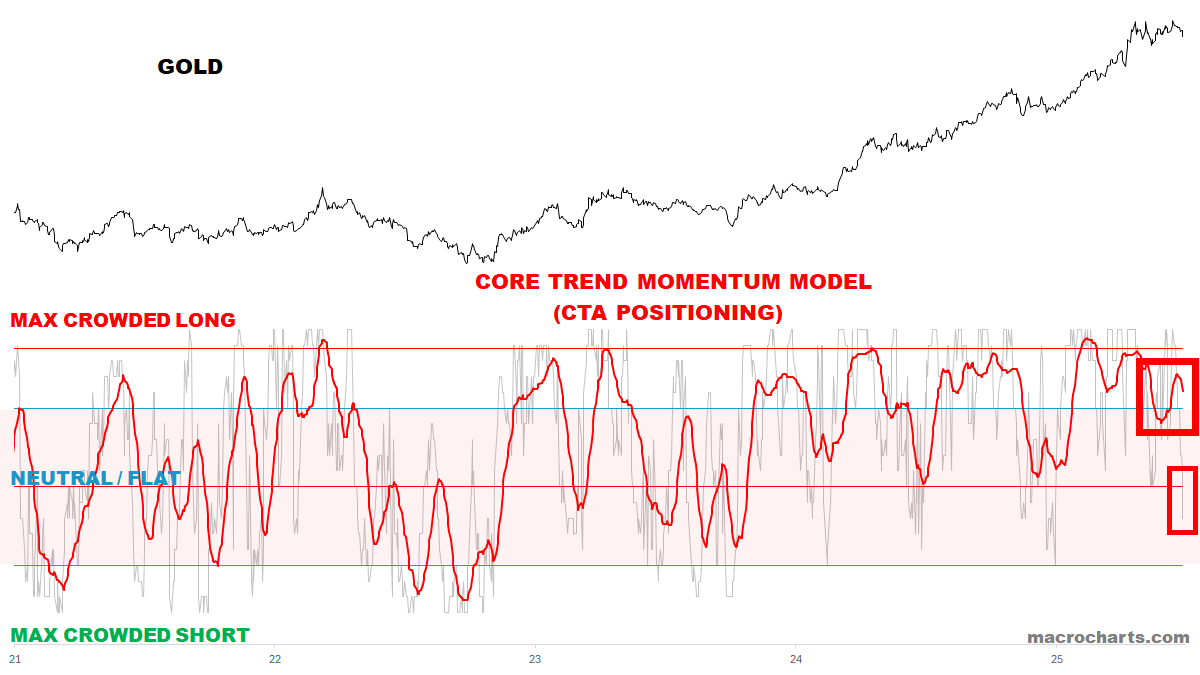
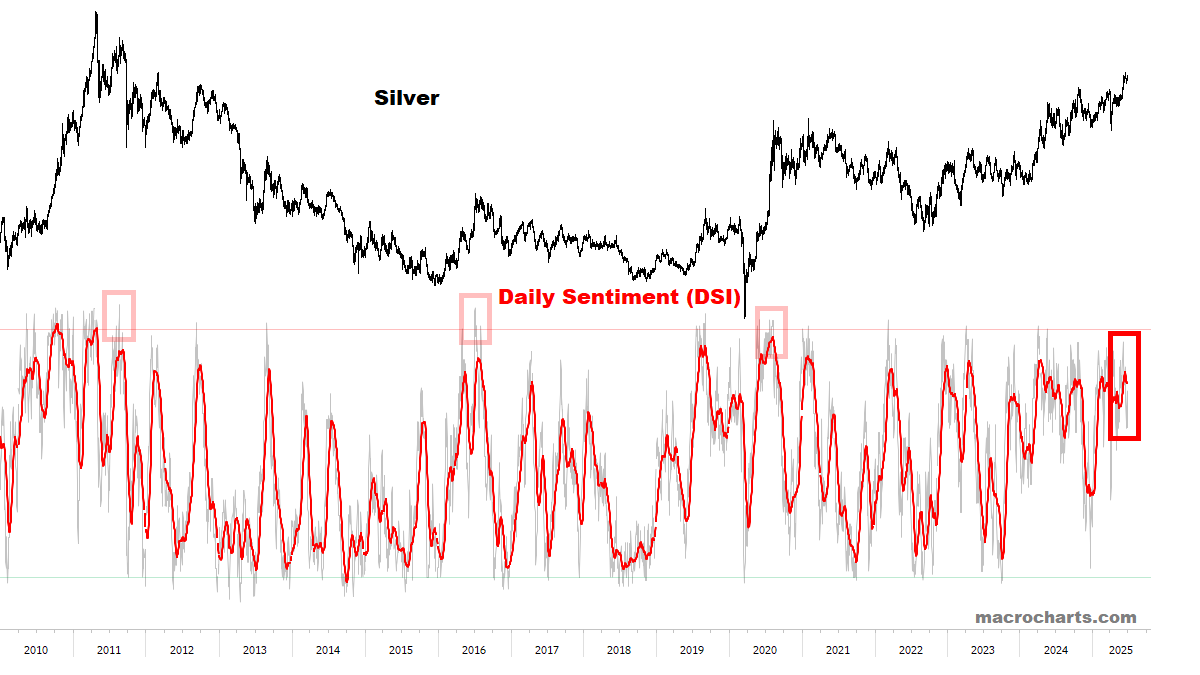
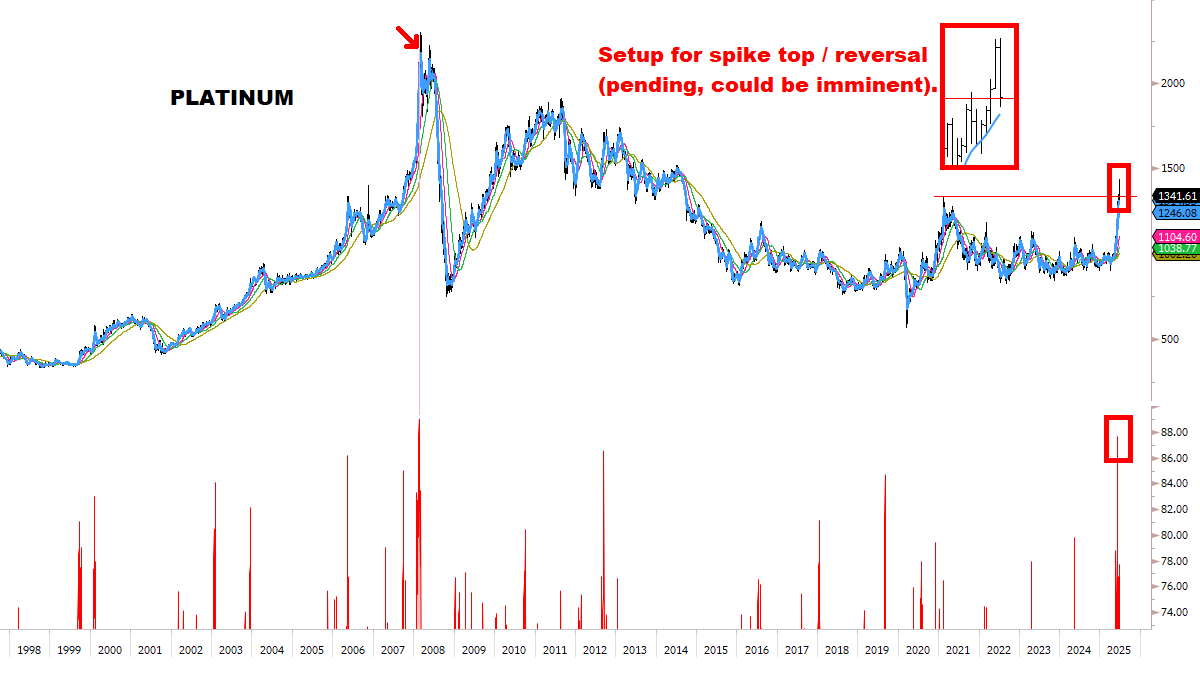
PRECIOUS METALS
Risking a Top. What do they know?
🔴 Downgraded Gold & Miners bias to bearish.
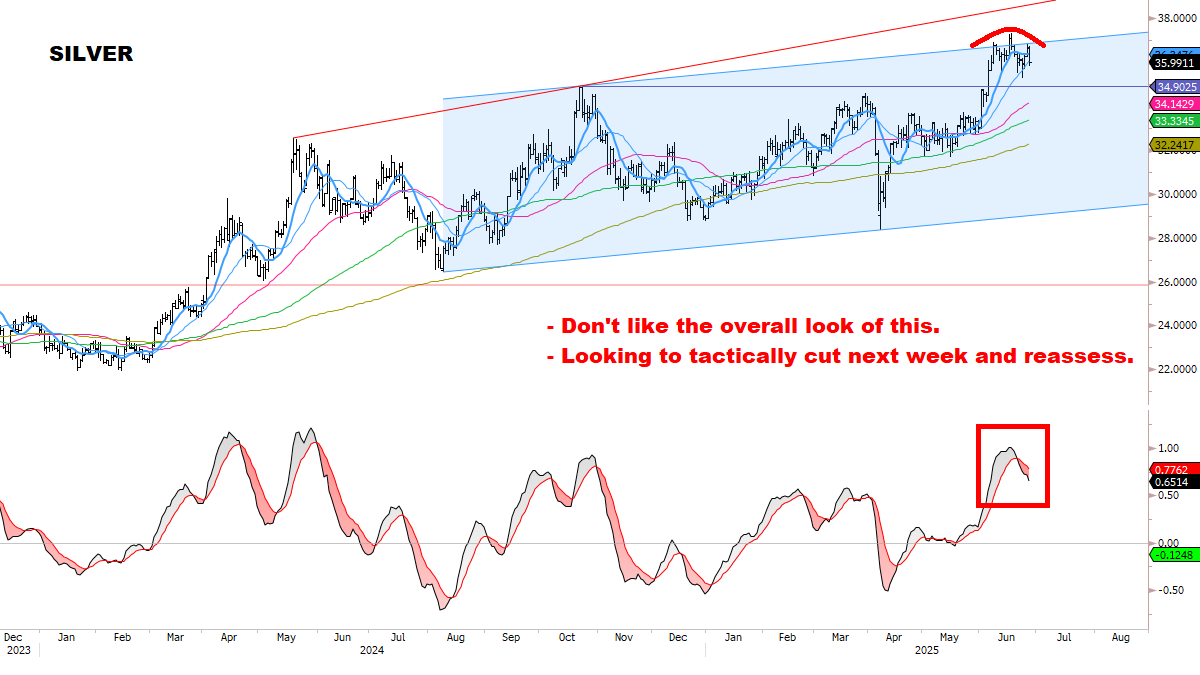
🔴 Downgraded Silver bias to neutral.
🔴 Added Gold and Gold Miners (GDX) to Short candidate list.
🔴 May cut Silver position next week for a small gain.
CTA Gold Trend positioning is vulnerable and turning DOWN again:
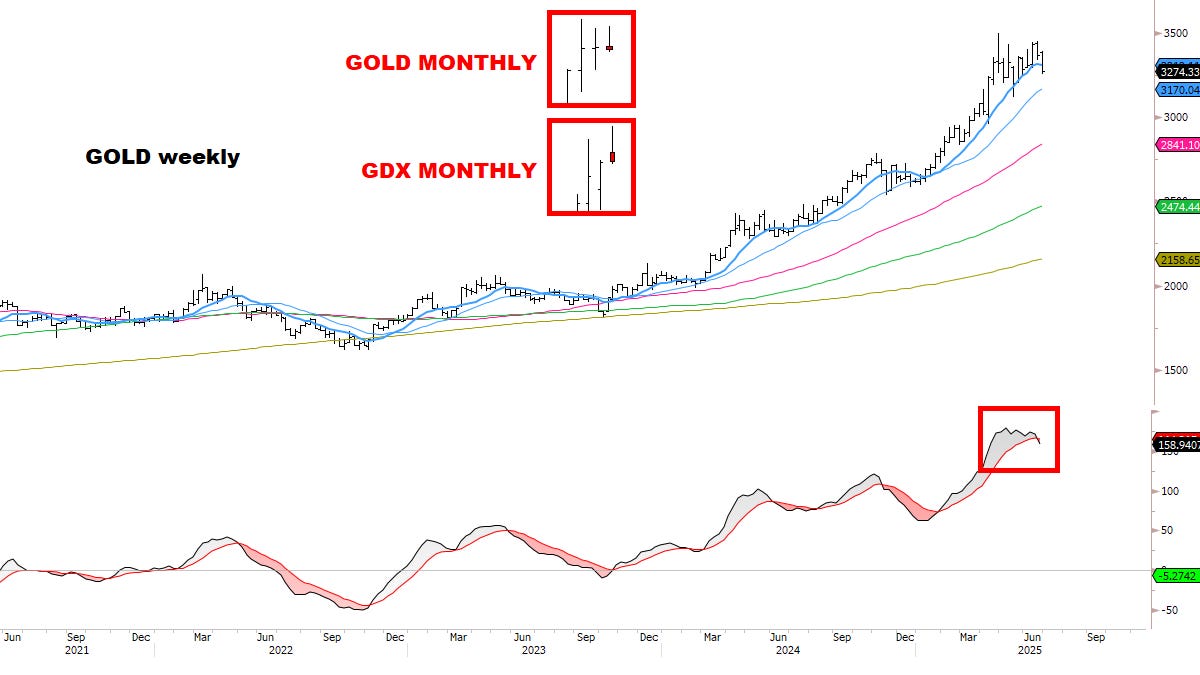
Gold has triggered a Weekly Sell — *despite the Dollar breaking down to the lowest in three years.
*Important: pending JUNE close on Monday, Gold AND Gold Miners are potentially forming a MONTHLY Bearish Shooting Star — risking a Top.
What does Gold know?
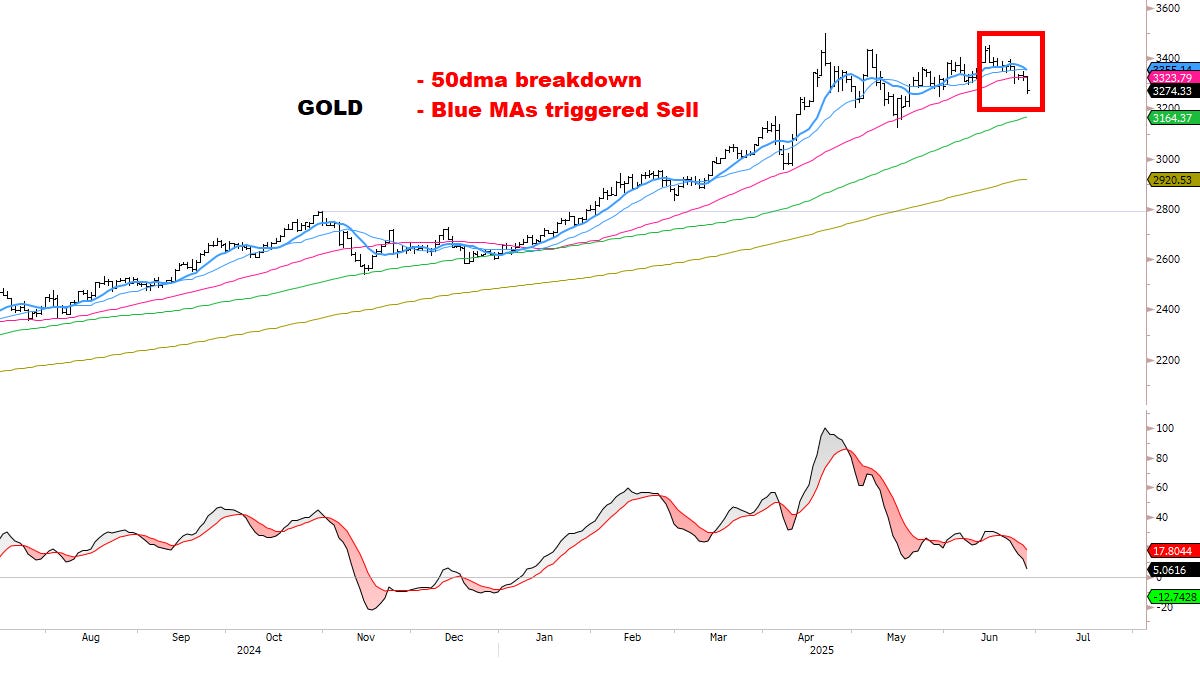
Even worse, Gold also broke its 50dma this week — which I’ve said is a *critical* line in the sand.
A significant shift may be underway here:
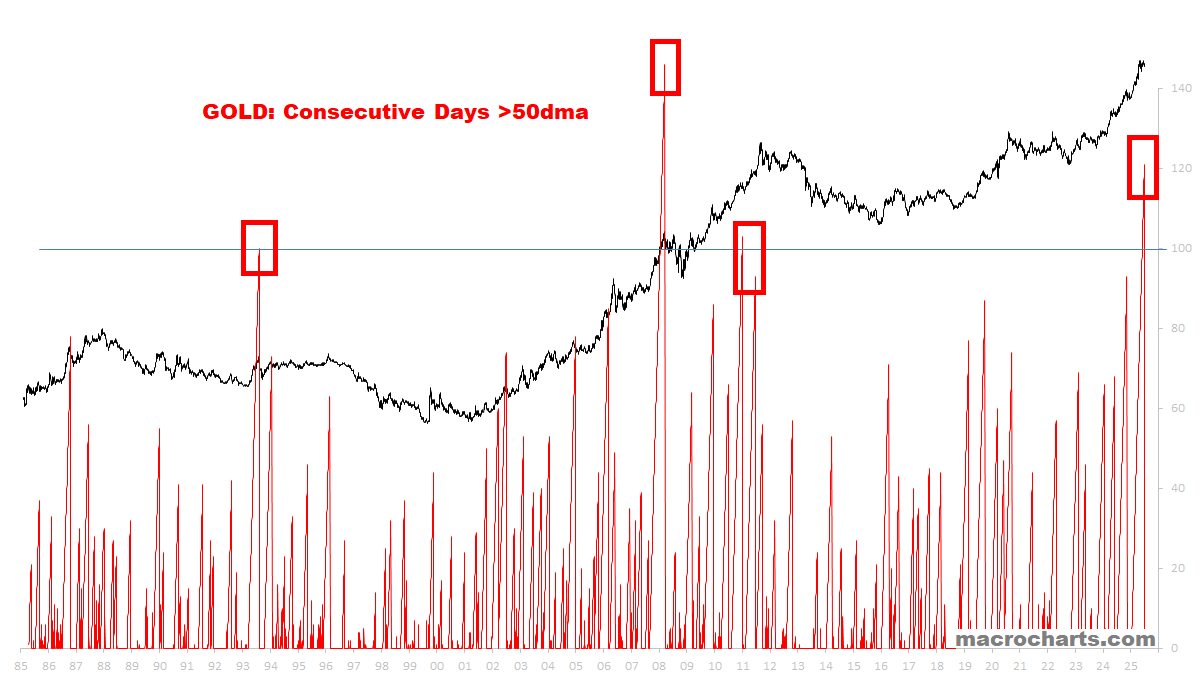
What does Gold know? Is the Dollar bottoming?
Few good precedents:
1. Gold was 121 days above the 50dma, and broke down this week.
2. When this happened in 2011, Gold managed to rally a few more months but ultimately formed a major Top.
3. In 2008, Gold topped on March 17 and then on March 19 Gold broke its 50dma (after being 146 days above it). The rest was history.
4. In 1993, Gold peaked and corrected -17%, then spent three years in a sideways range which then led to a three-year breakdown.
Related, Gold may also be tracking with 2016 — similar to Equities:
1. These may be small clues for now… but Gold has a tendency to top around mid-year, and then correct into year-end (until nobody cares about it anymore).
2. Maybe it doesn’t fall too much, but even the idea of Gold treading water for a few months is an extreme contrarian view here. Which says a lot about the prevailing mood.
3. Maybe Gold is sensing a shift in the Dollar for the second half of 2025?
4. If so, this could be THE biggest Macro surprise in the markets, and nobody seems ready — so we want to stay focused the next few weeks.

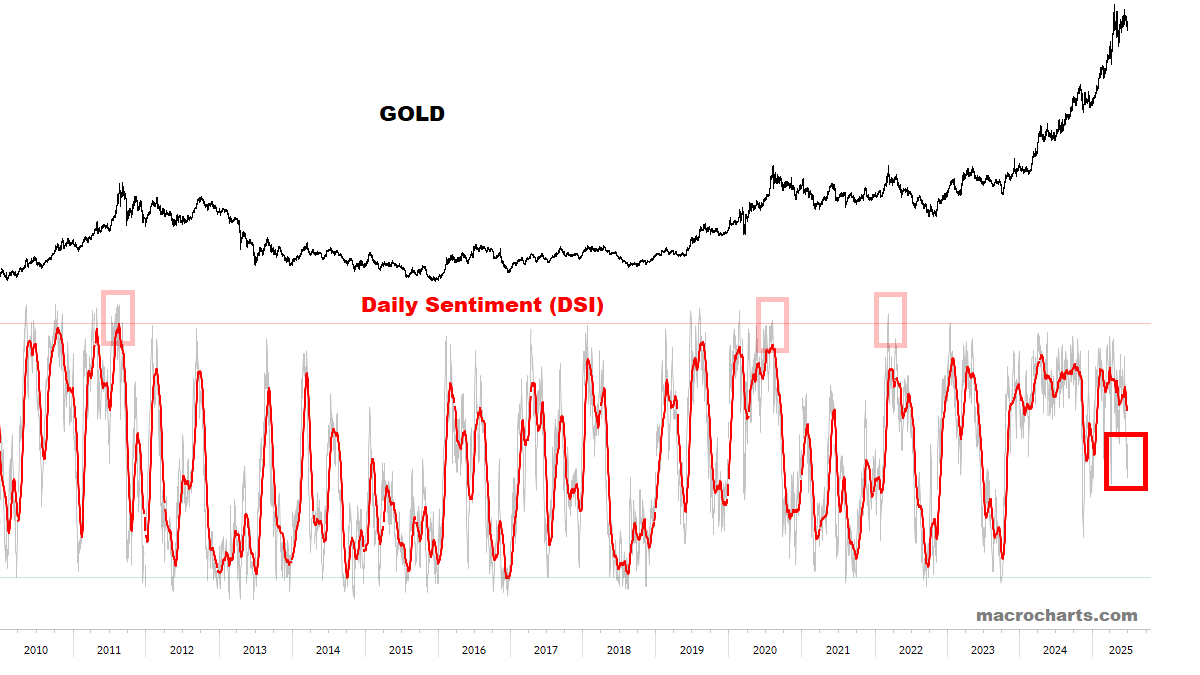
Precious Metals Sentiment never got extreme but may be turning down:
KEY TECHNICAL CHARTS
A QUALITATIVE ASSESSMENT (CONTINUED)
On April 30 in “What’s Next For Stocks?”, I wrote:
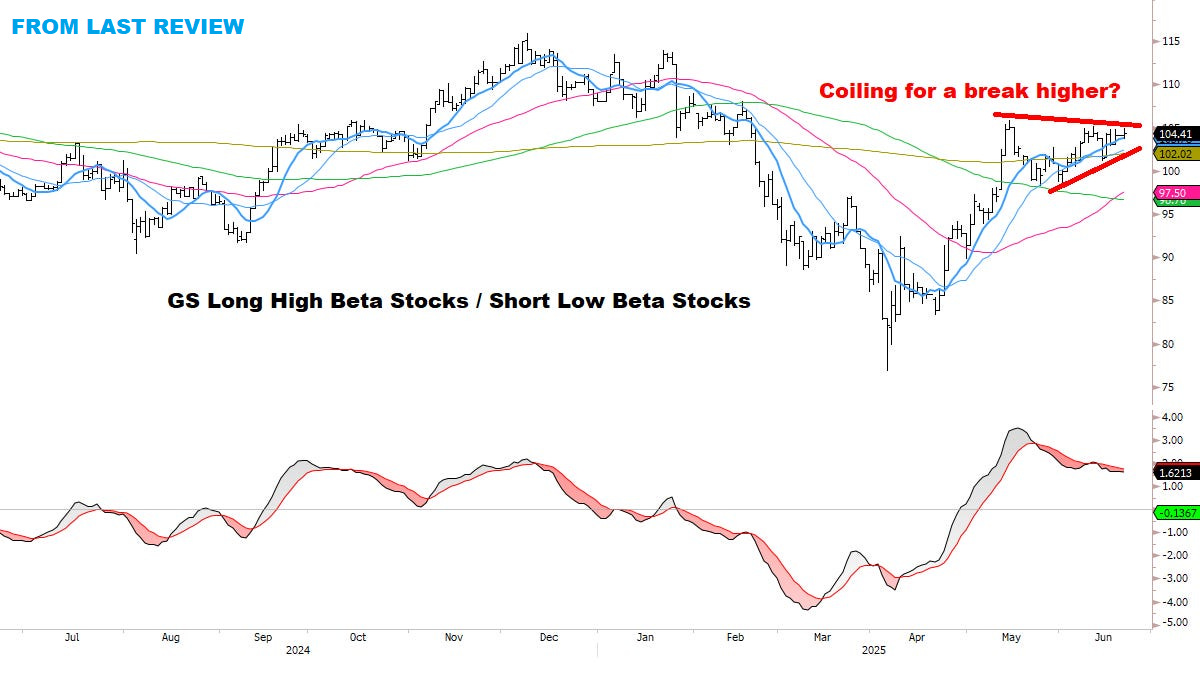
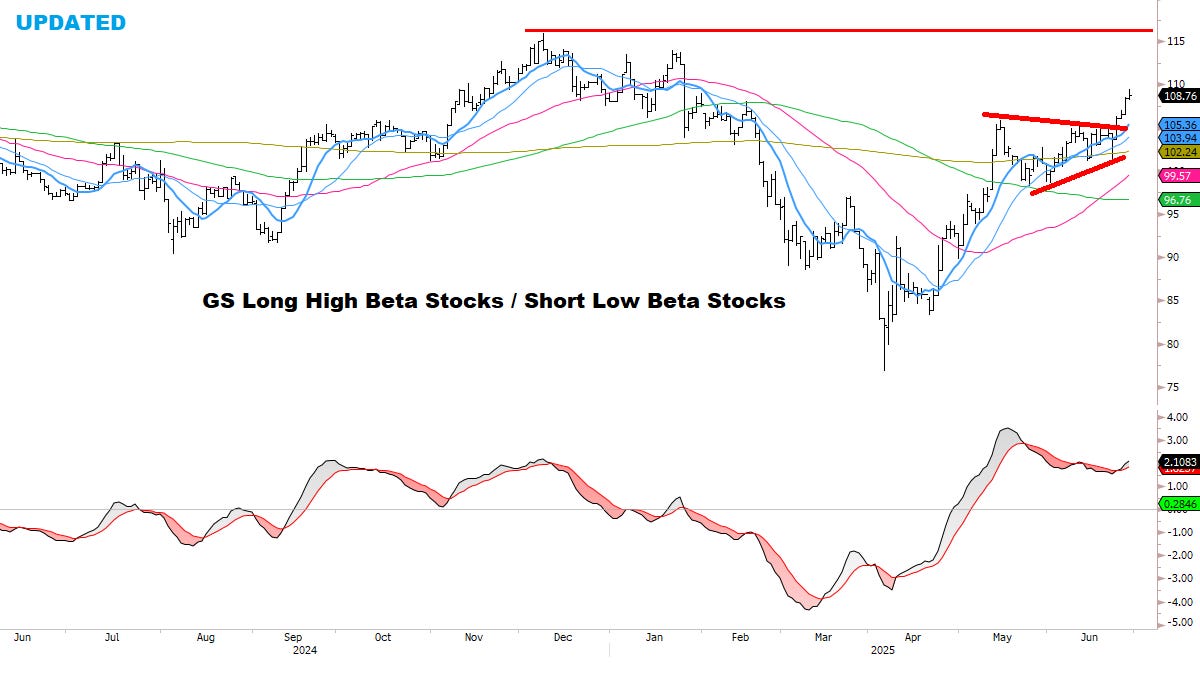
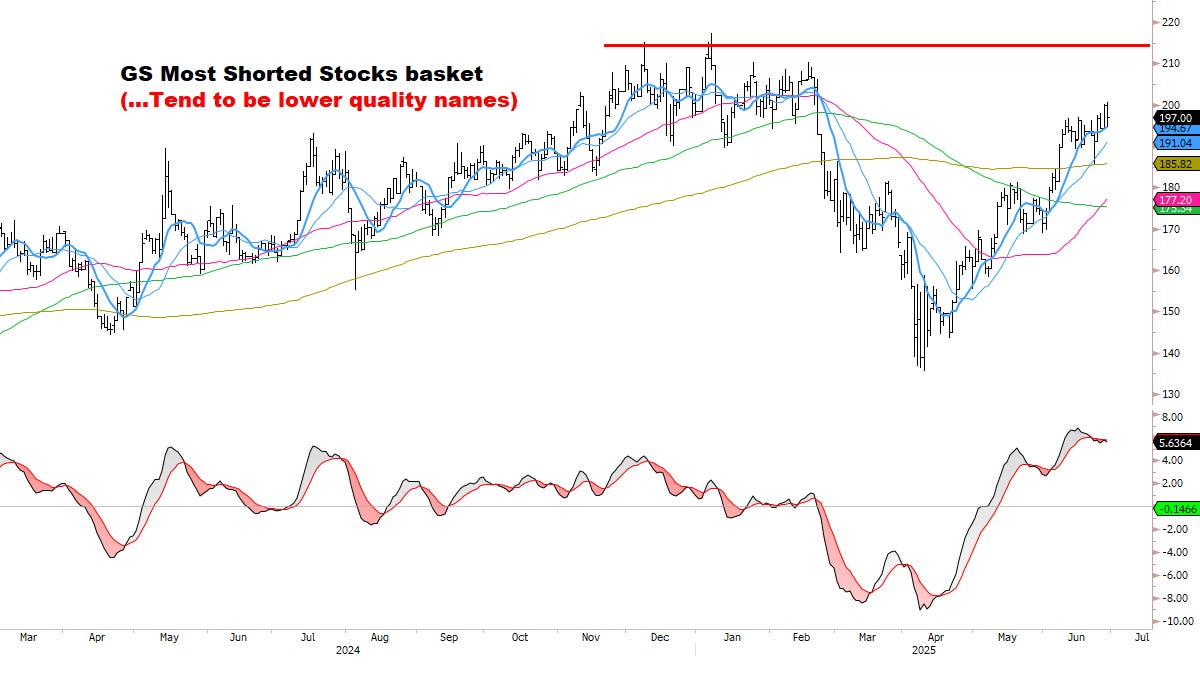
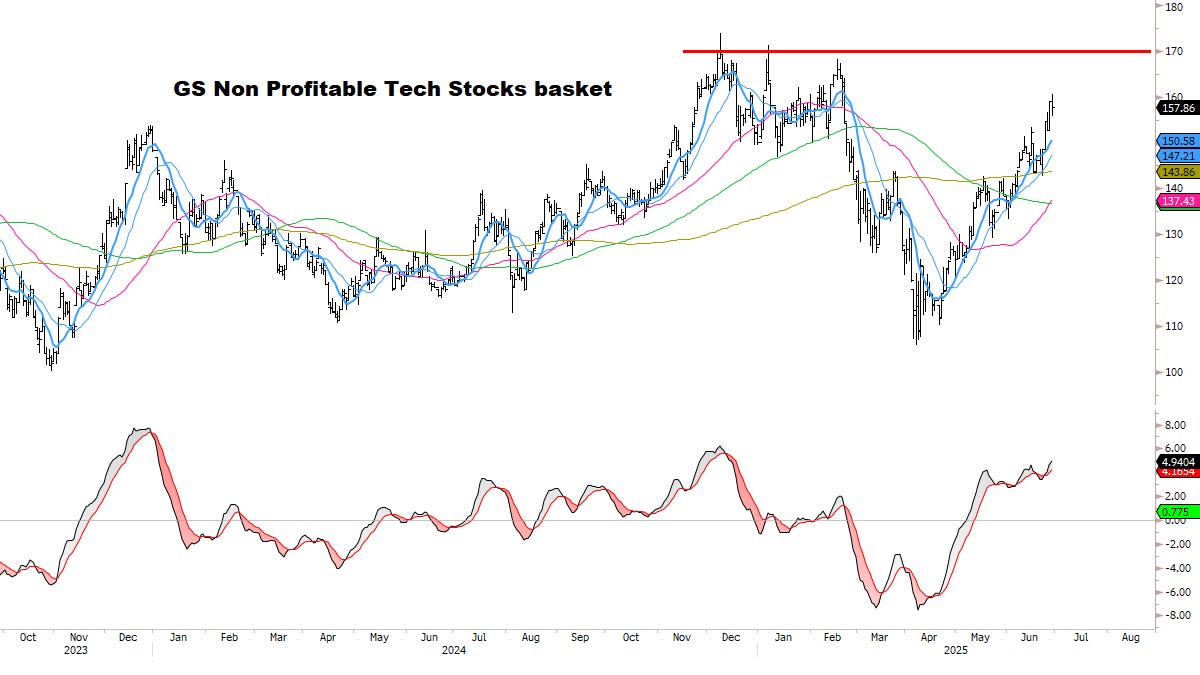
Inevitably, at some point in every rally, the wall of worry finally crumbles and even the garbage gets bought.
This extreme risk-seeking behavior is fueled by two forces: performance-chasing, and general FOMO taking over.
Looking around today, quantitatively and qualitatively I don’t think we’re quite there yet. I also think it will be a much different market picture in a few weeks’ time.
Are we there yet? I still don’t think so.
Things could get more frothy — in no particular order:

Let the market say what’s next:
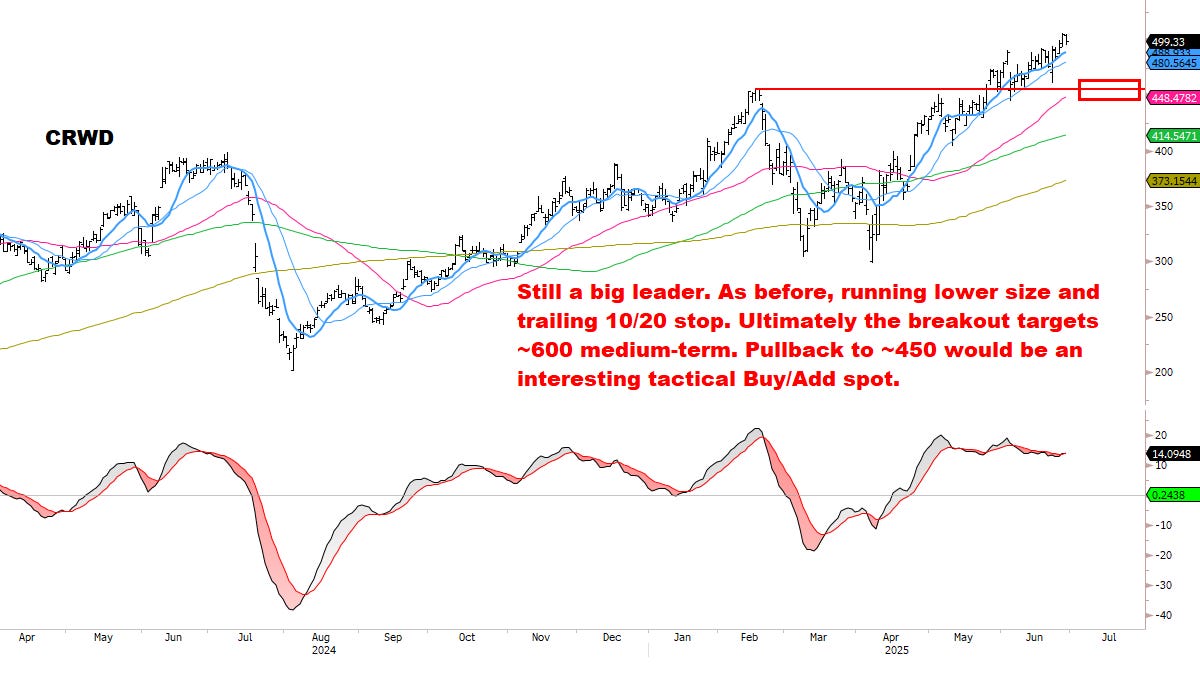
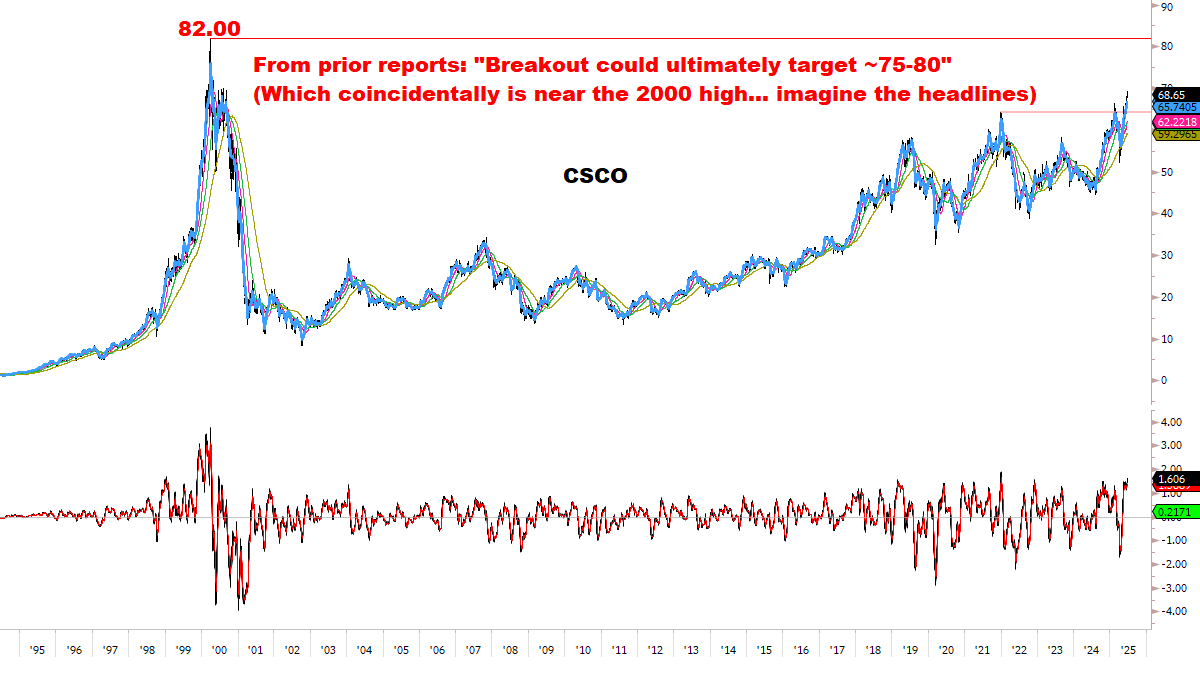
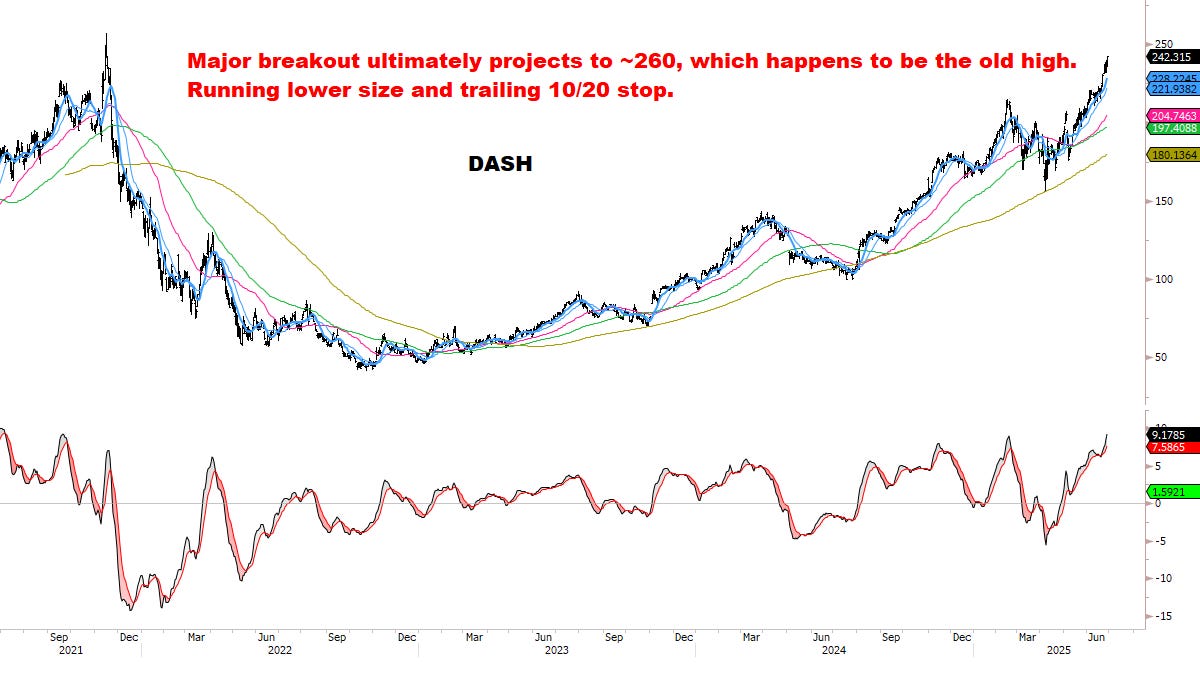
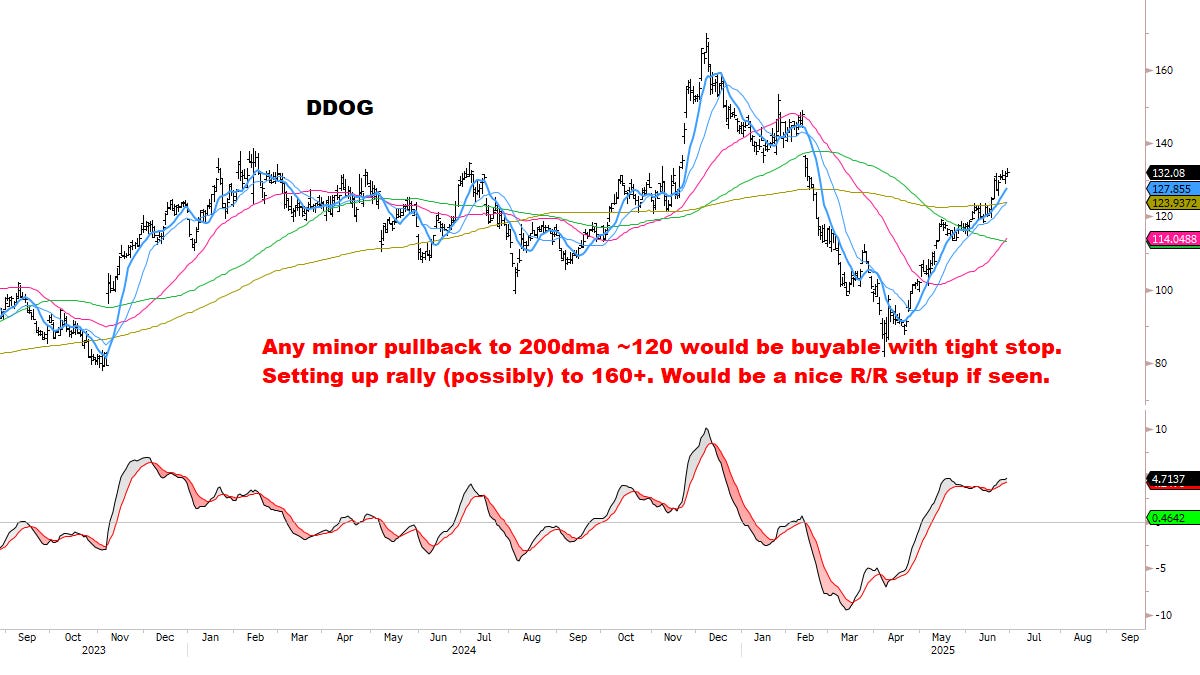
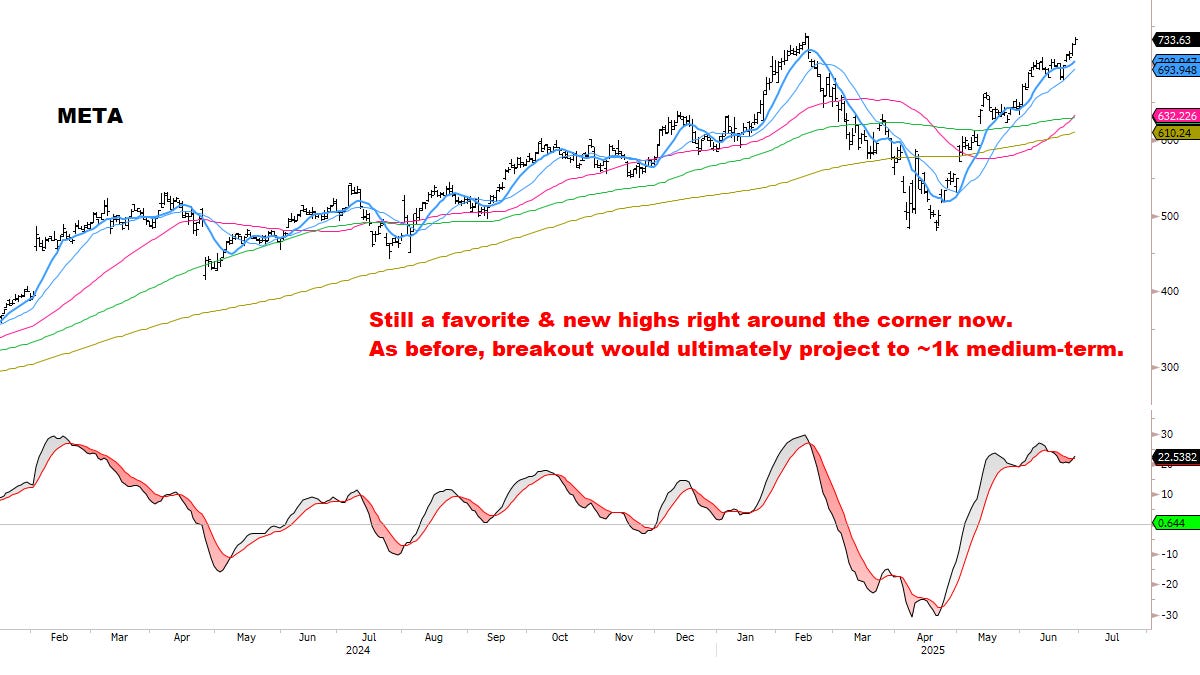
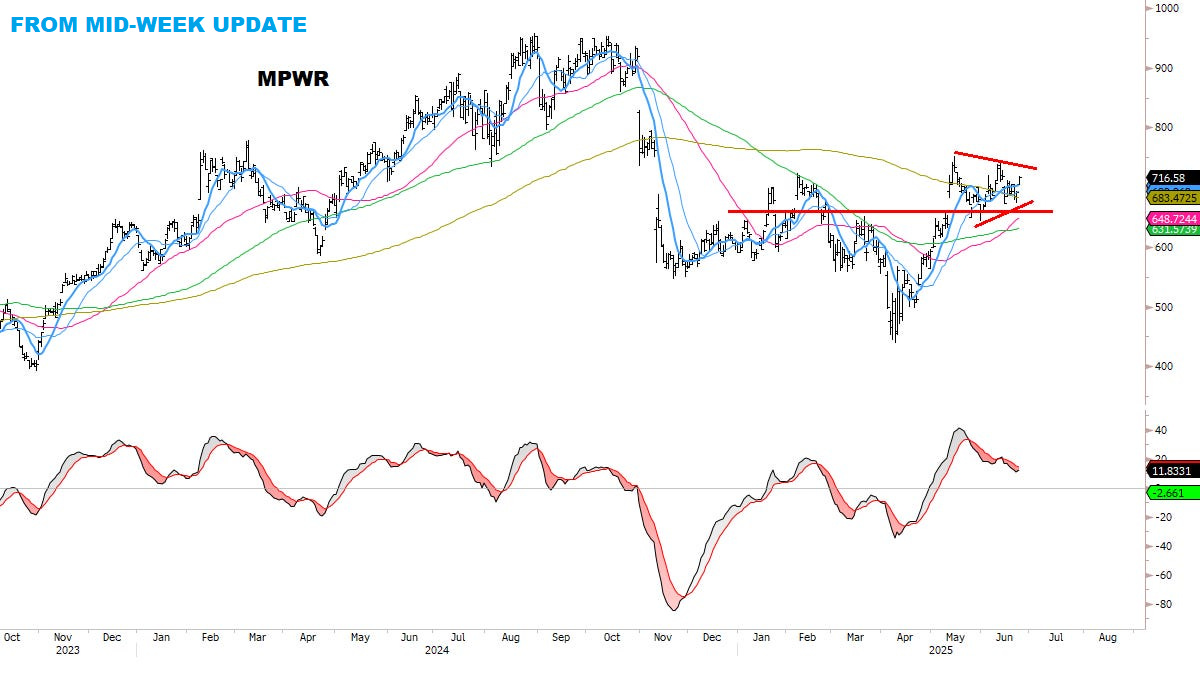
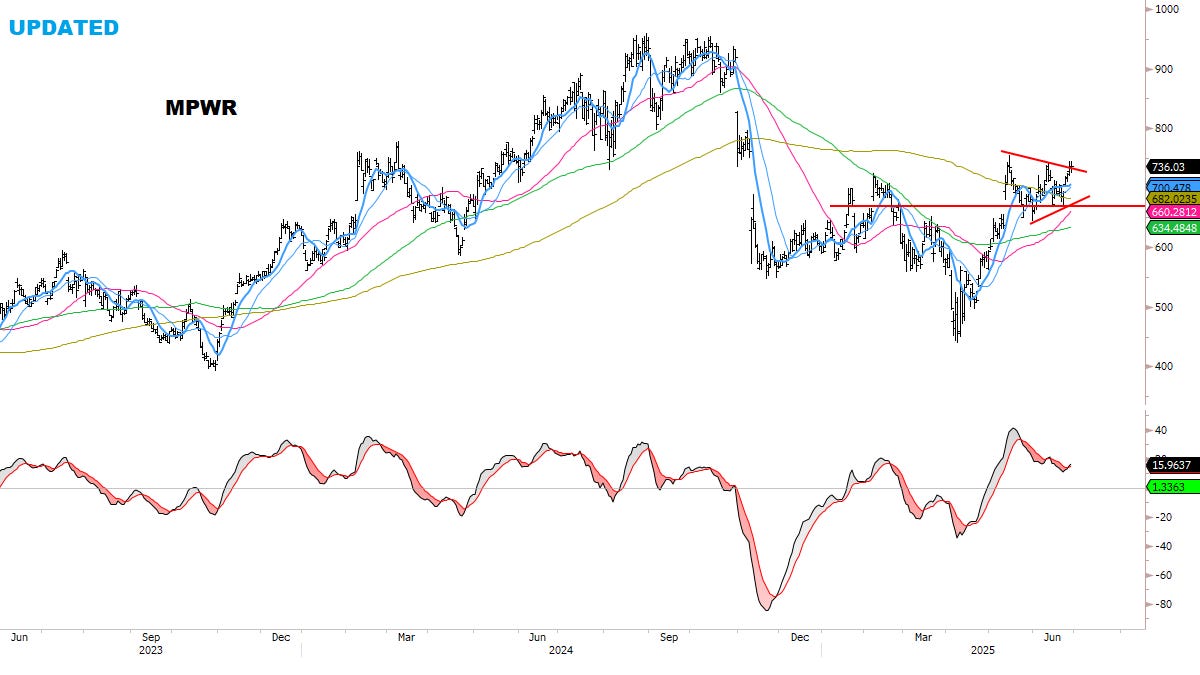
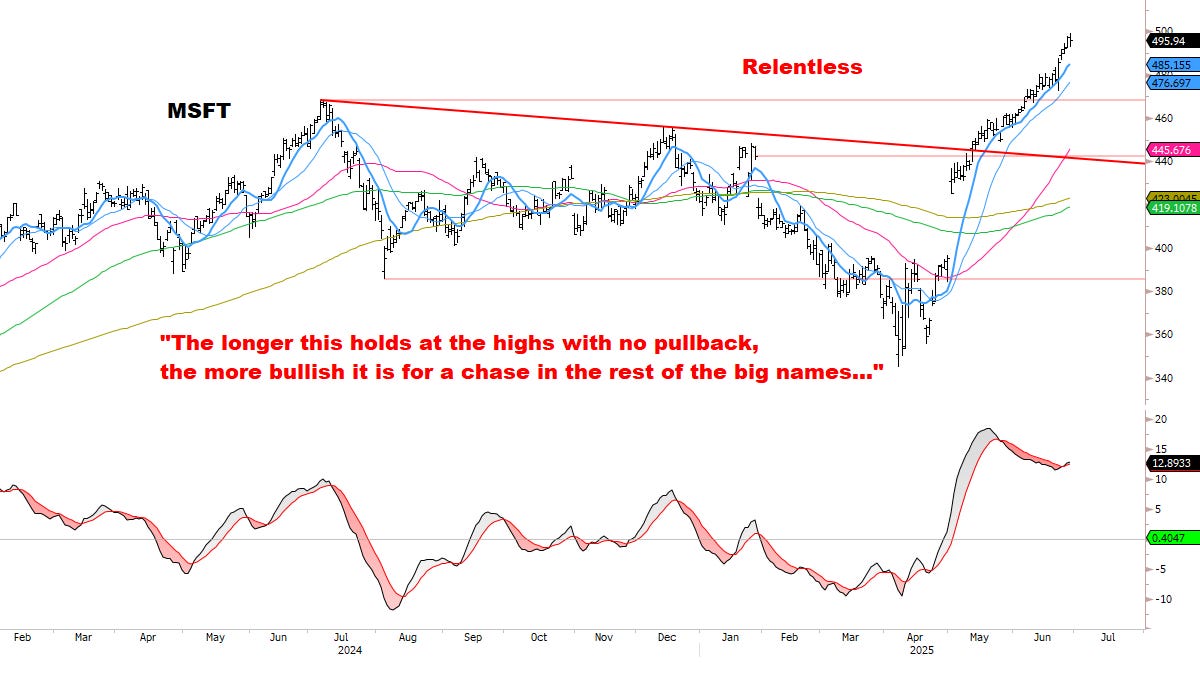
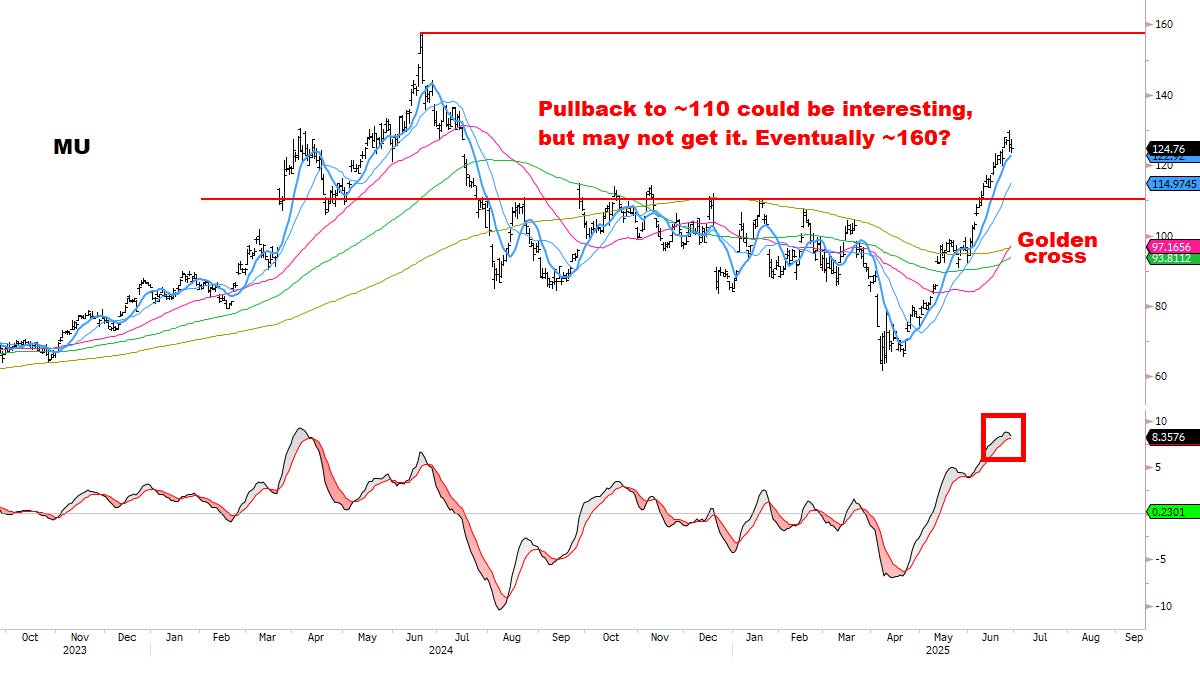
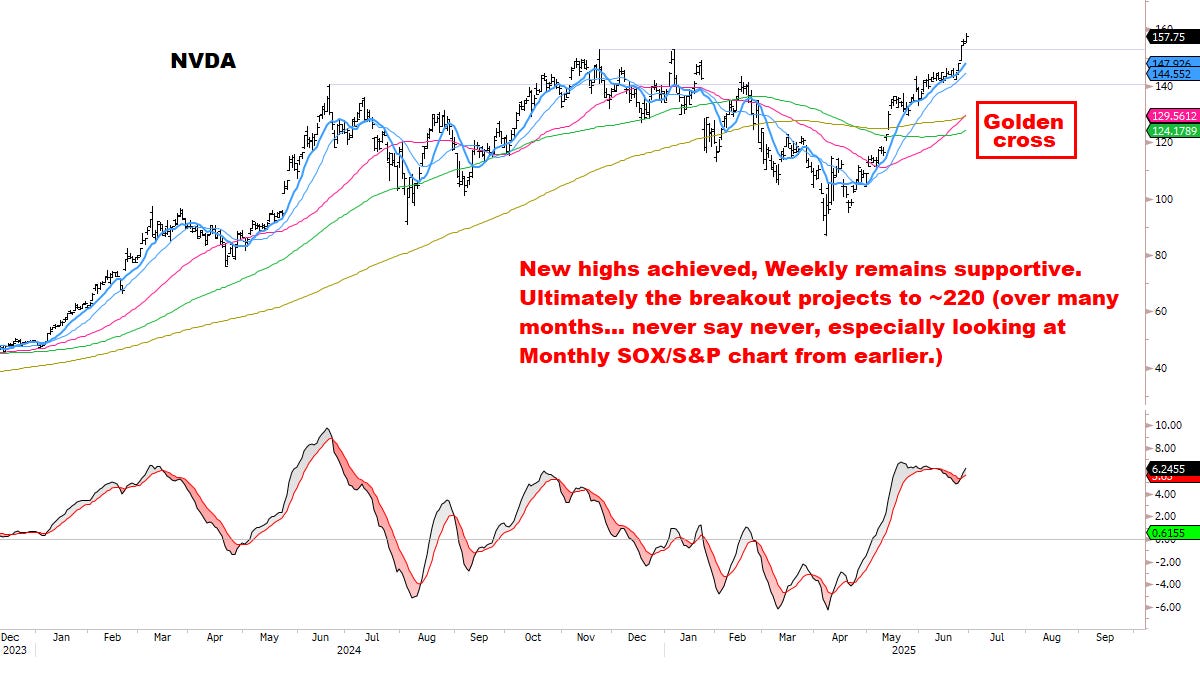
All key Sectors & Groups remain in good chart position: especially the leaders in Semis, Tech, Communication Services, and Software.
Difficult to build a top while these leading areas continue to carry the market AND are moving in synch.
Uptrends remain intact, with no bearish reversals in any major Index.
VIX and Credit Spreads continue trending DOWN.
Max pain scenario remains: low-volatility summer grind to new highs.
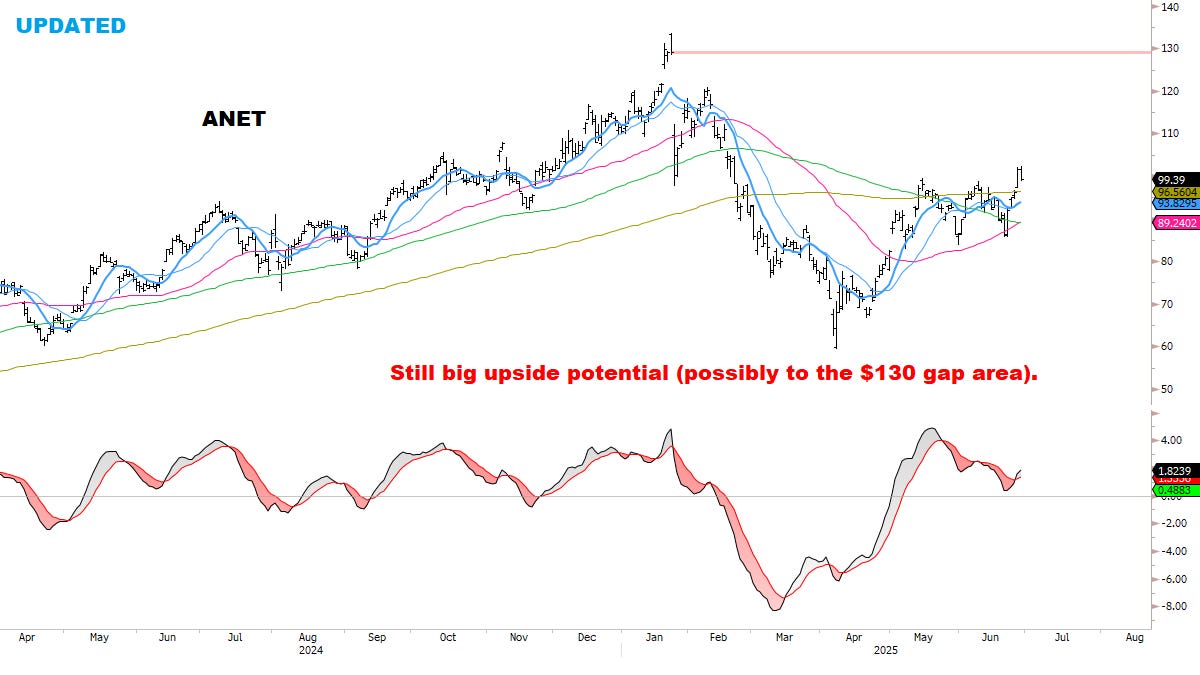
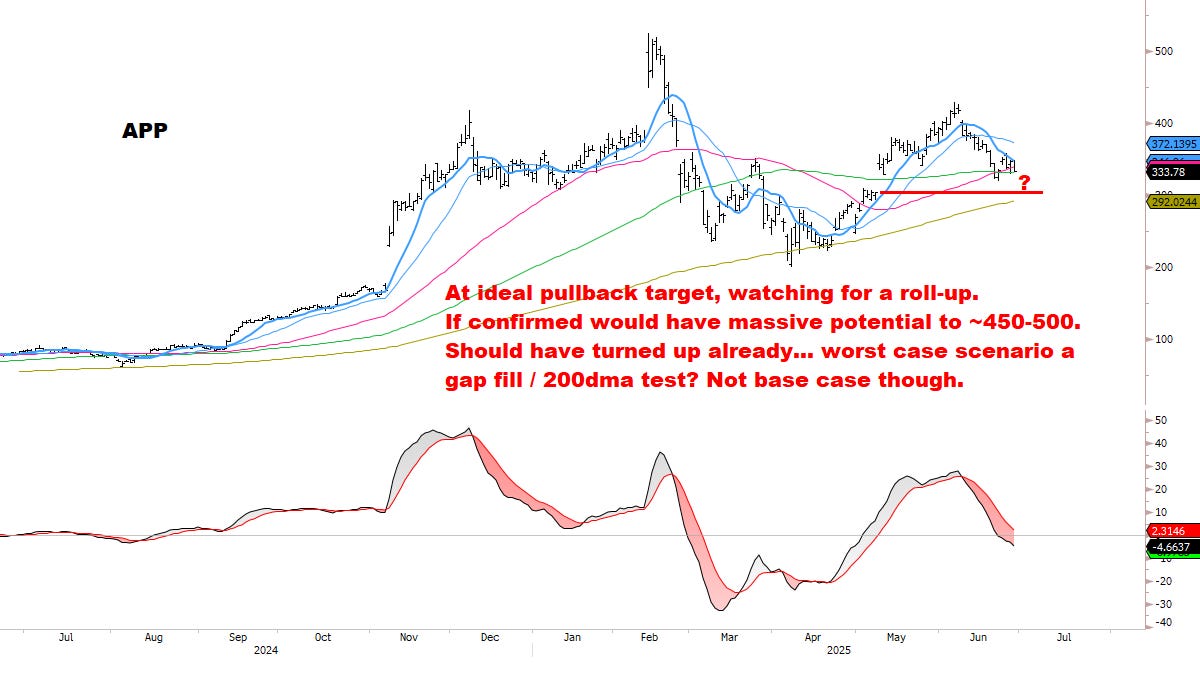
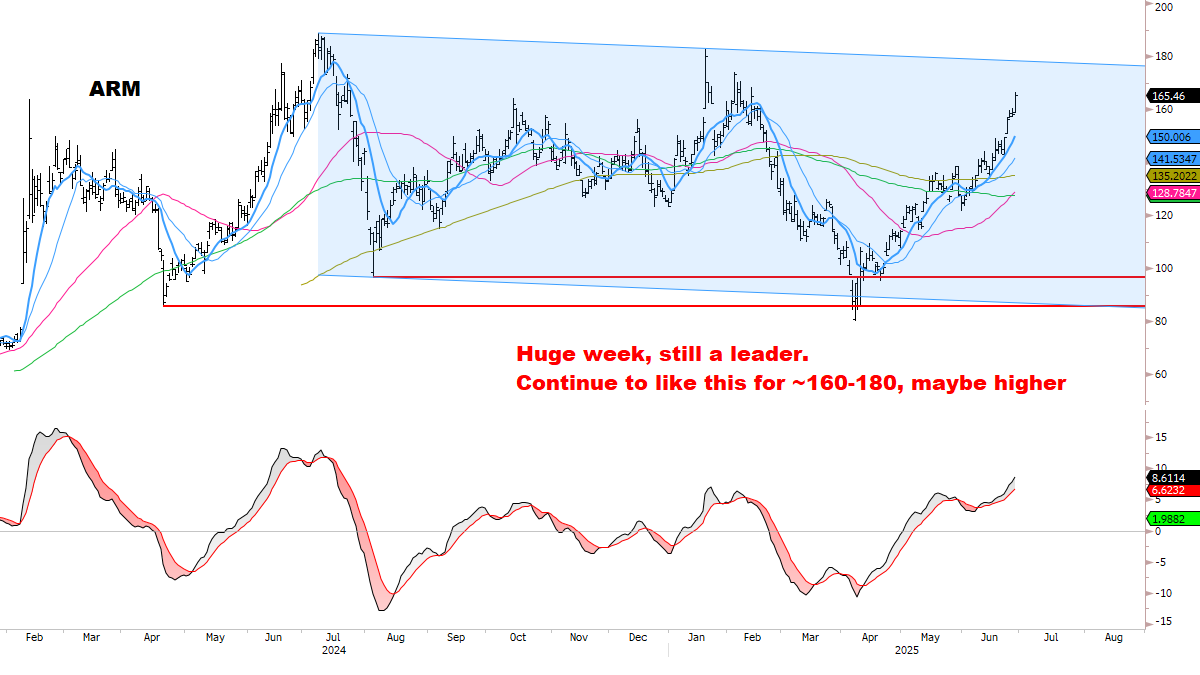
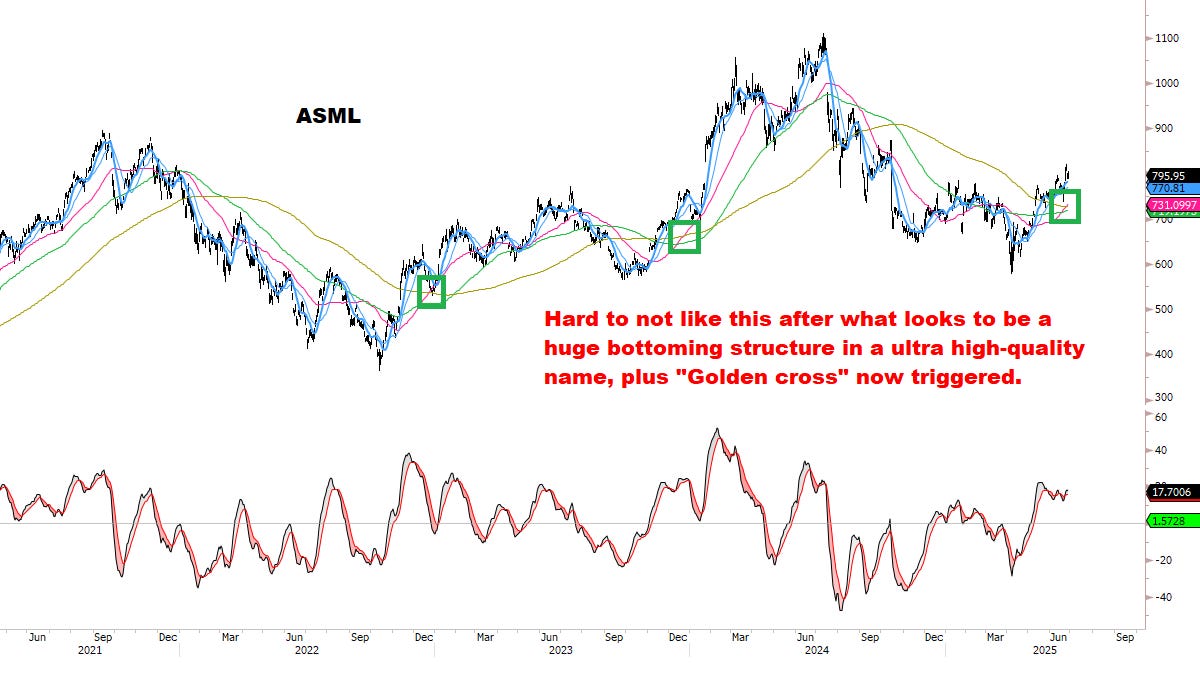
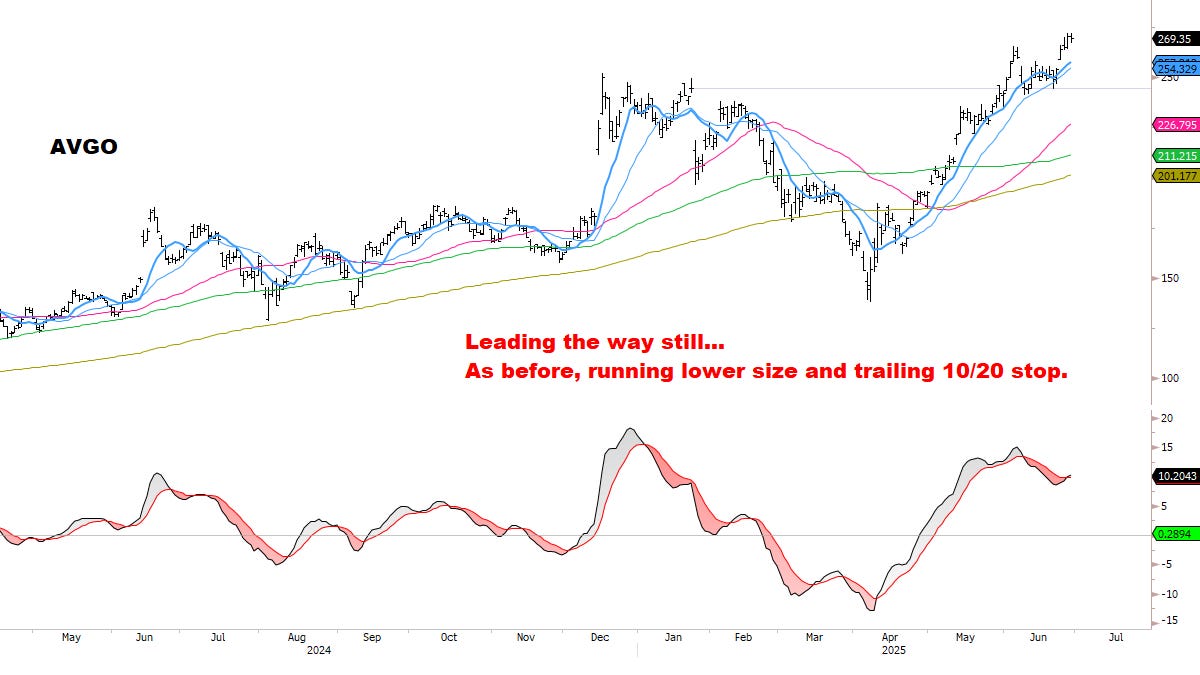
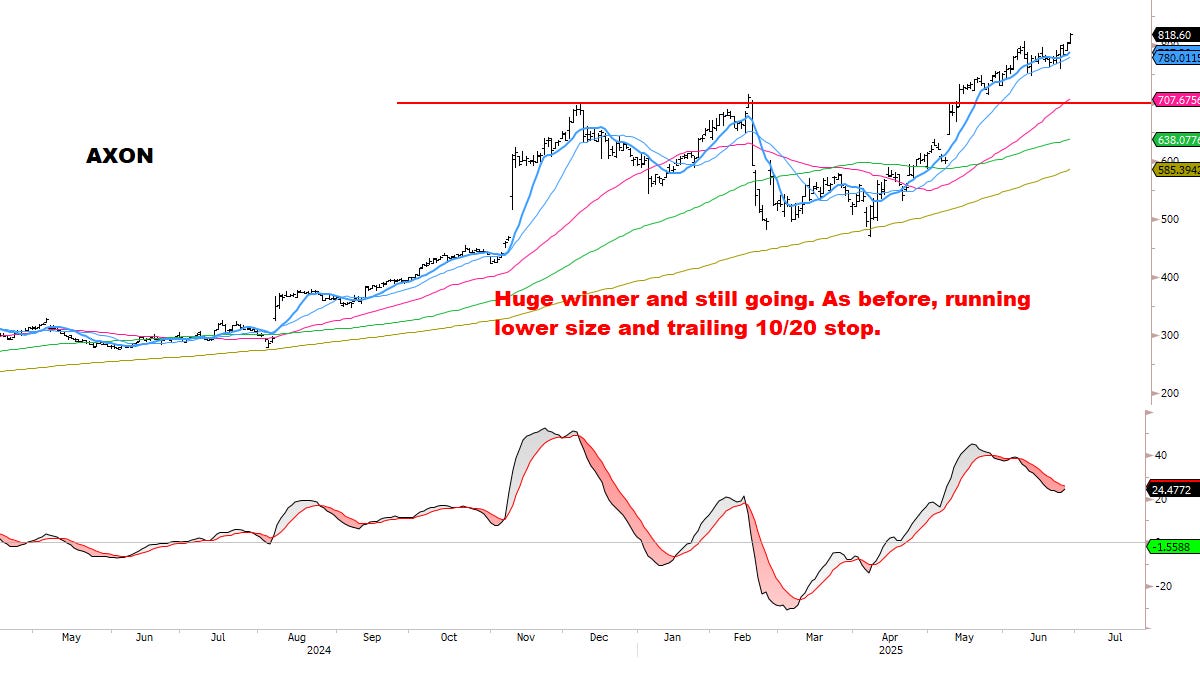
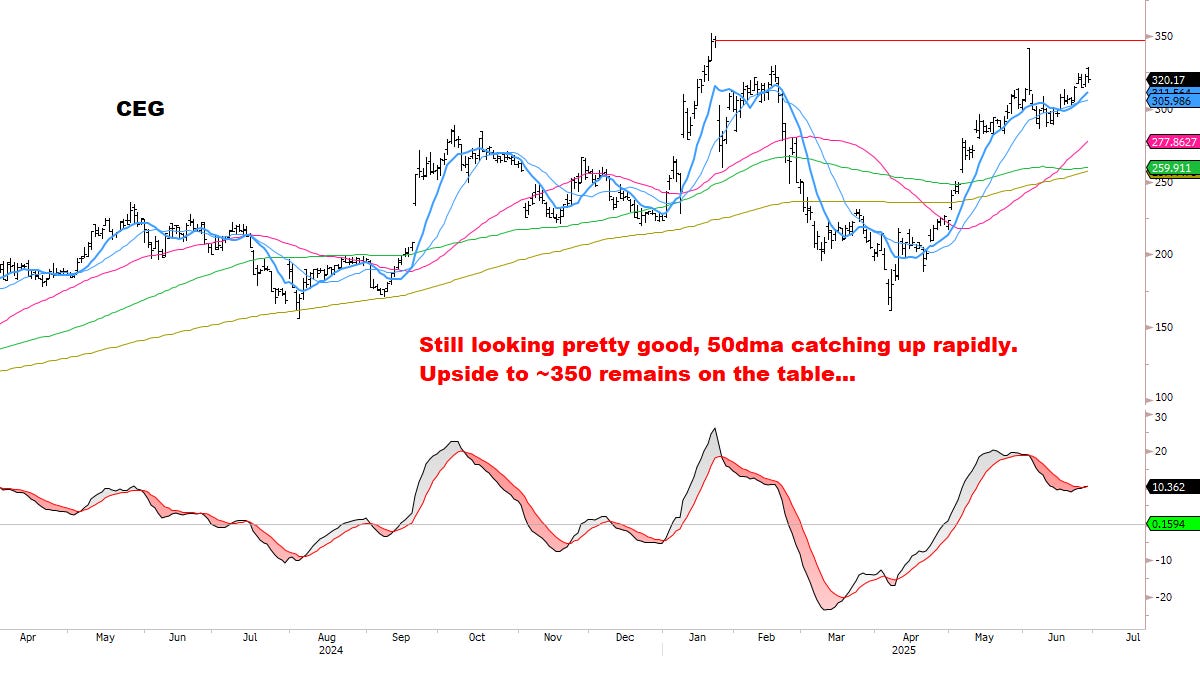
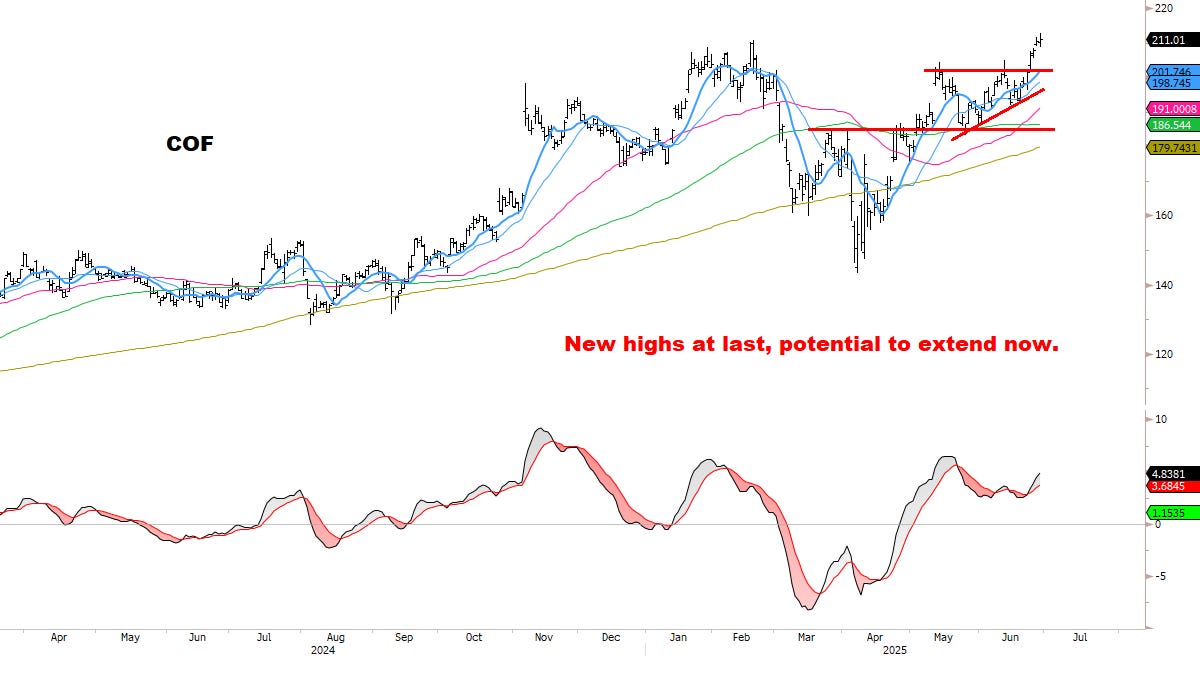
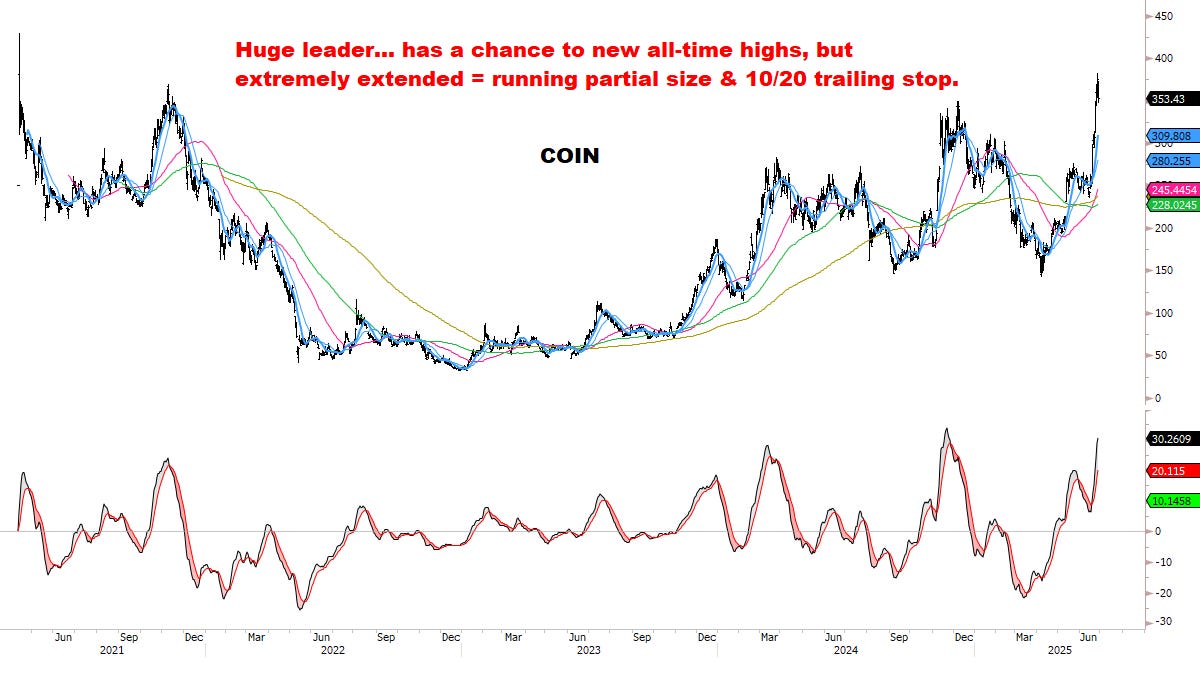
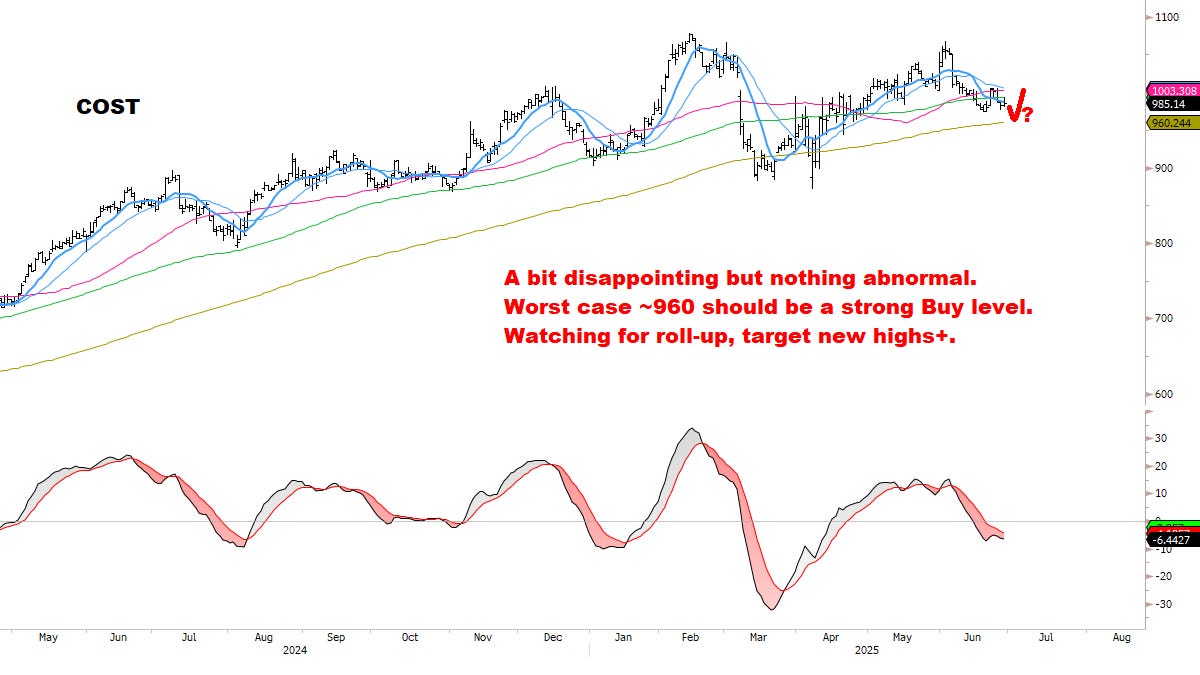
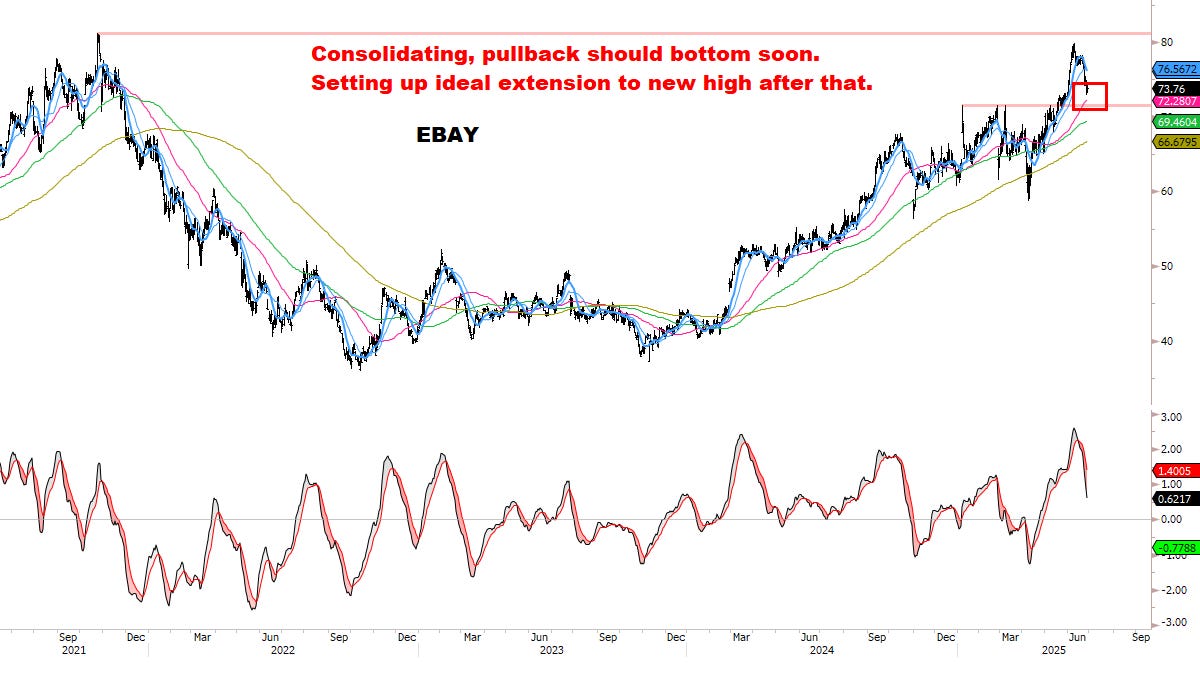
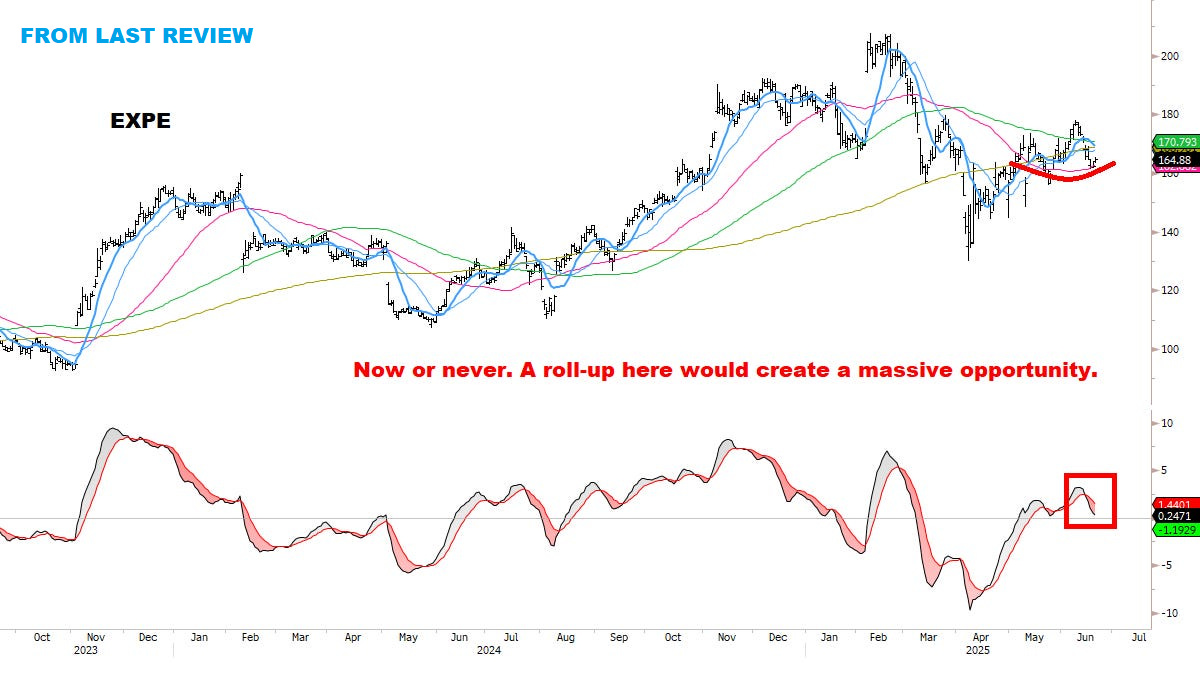
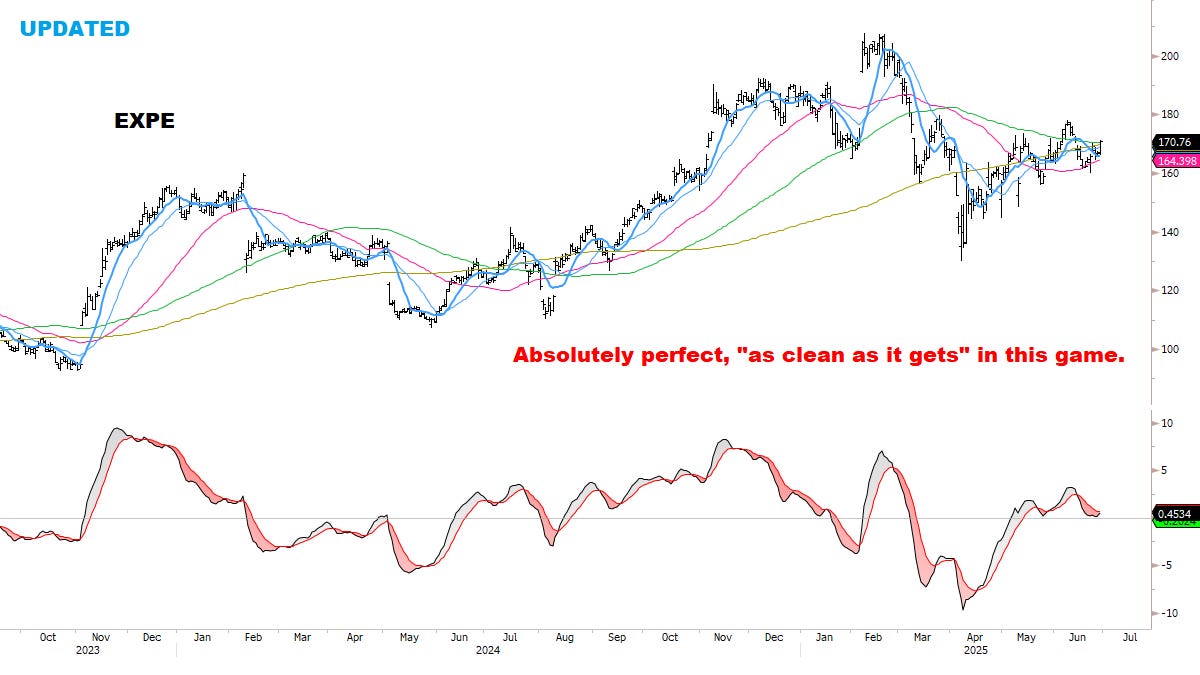
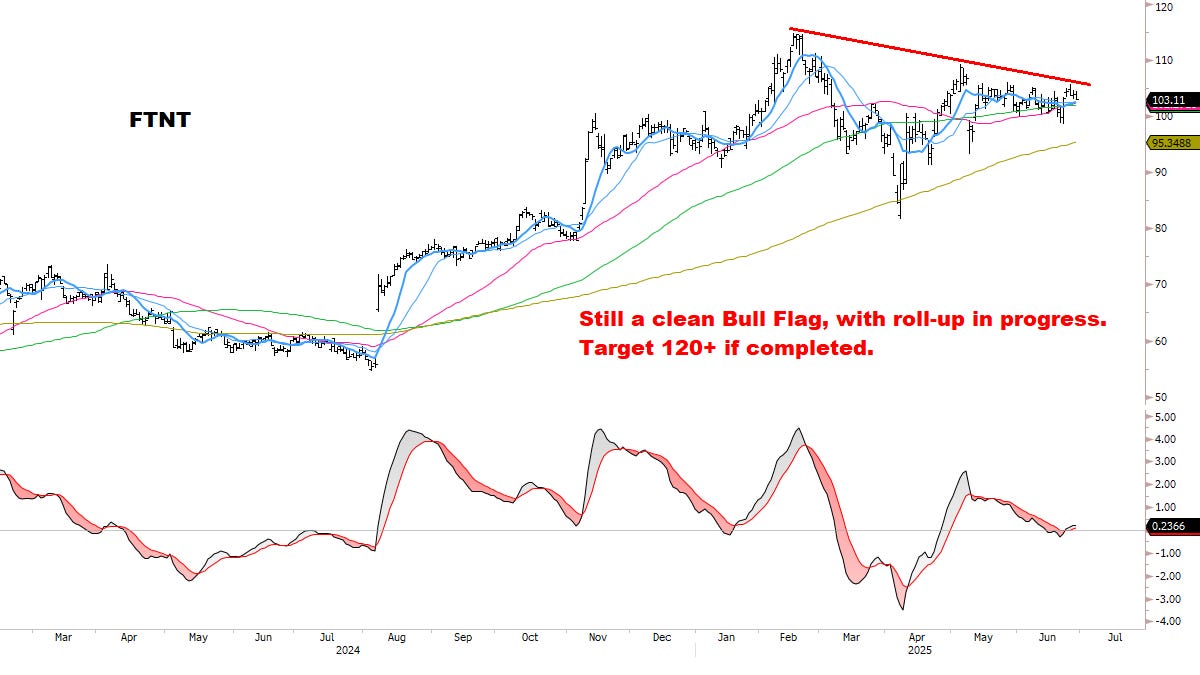
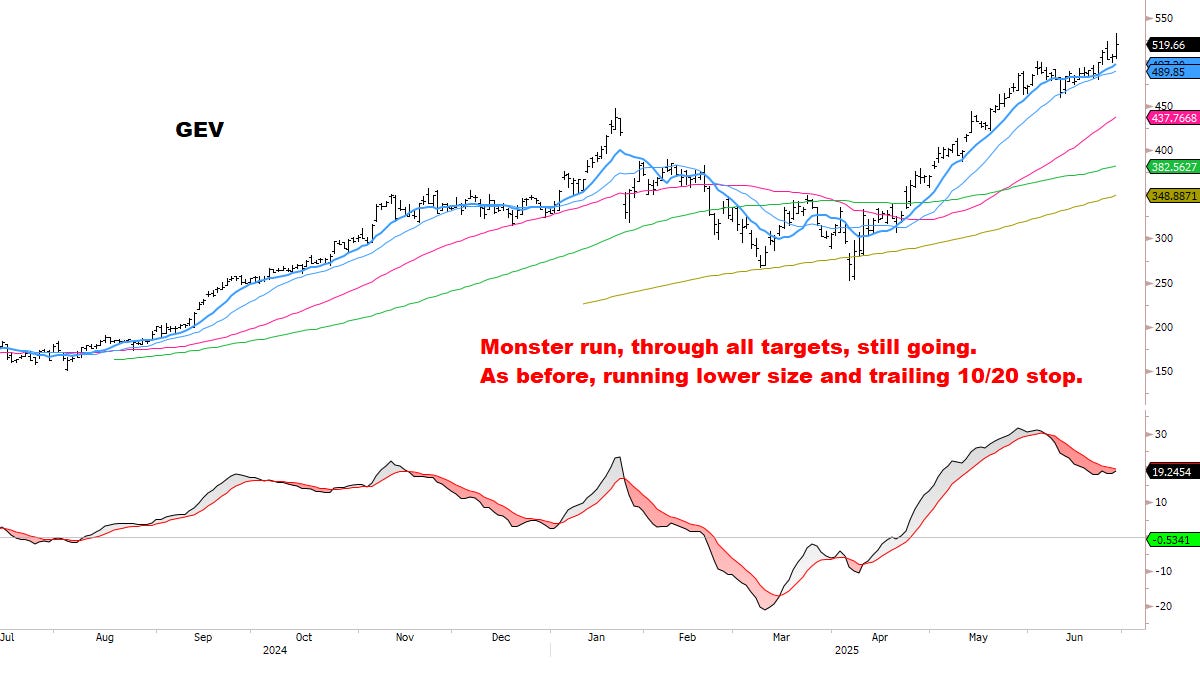
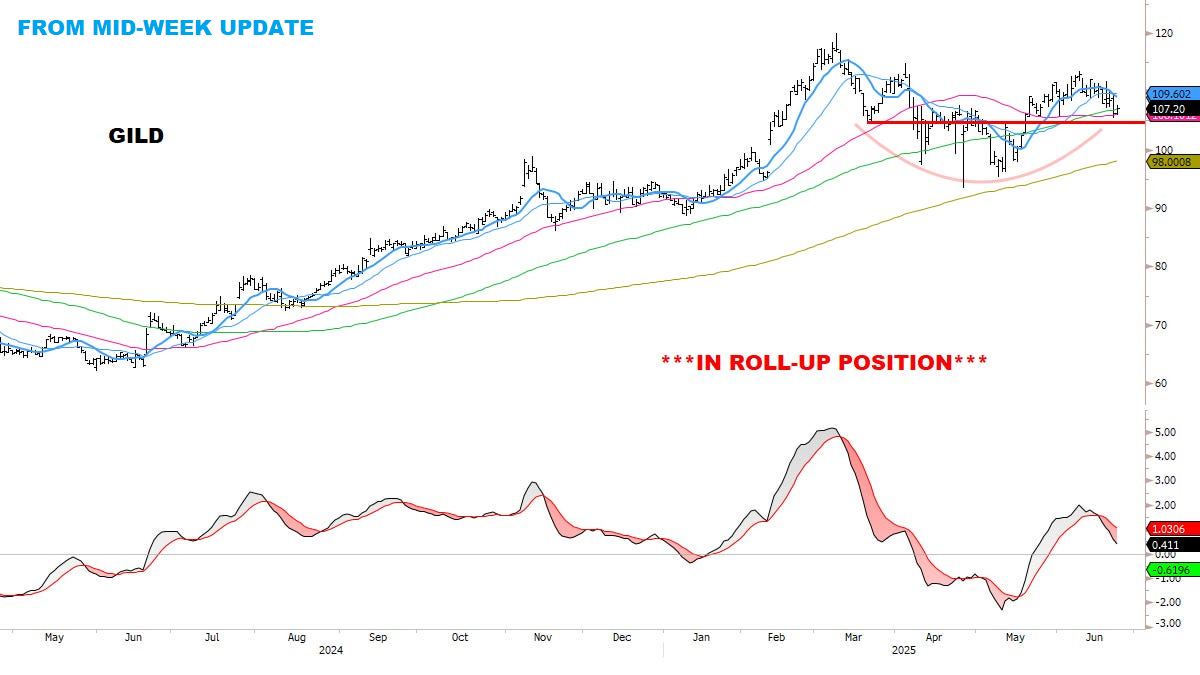
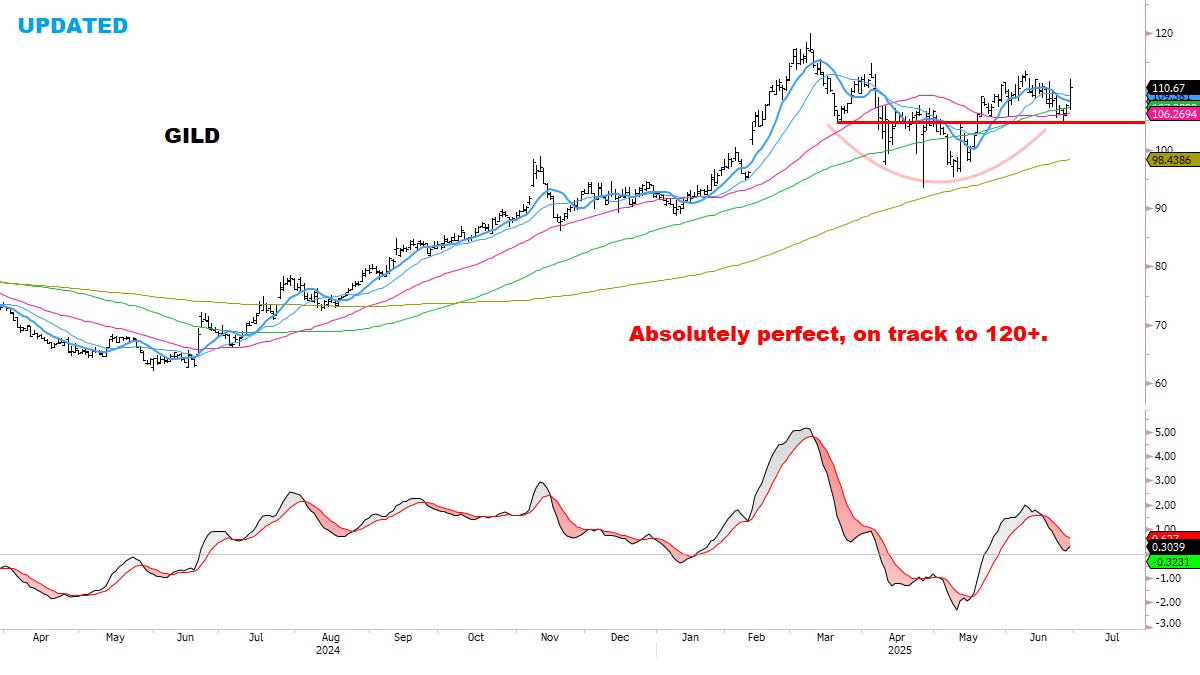
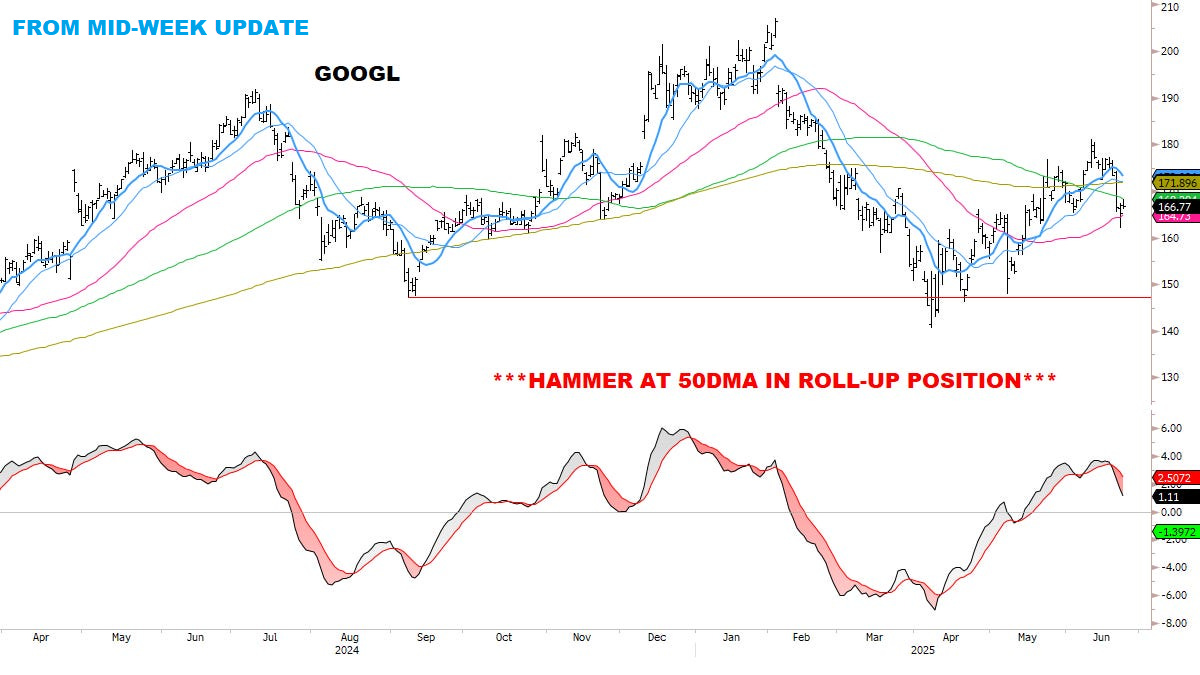
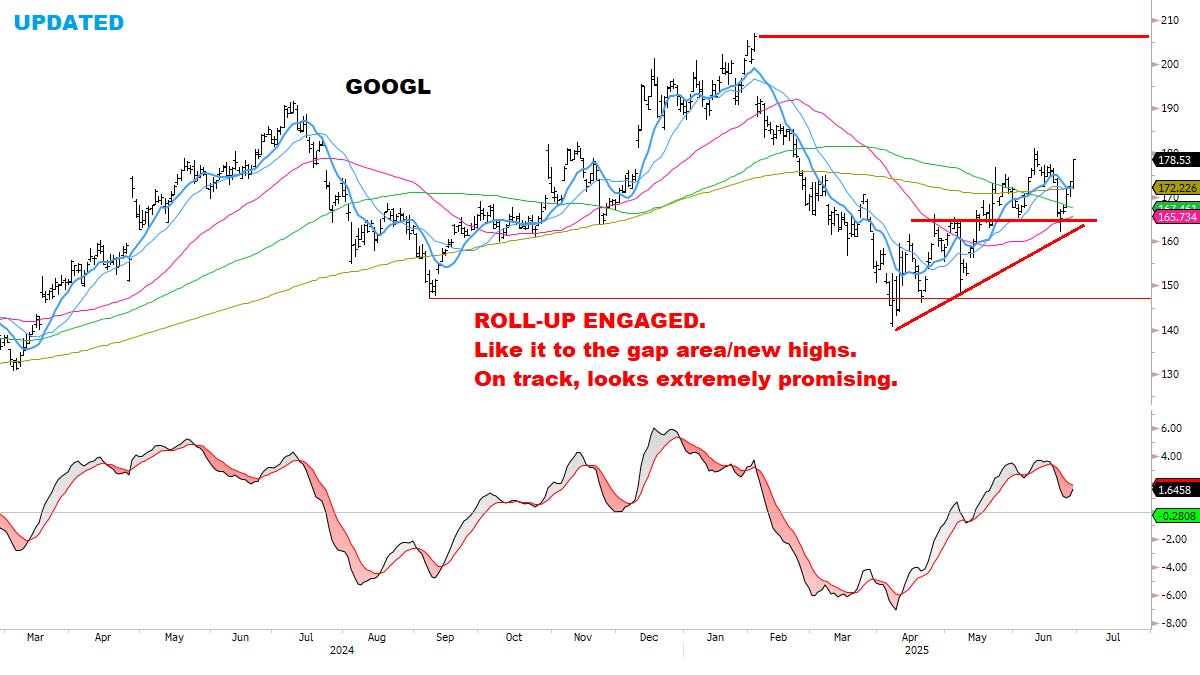
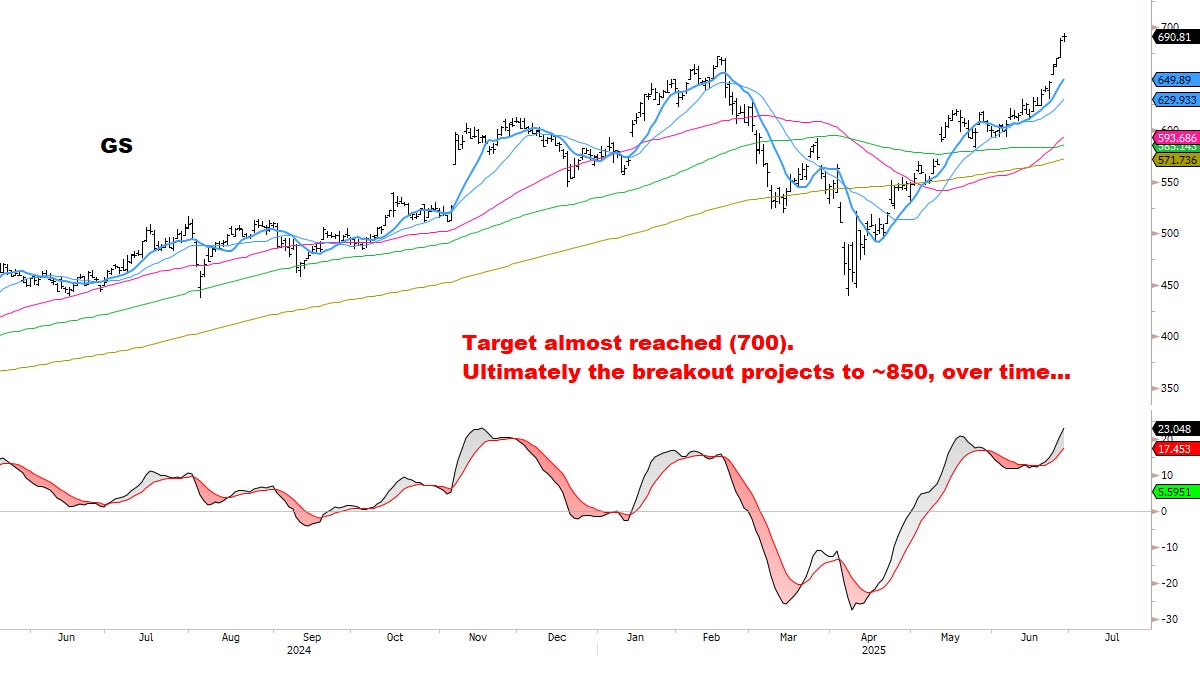
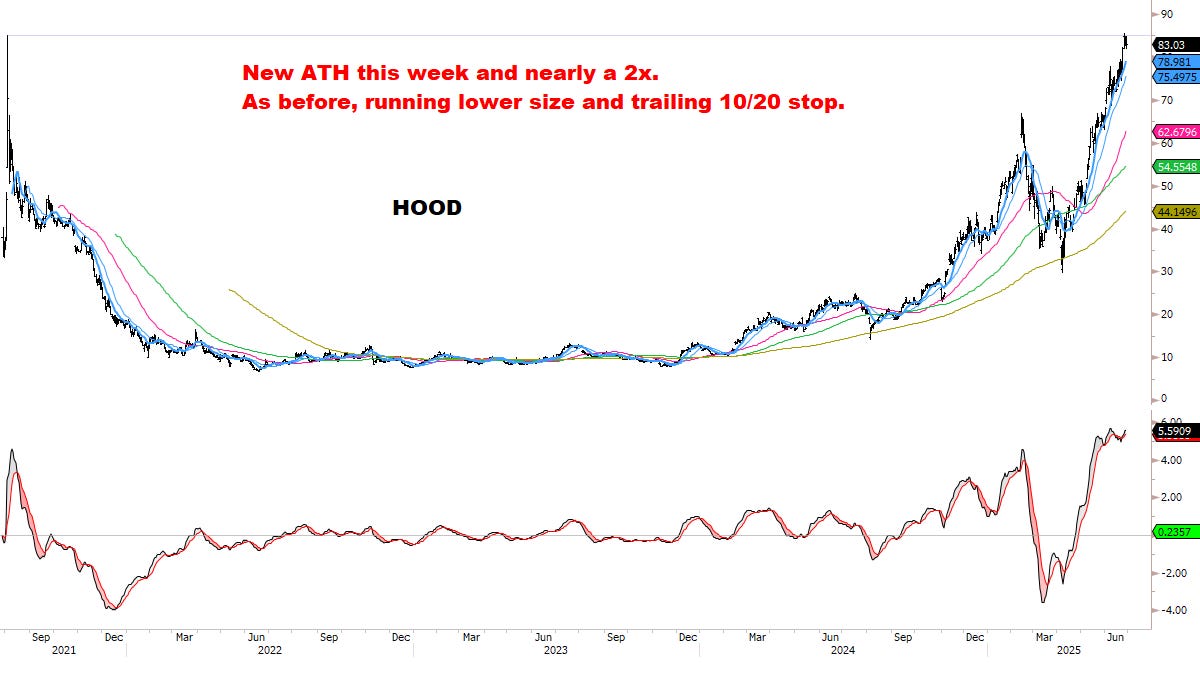
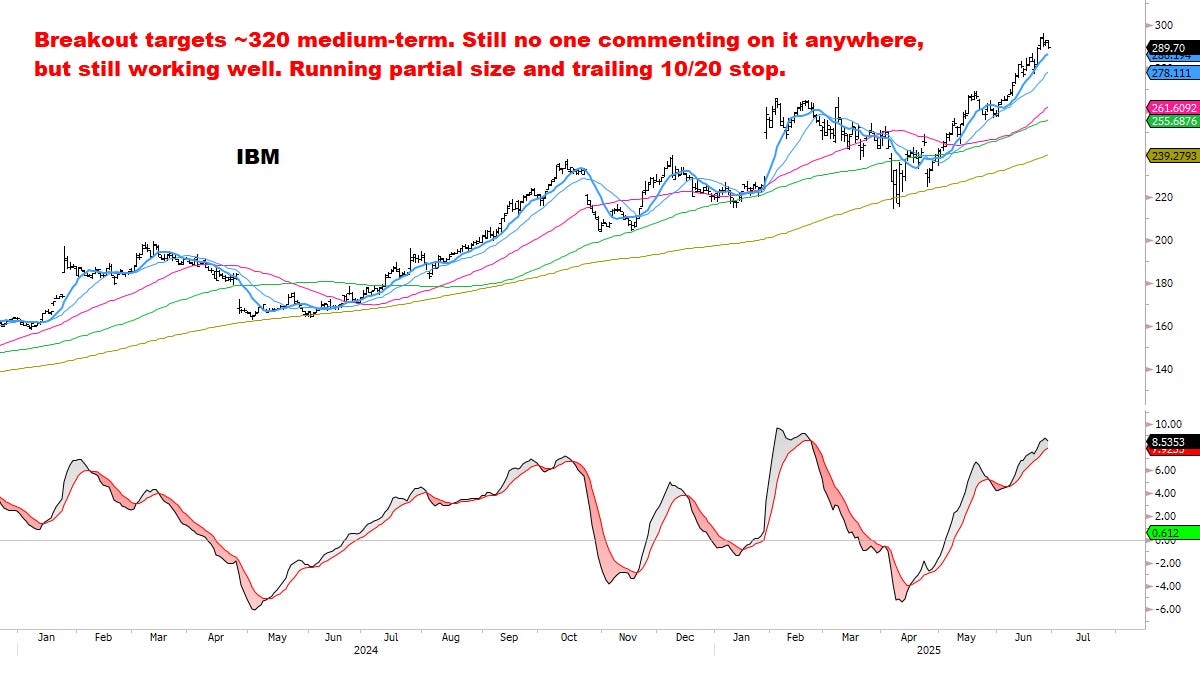
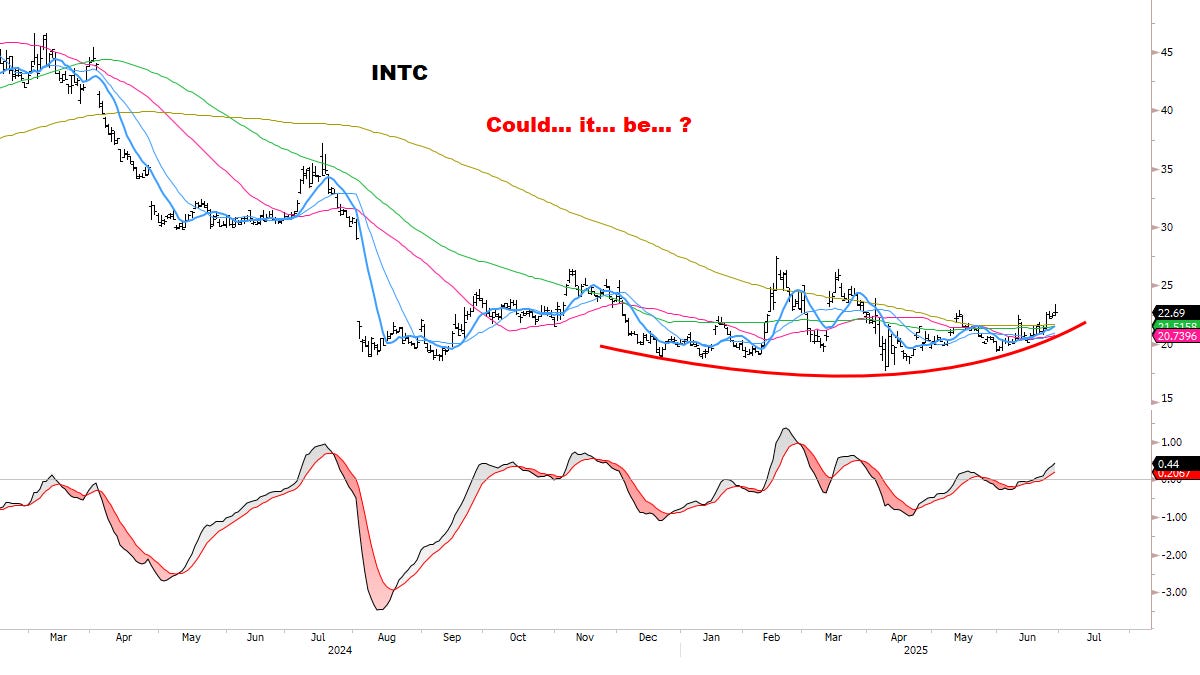
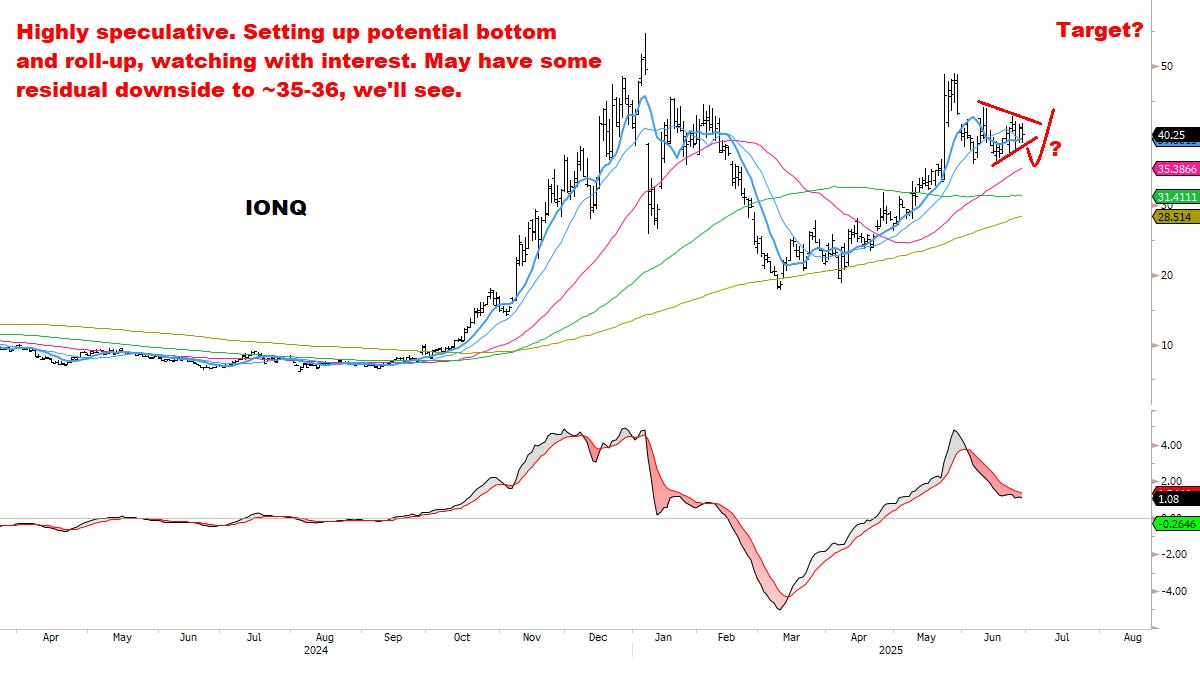
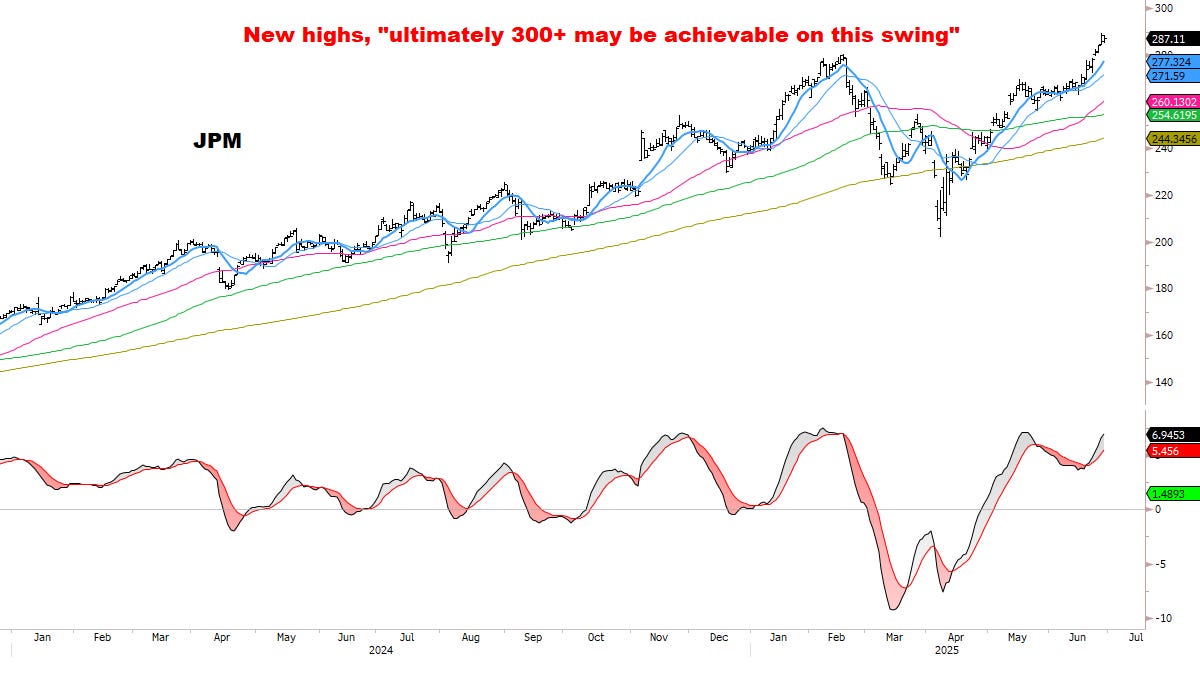
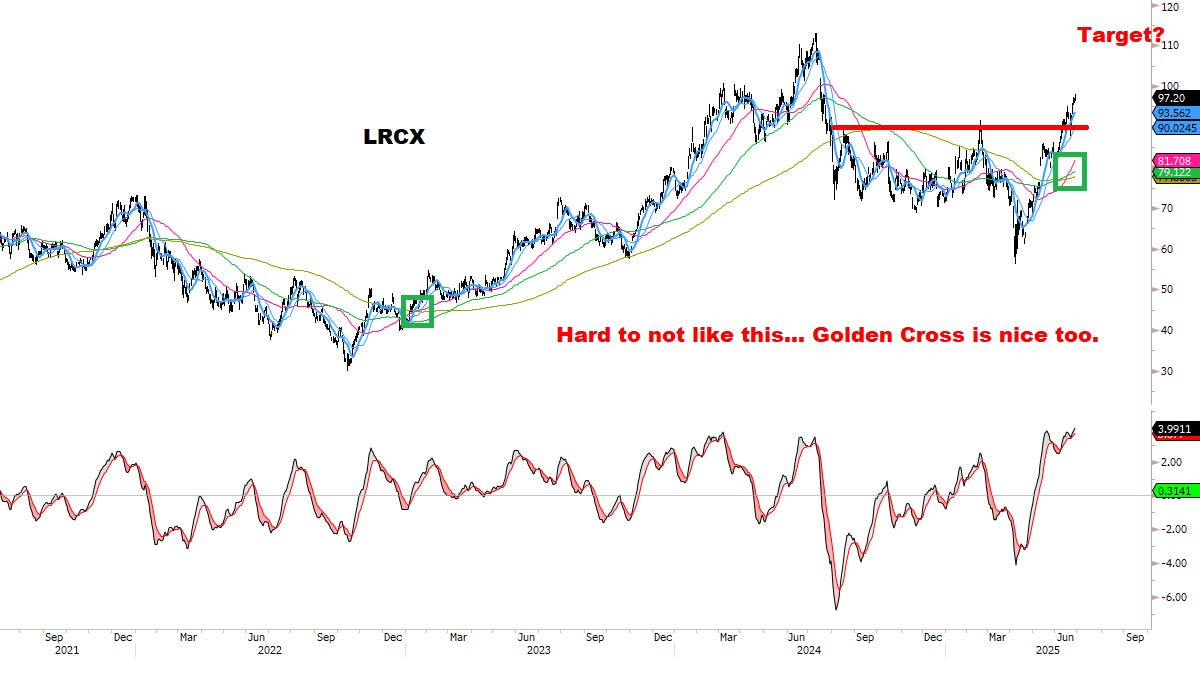
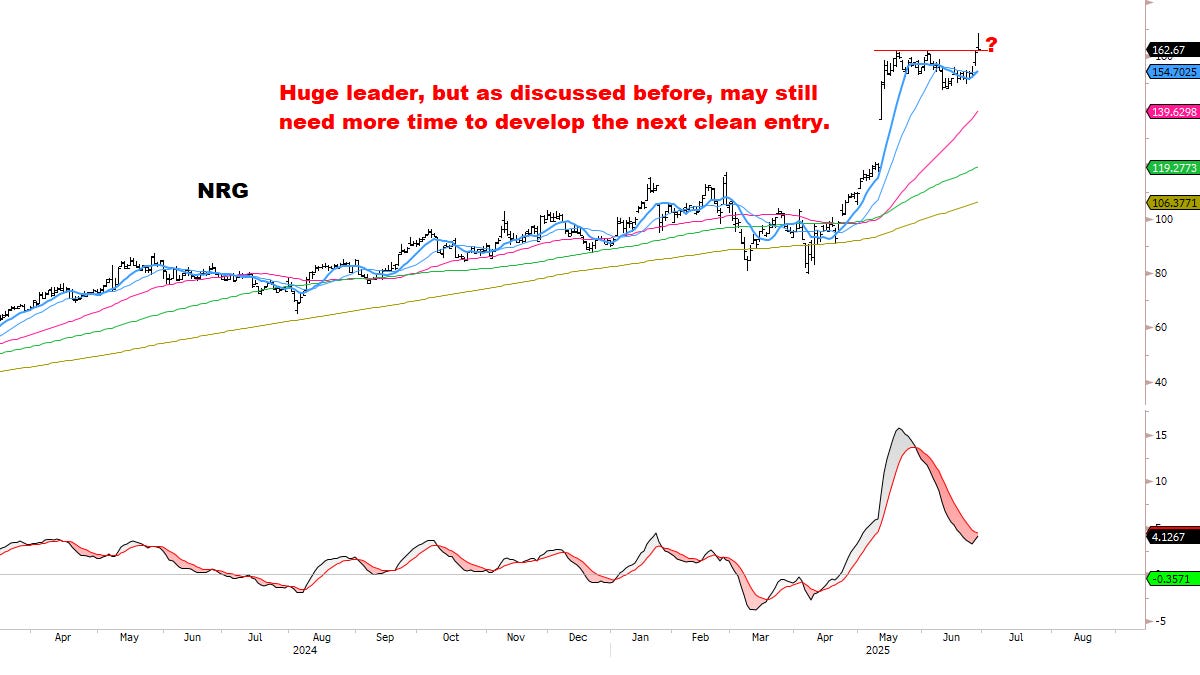
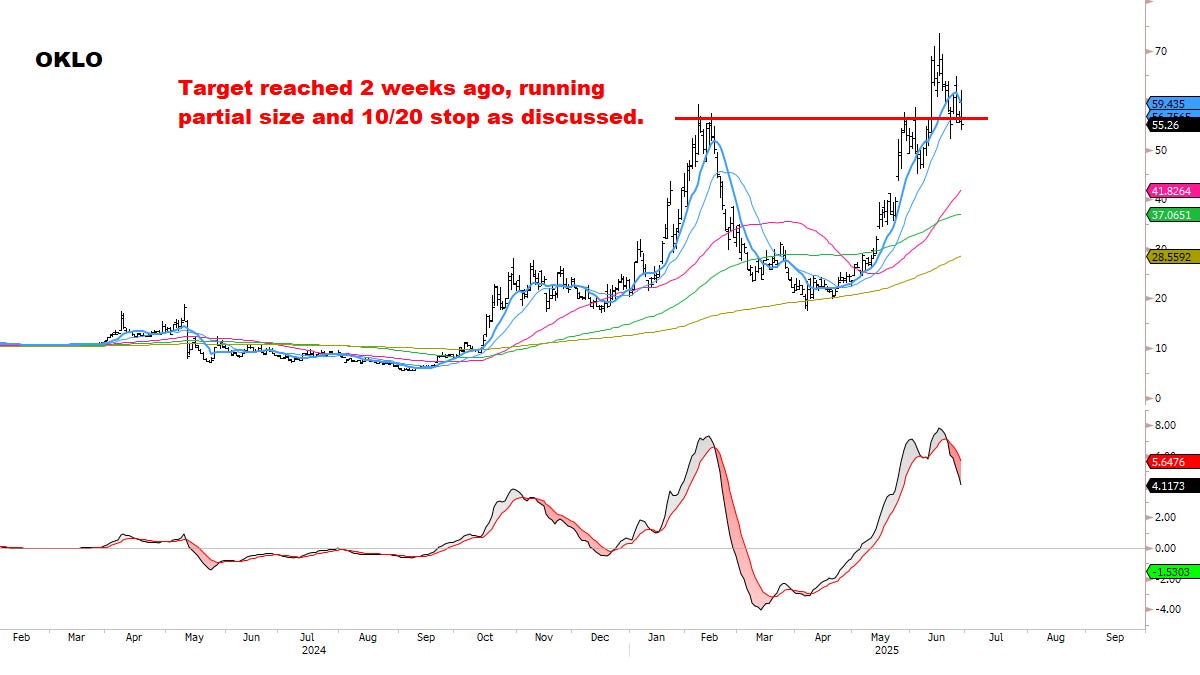
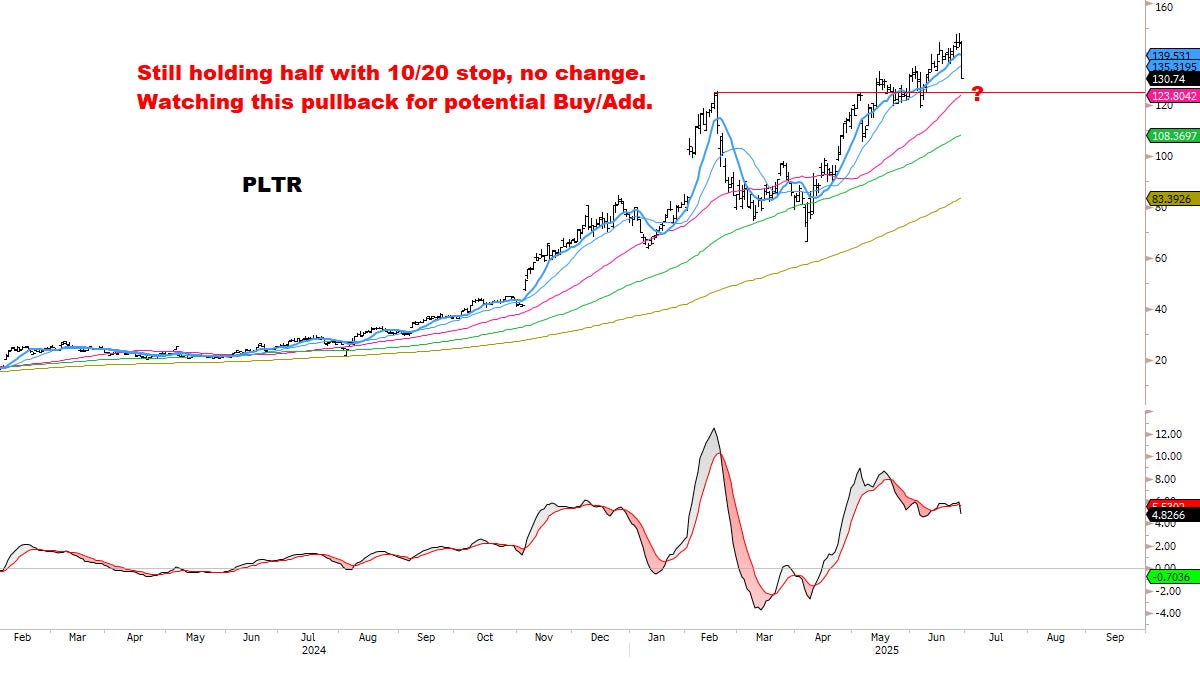
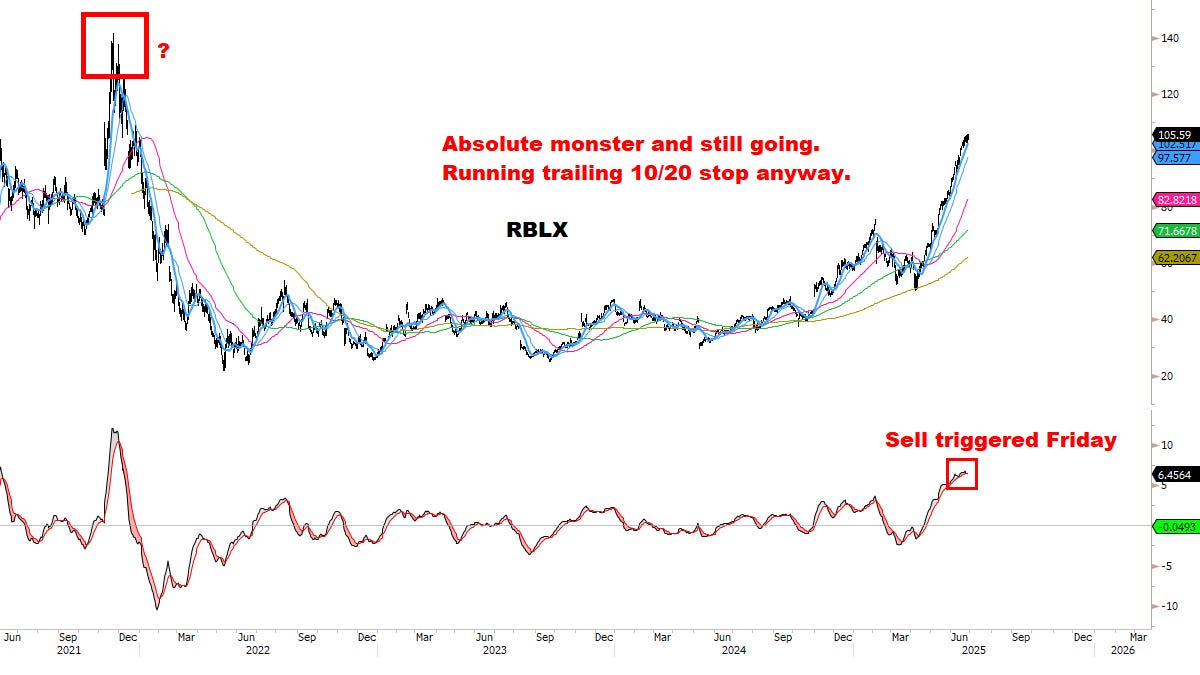
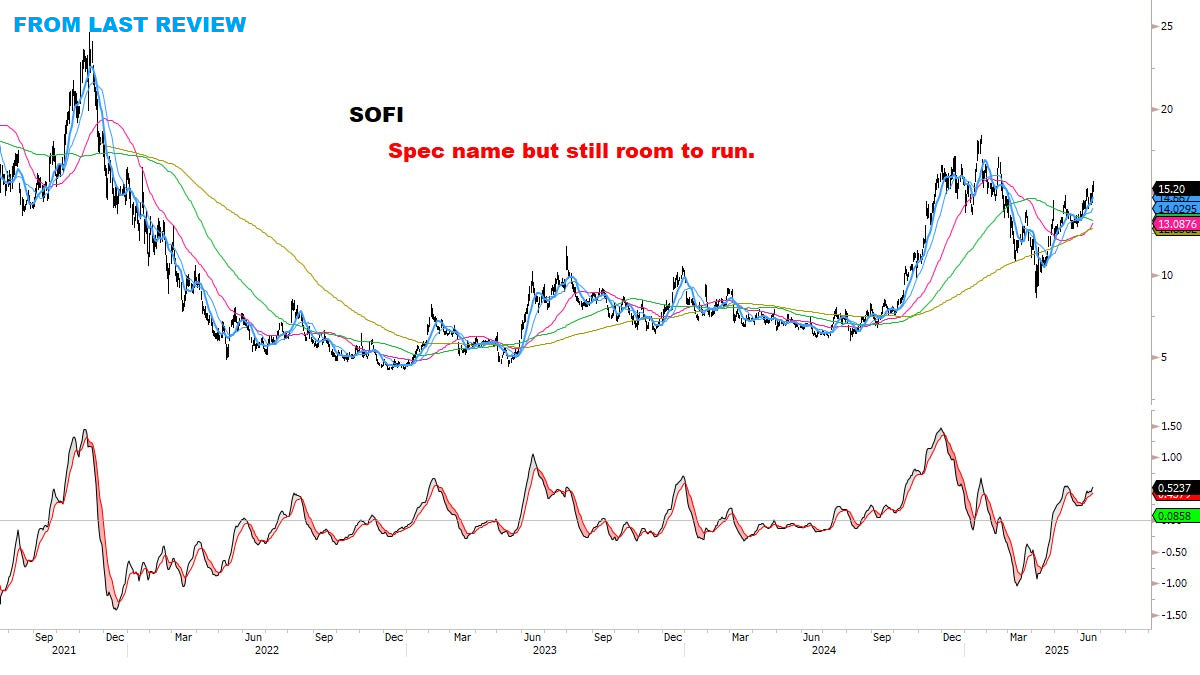
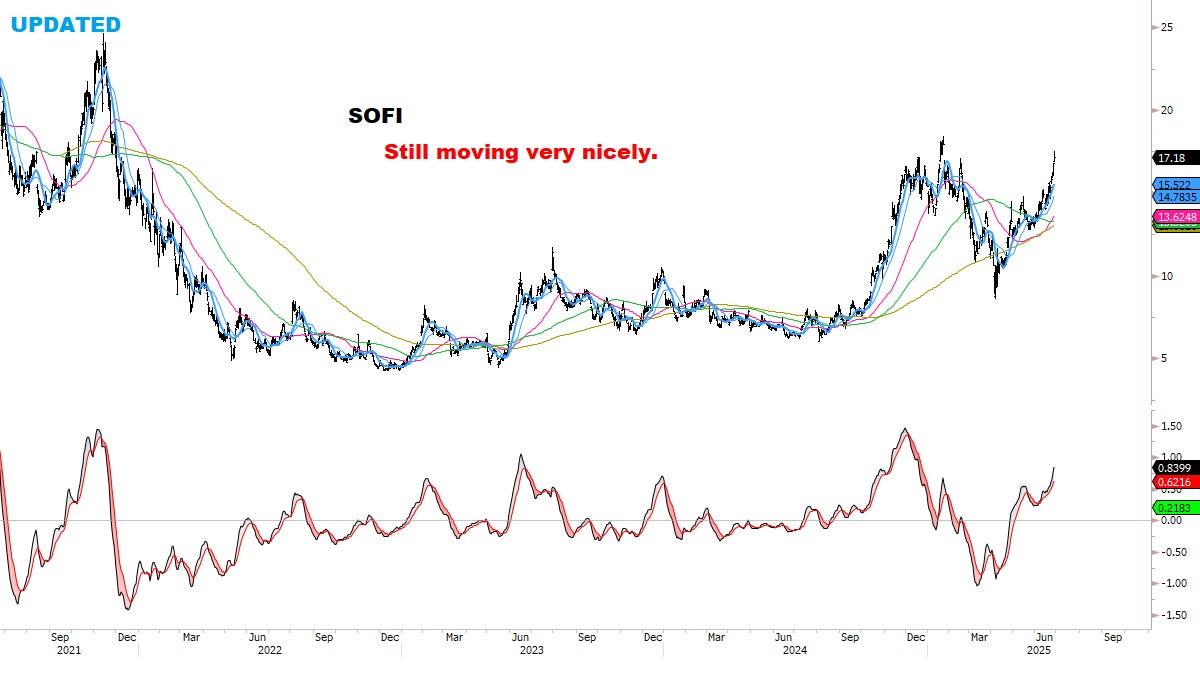
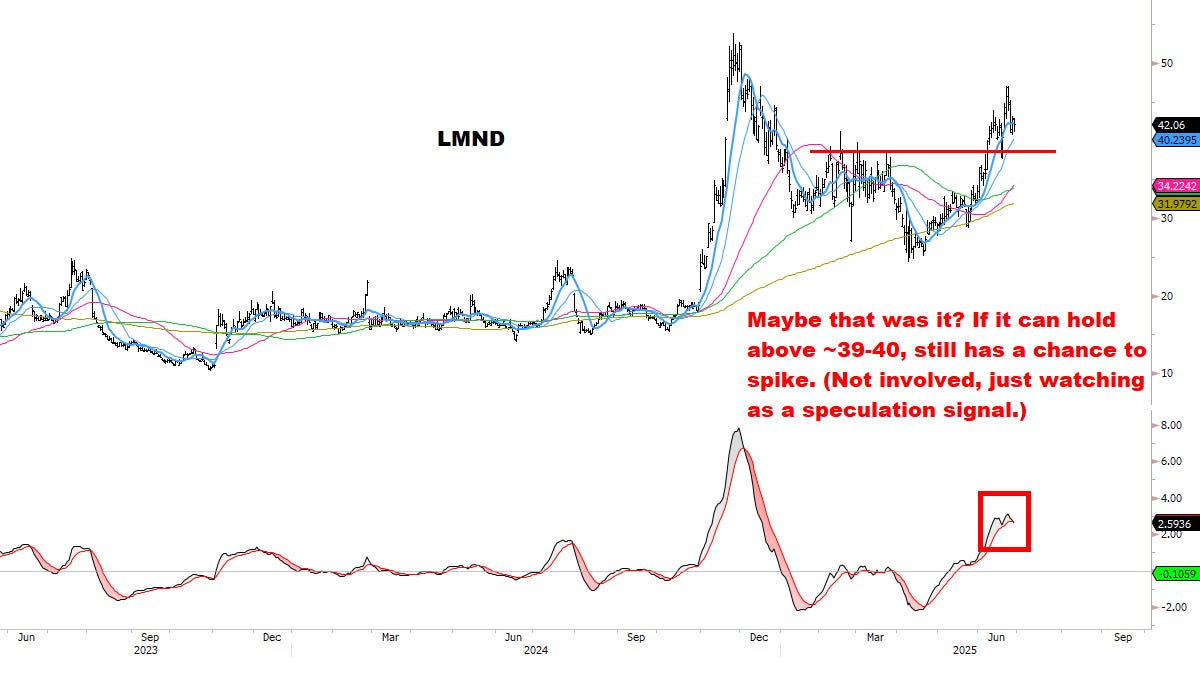
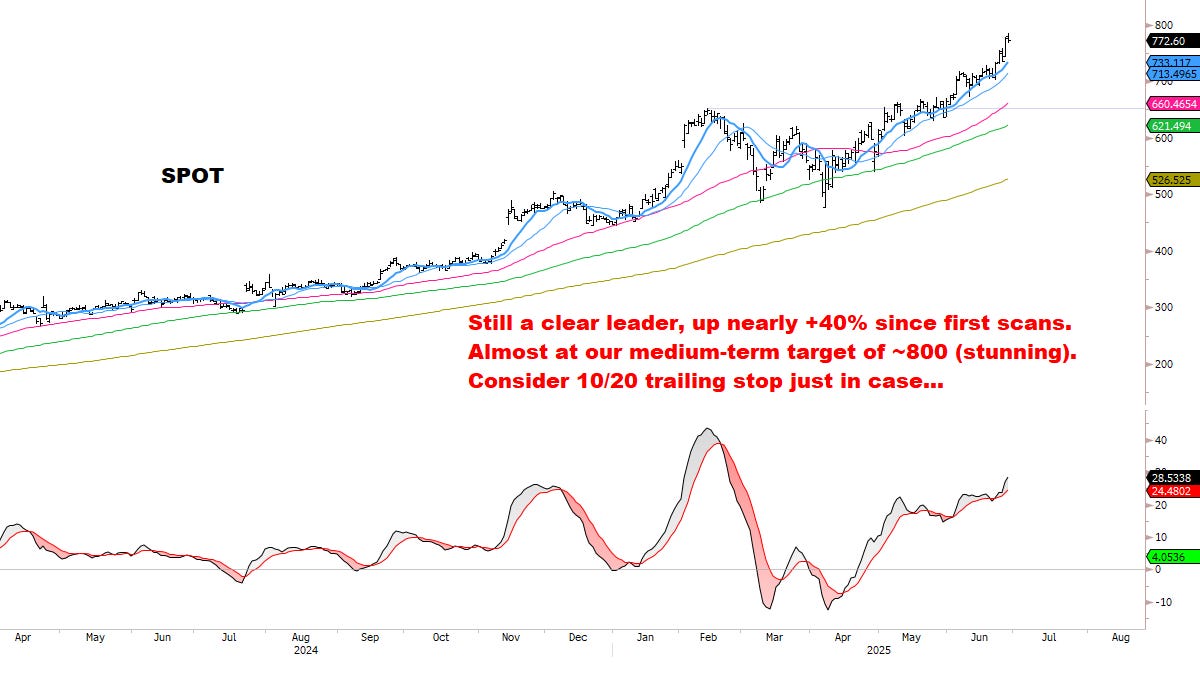
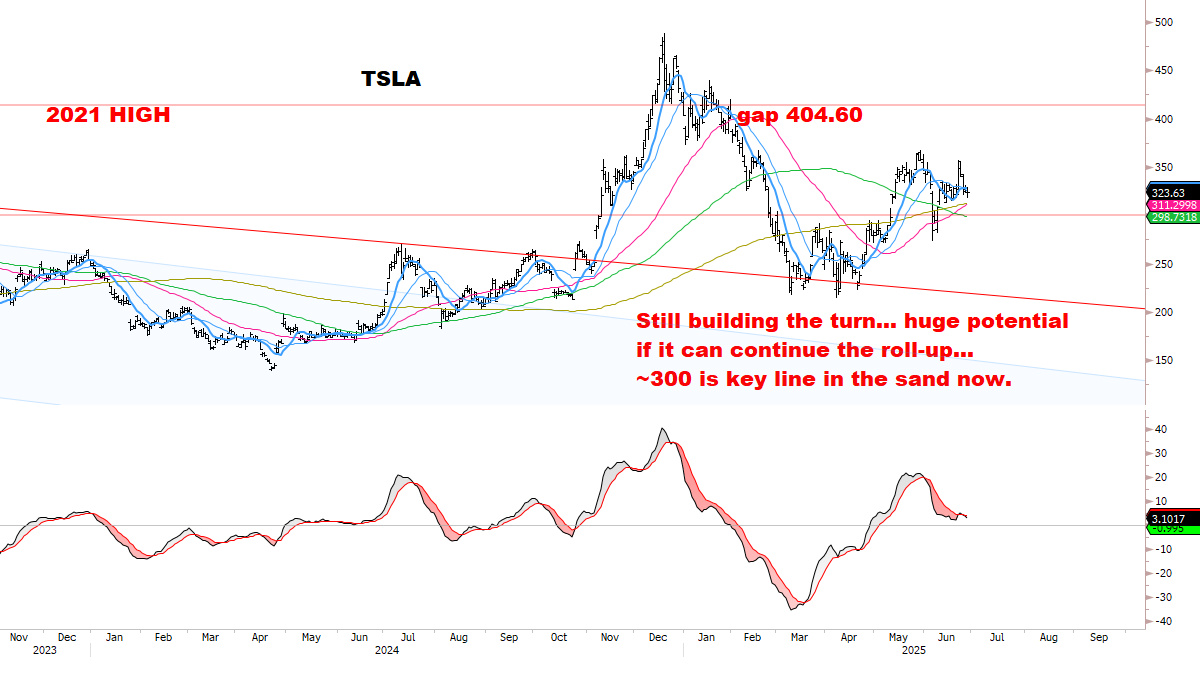
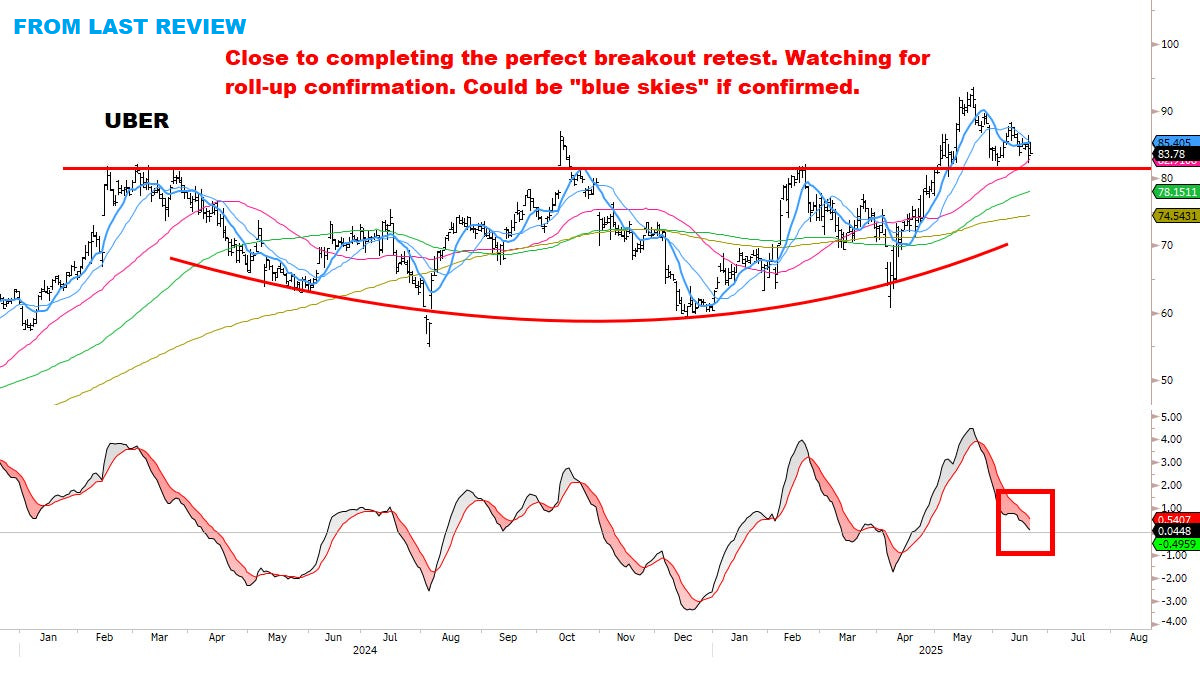
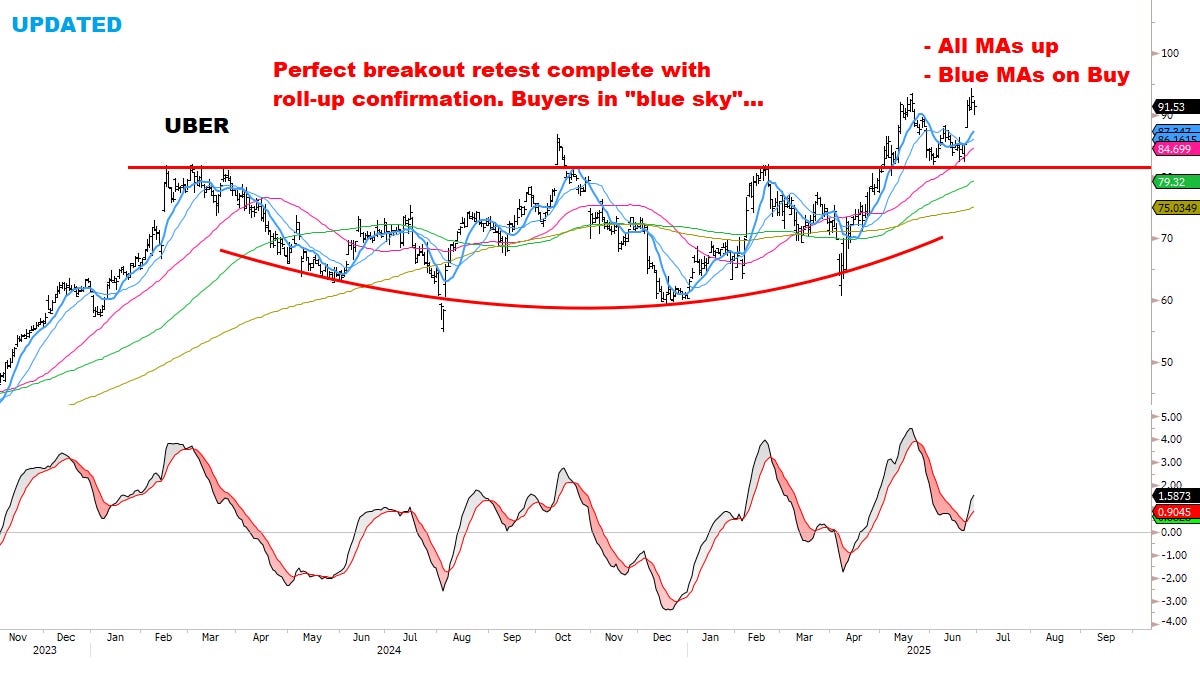
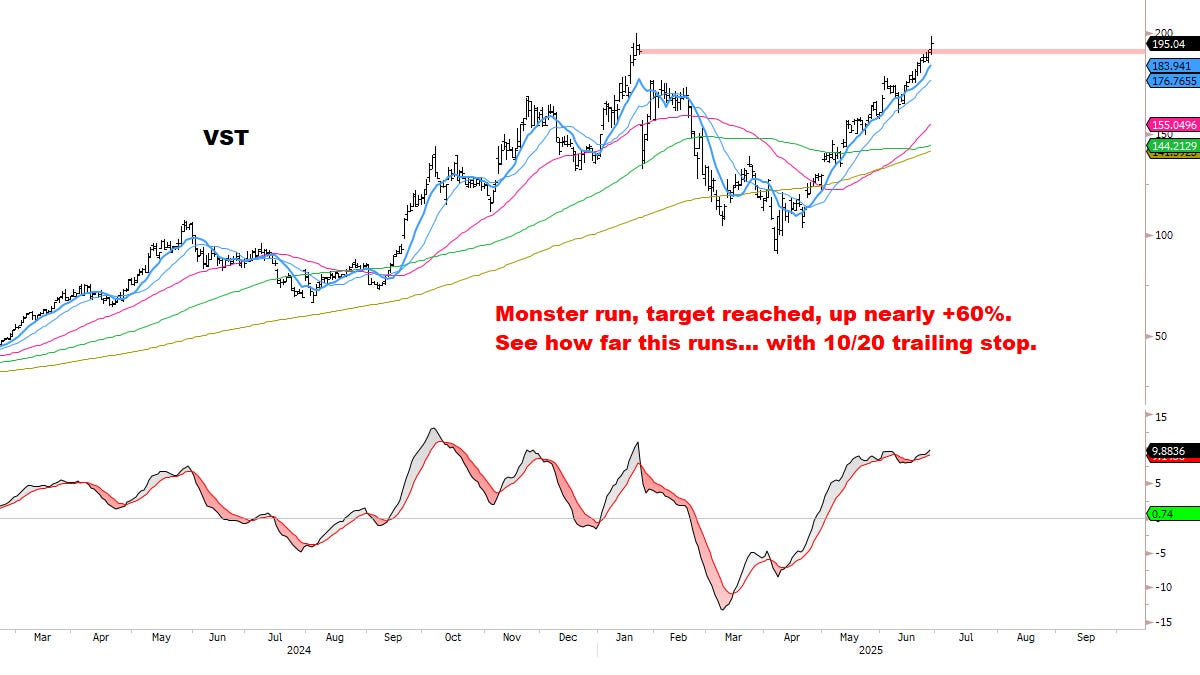
Updated Stocks Scan:
Through the end of June 2025, the average stock in our Core Watchlist is up +45%, with several names at/close to 2x — a strong outperformance relative to the market.
As before, focused on: Stocks meeting strict criteria for (1) relative strength, (2) improving momentum, (3) defined risk. And building on this list as signals develop.
SCAN: S&P, NDX, Consumer Discretionary, Semiconductors, Speculative/High-Beta.
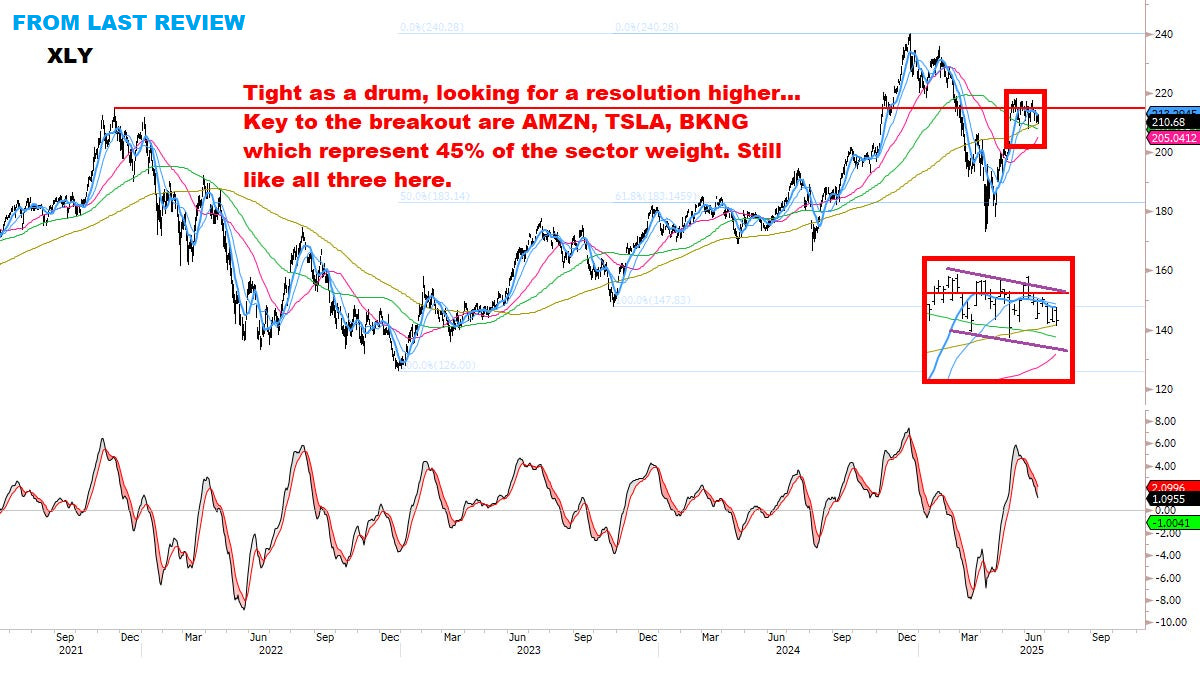
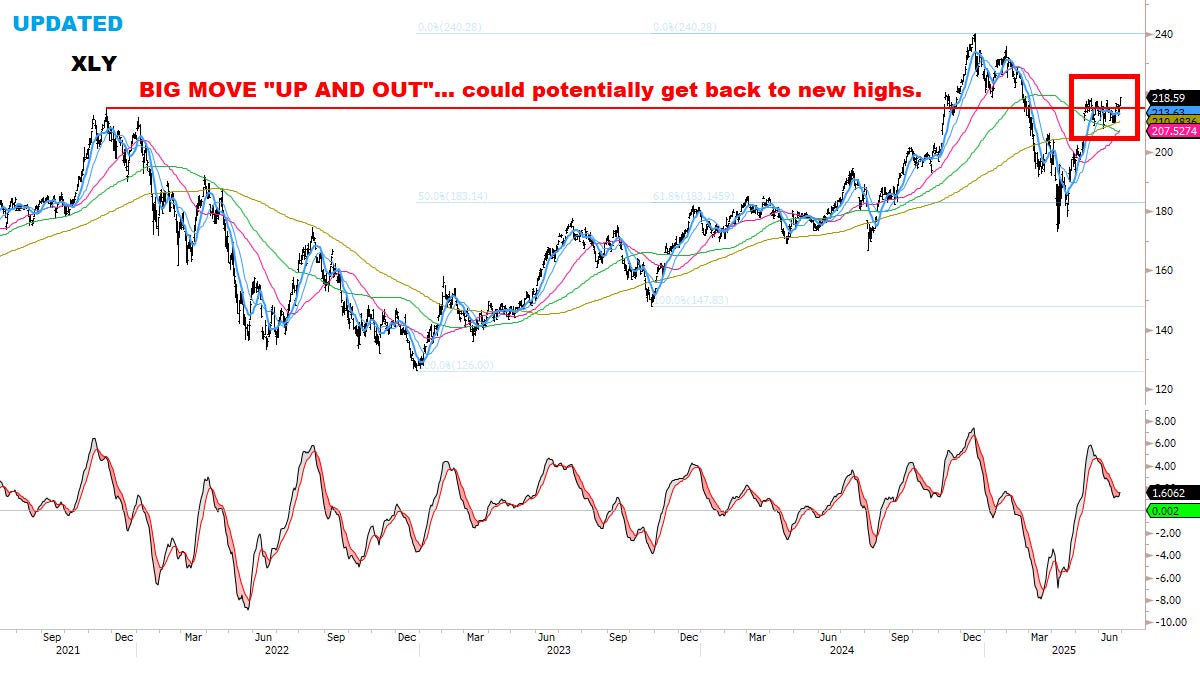
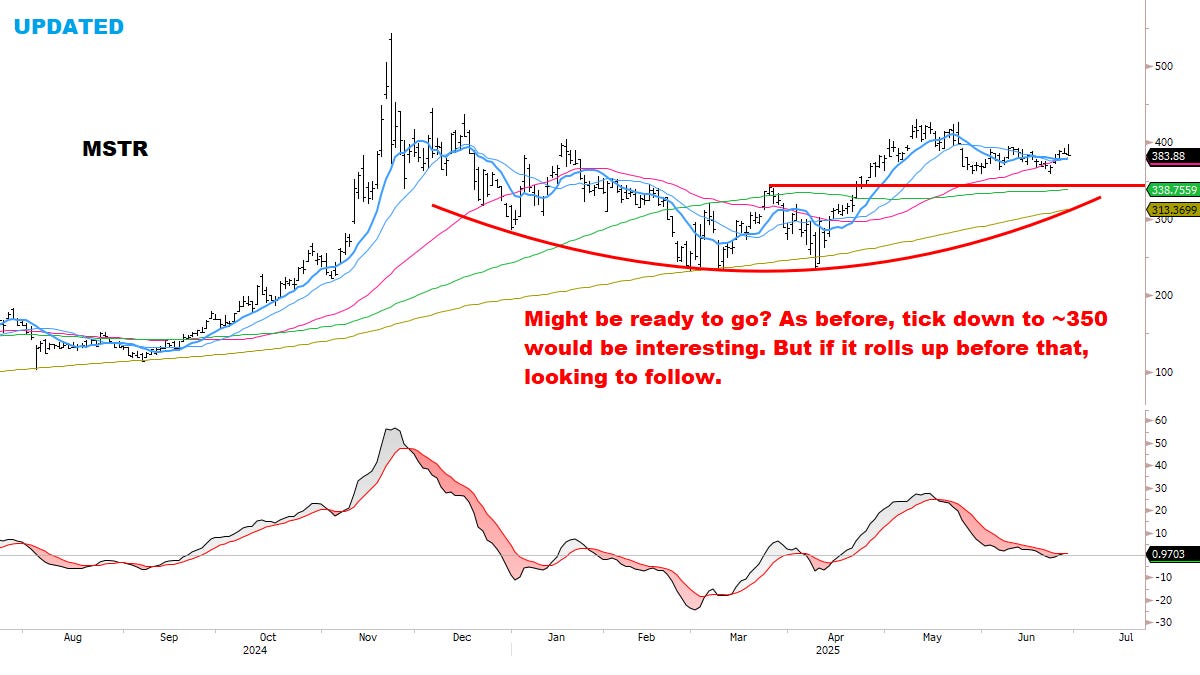
✅ Moving “UP & OUT” on schedule.
✅ This week was strong confirmation — our top names are *still* leading.
✅ Could this add more fuel to the rally? I still think so…
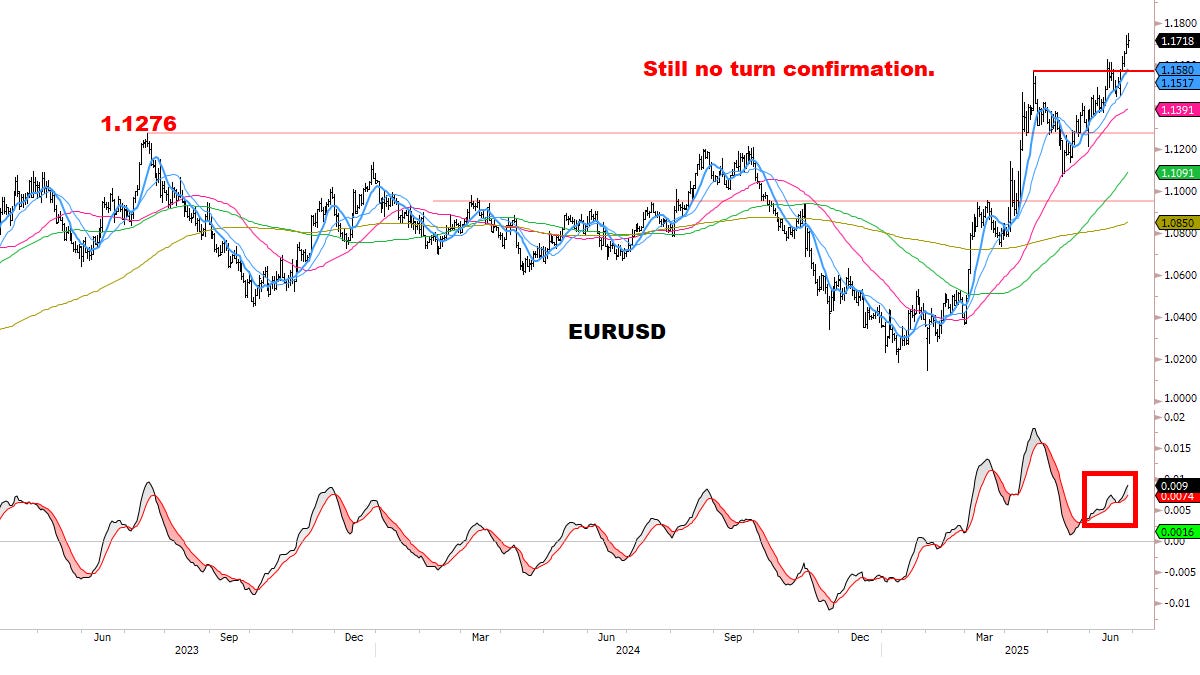
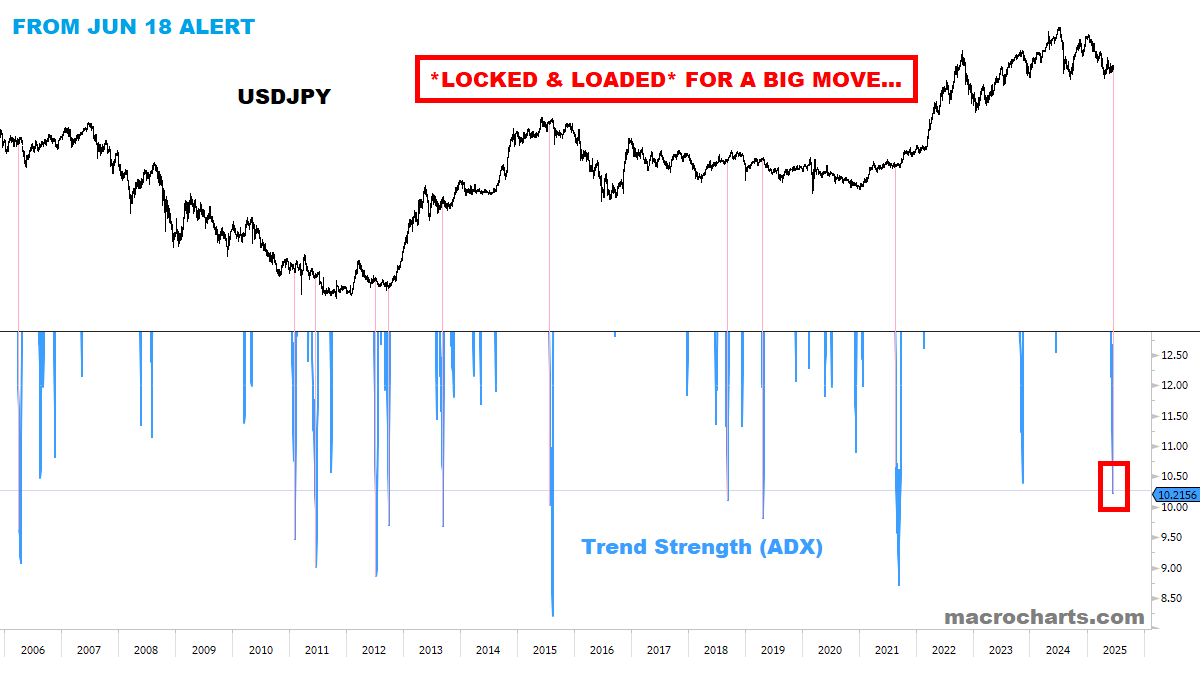
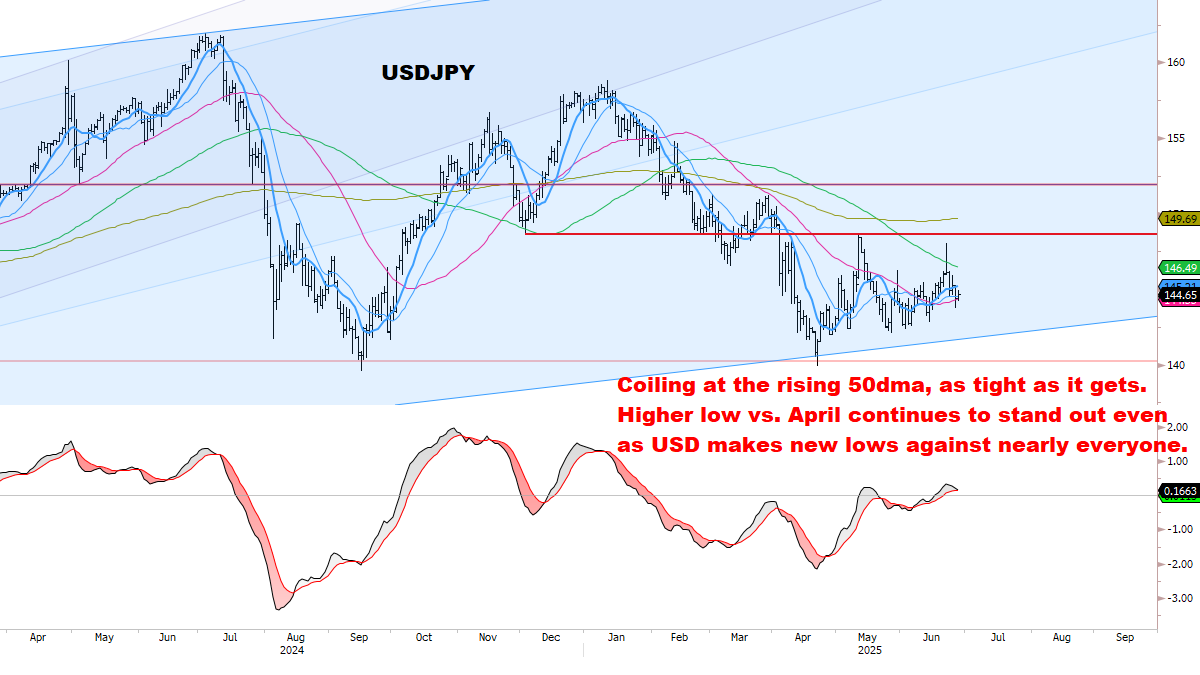
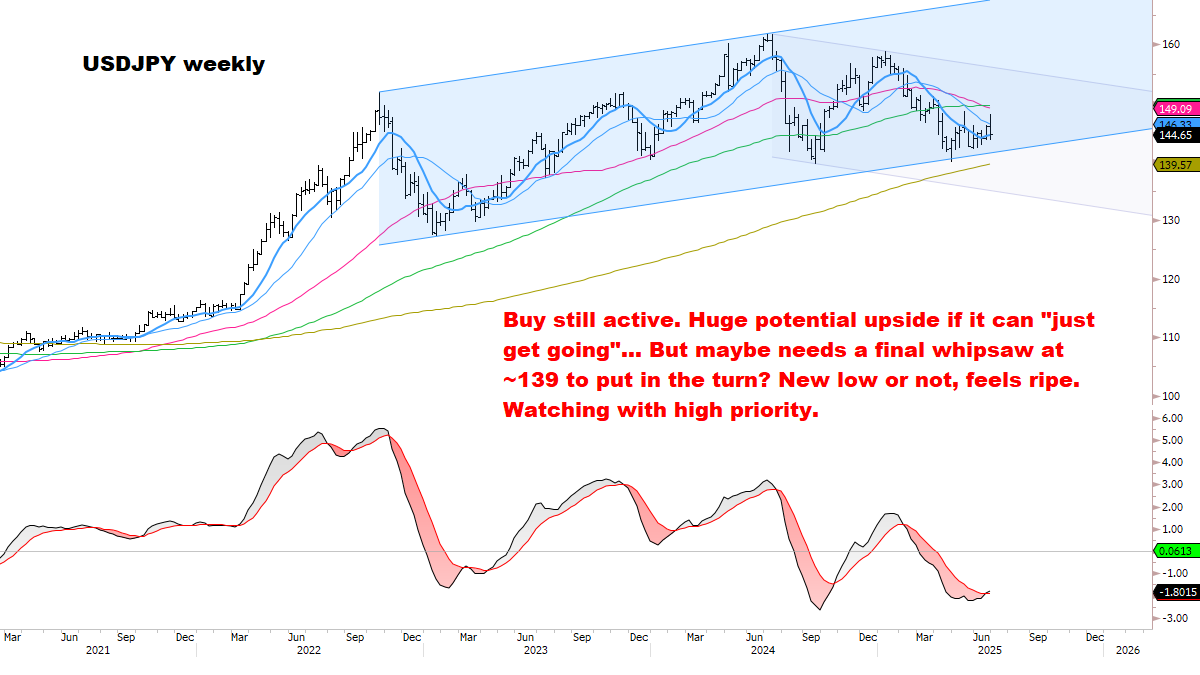
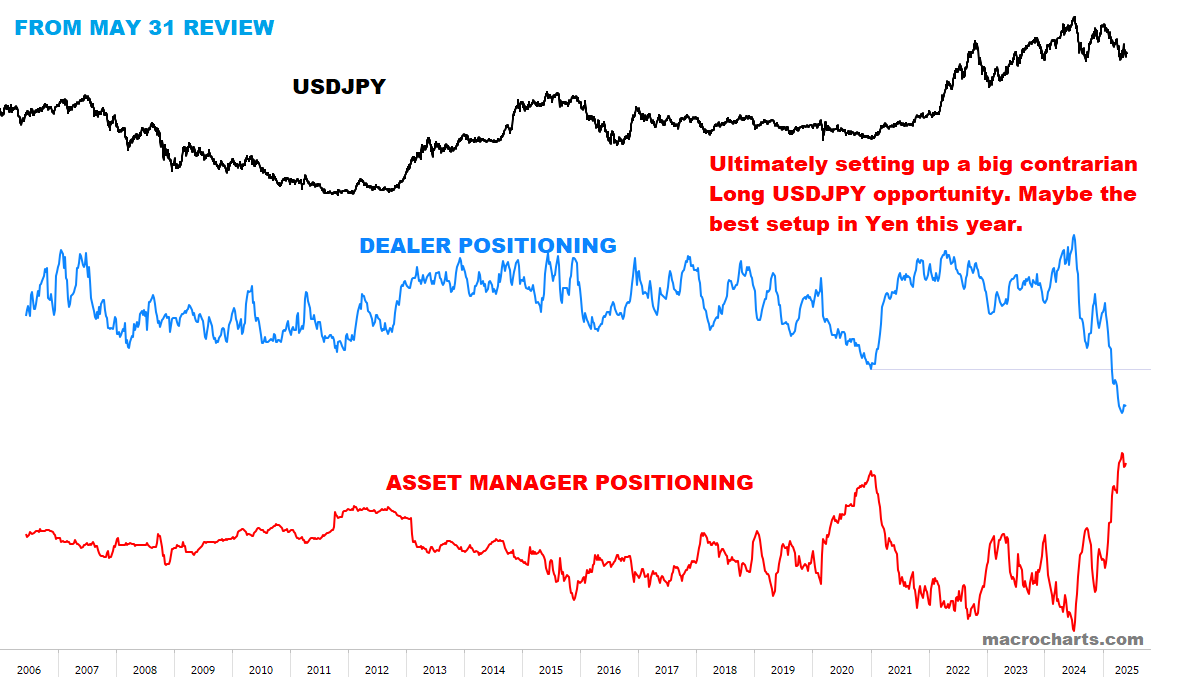
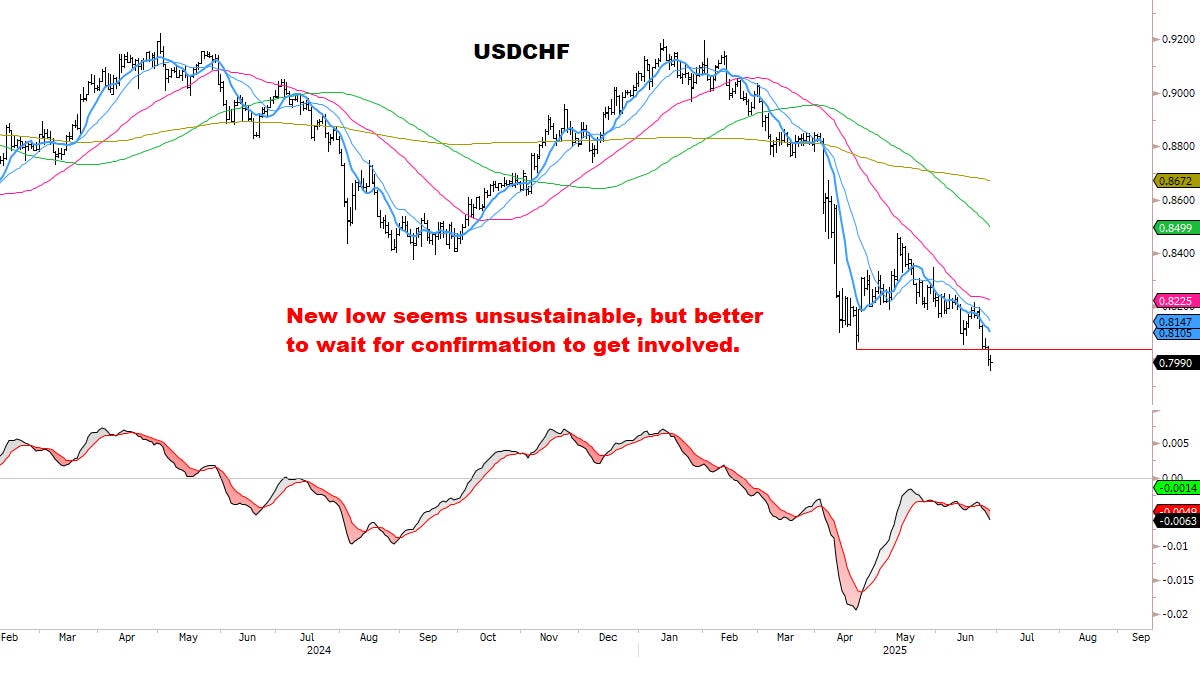
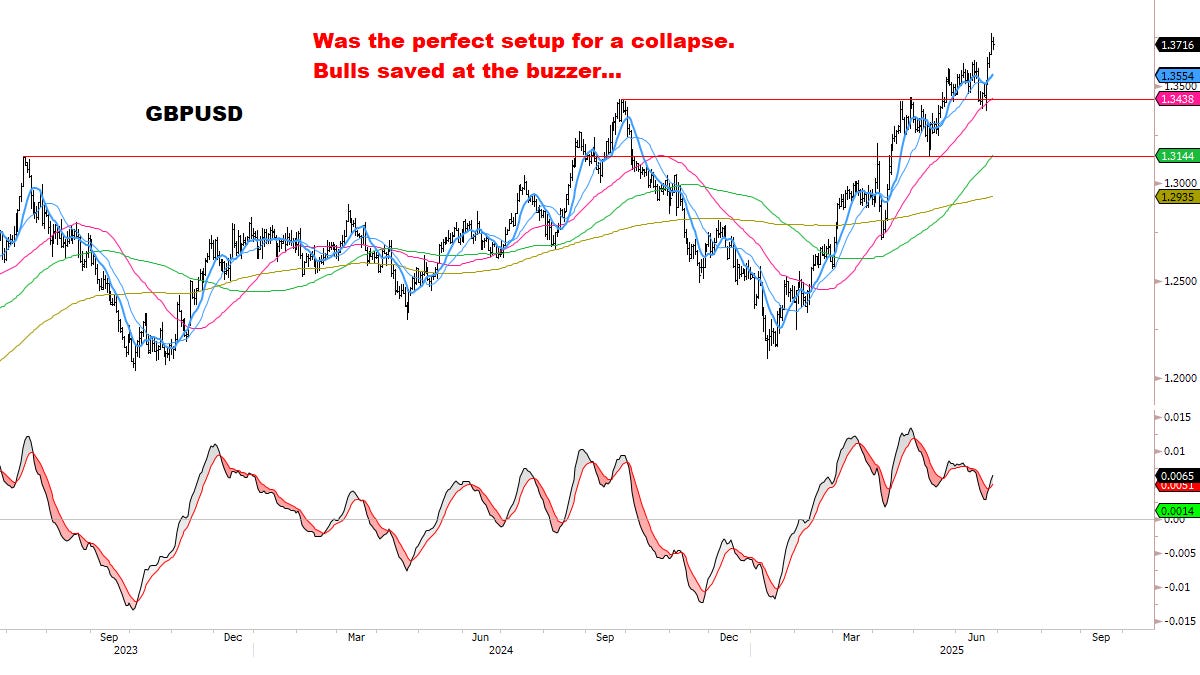
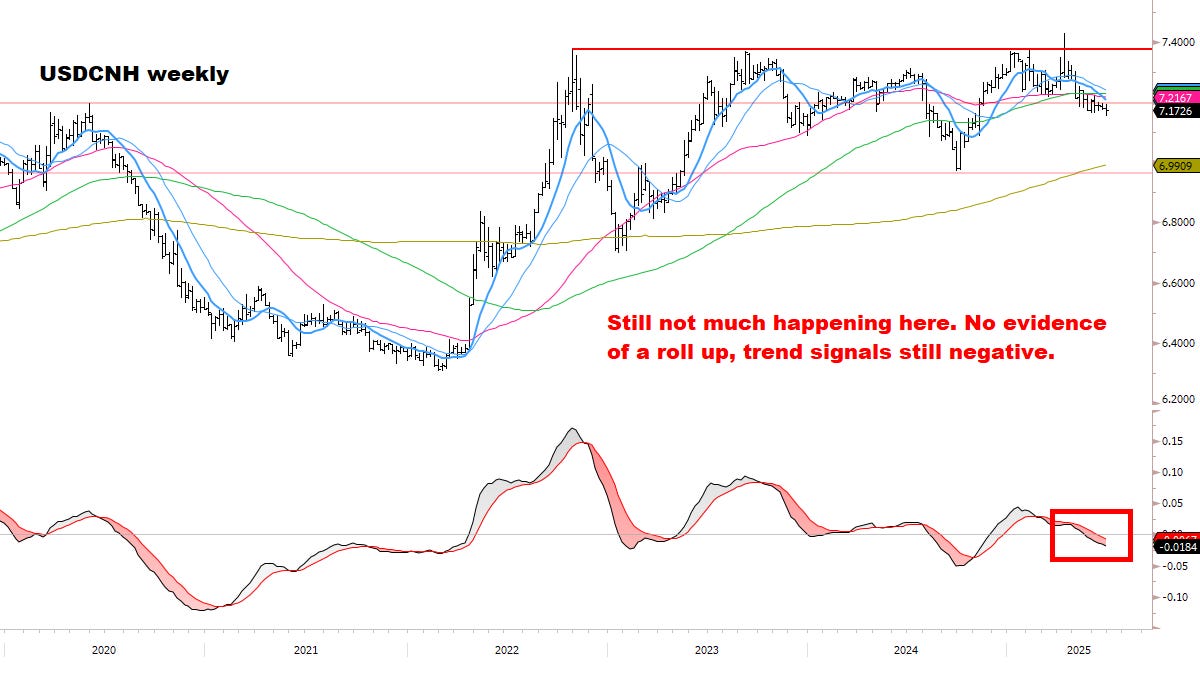
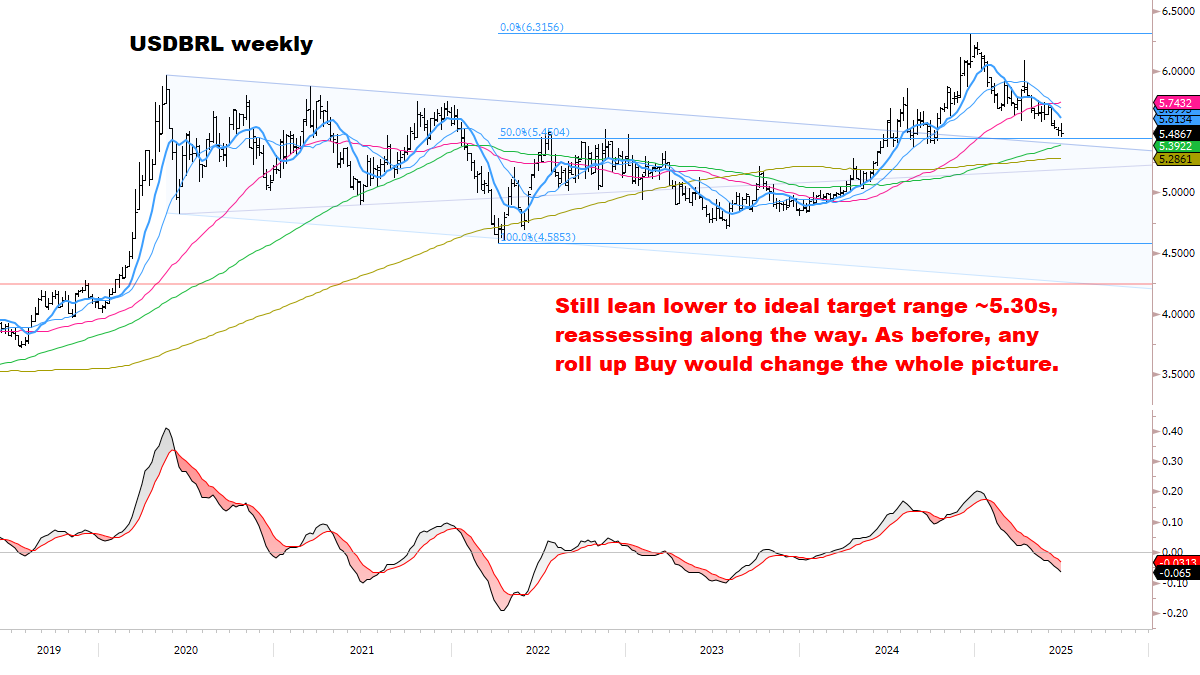
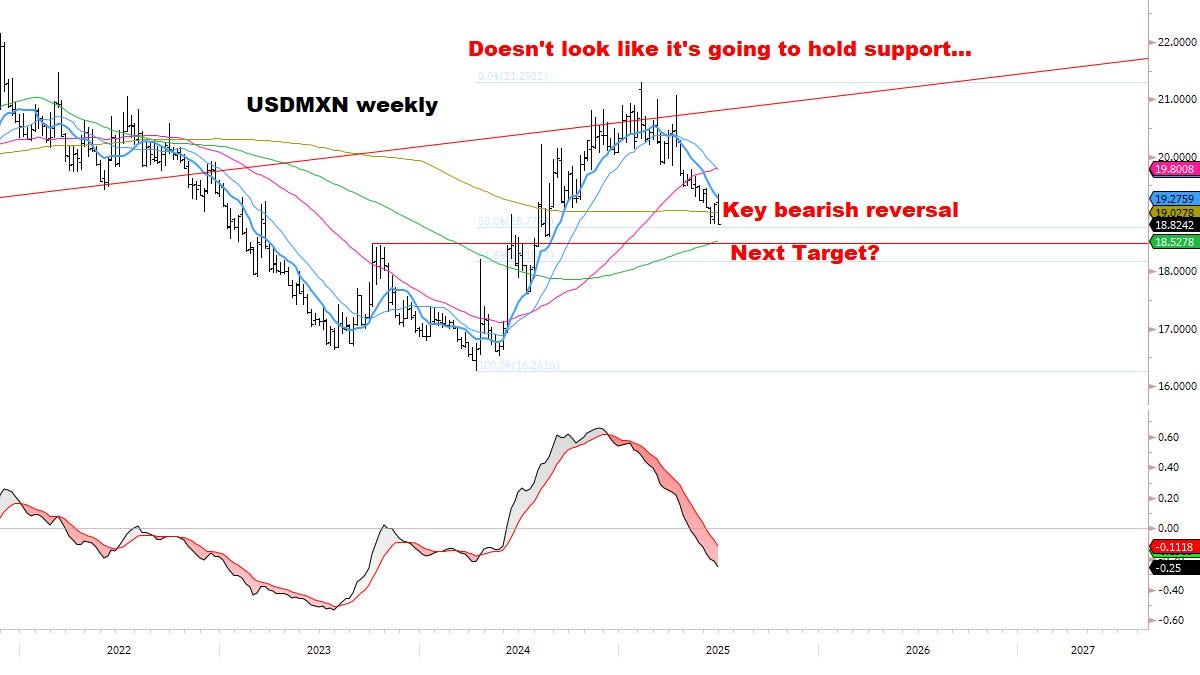
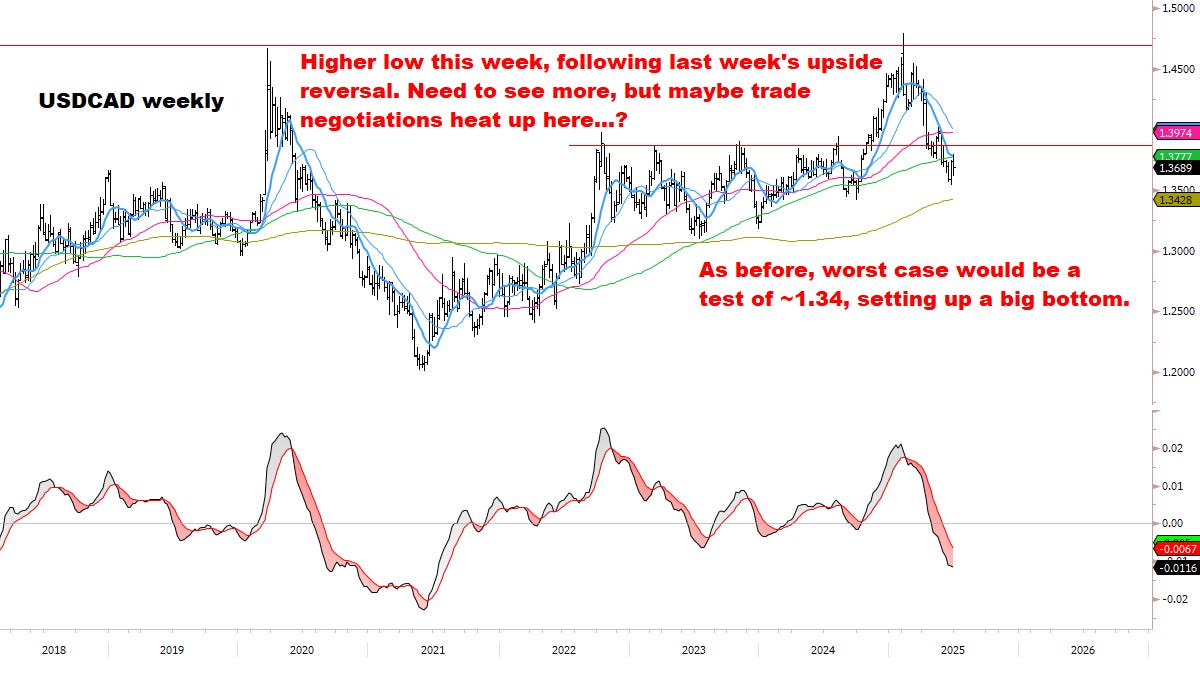
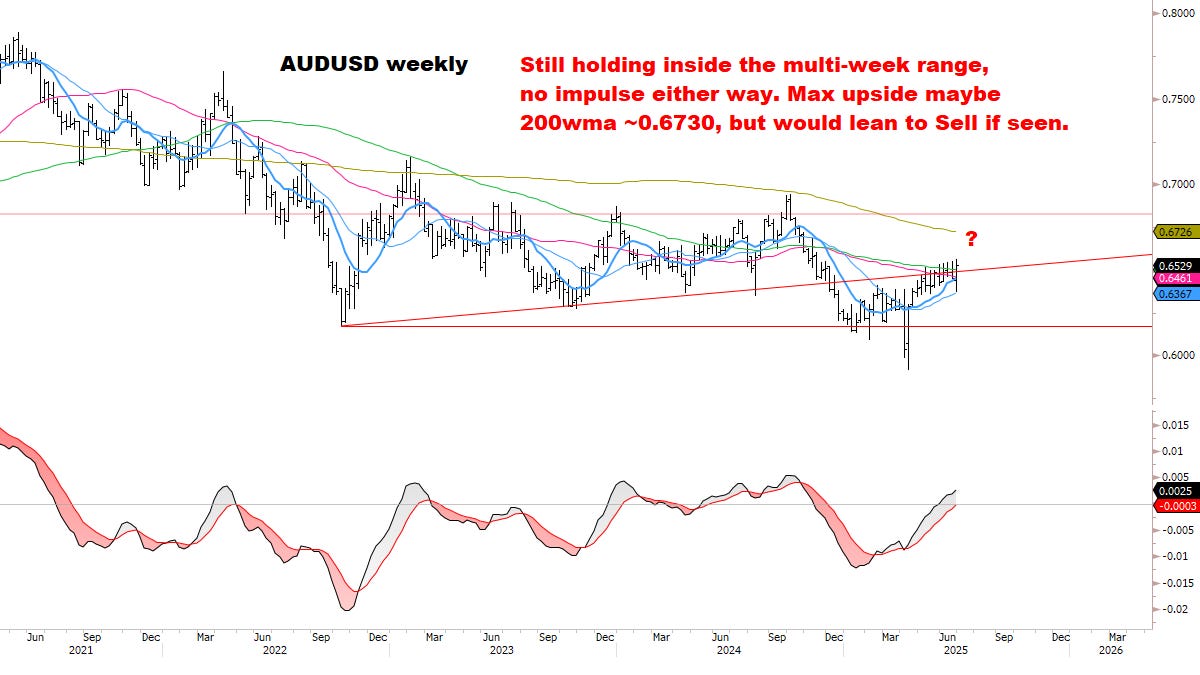
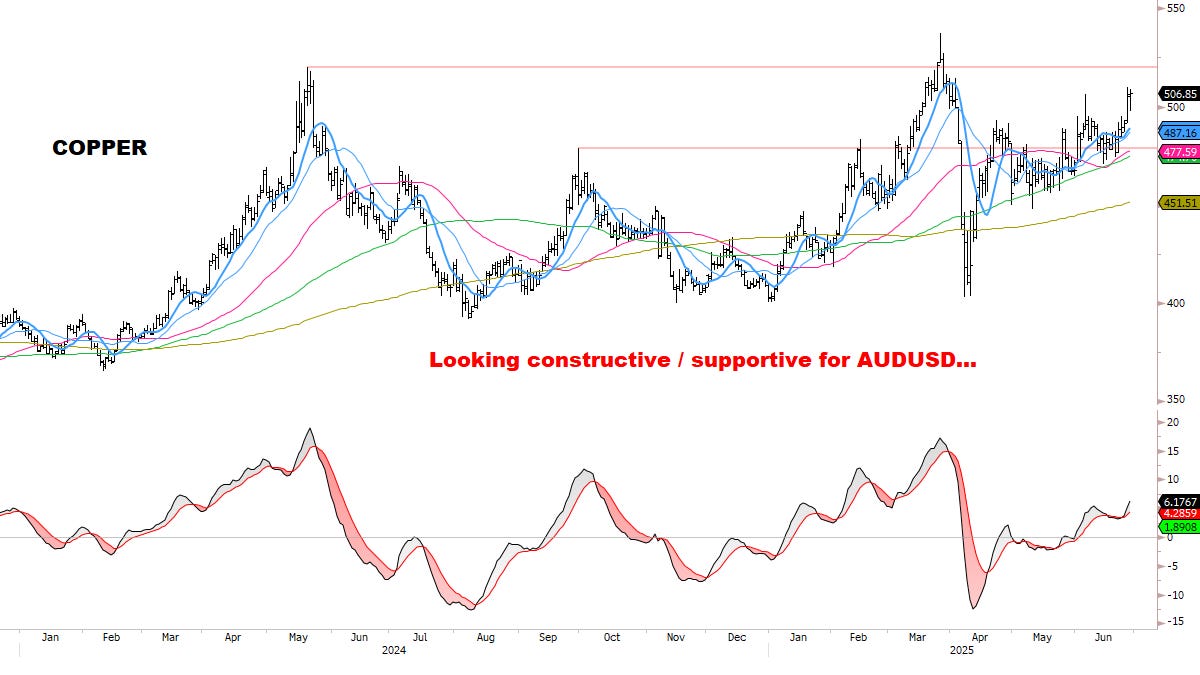
CURRENCIES
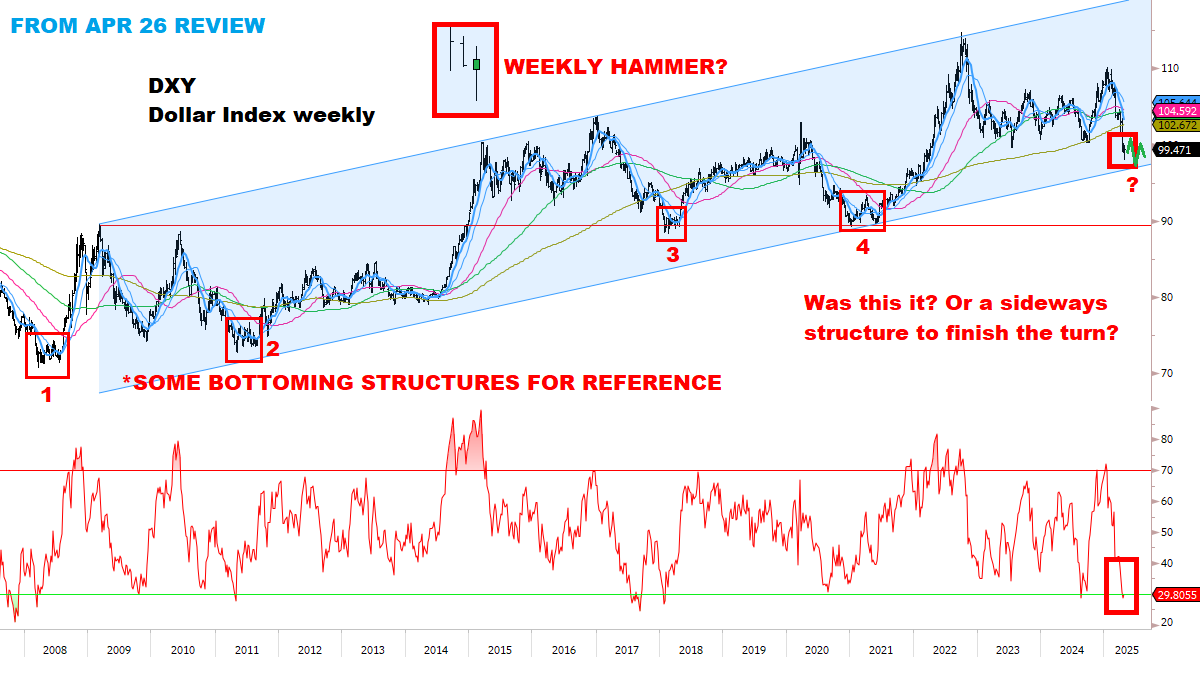
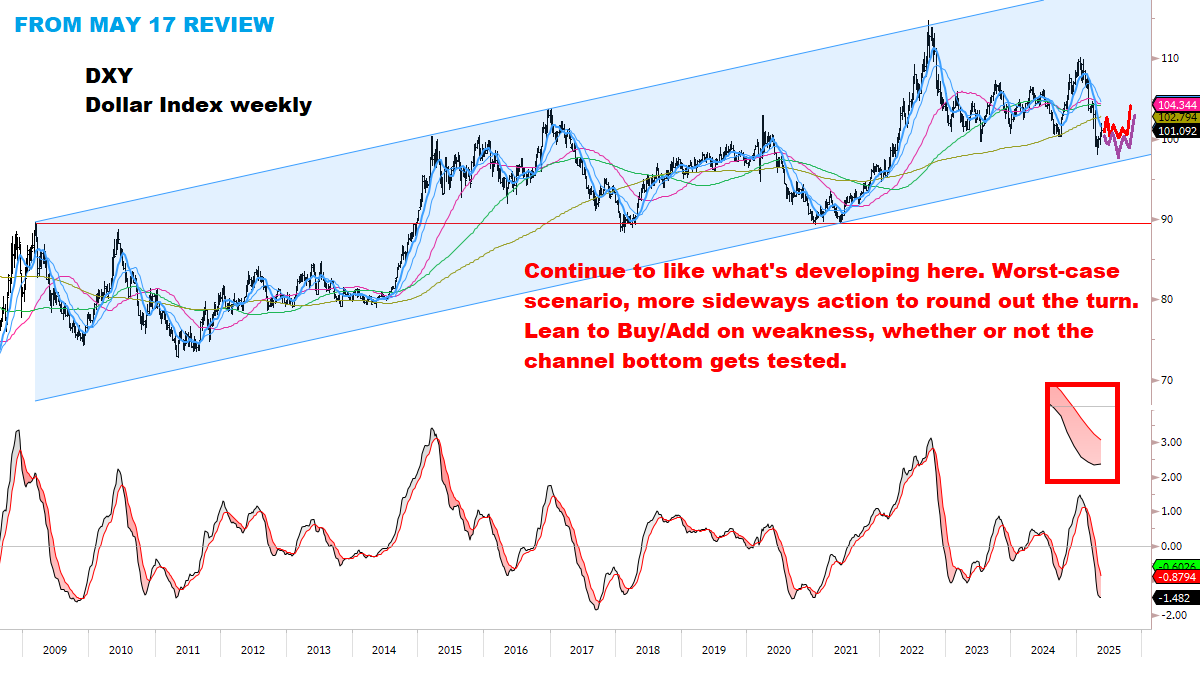
Watching the Dollar closely for a potential bottom.
Remain focused on the Big Four and looking to get aggressive:
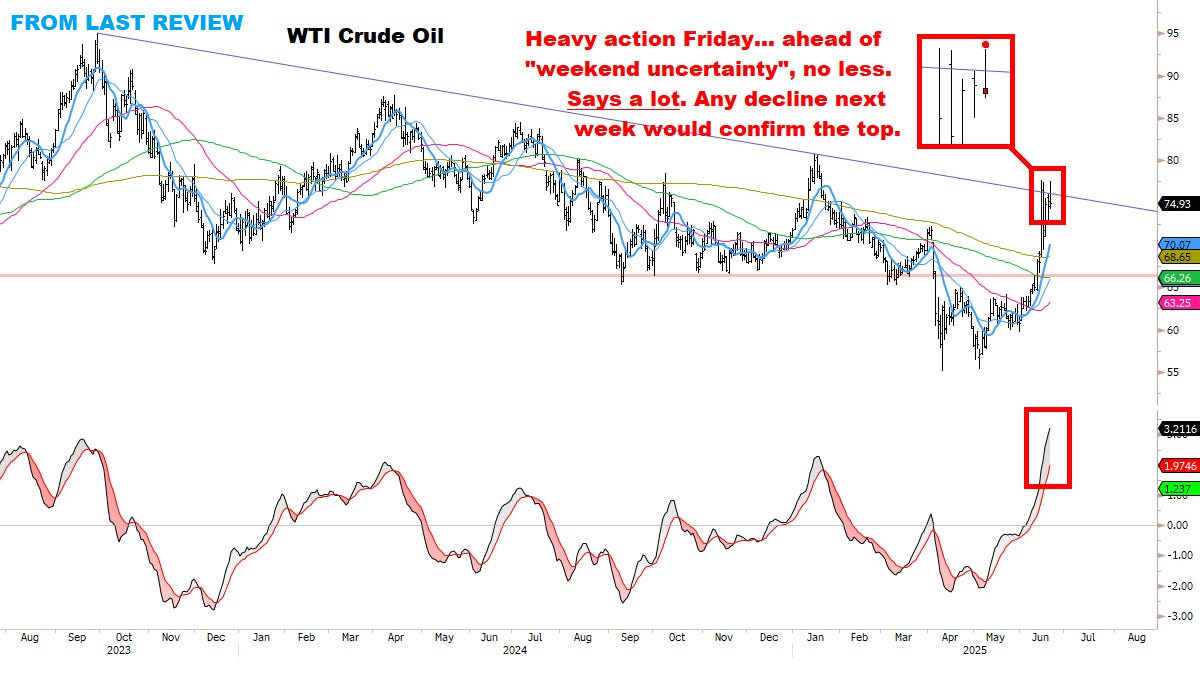
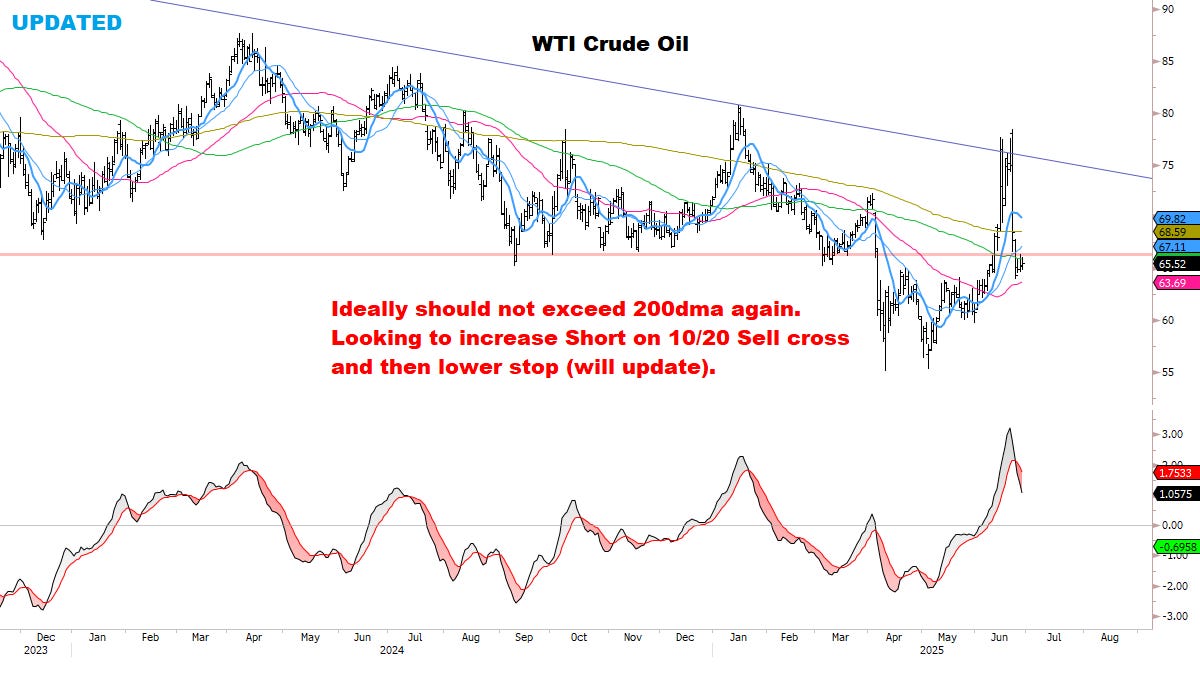
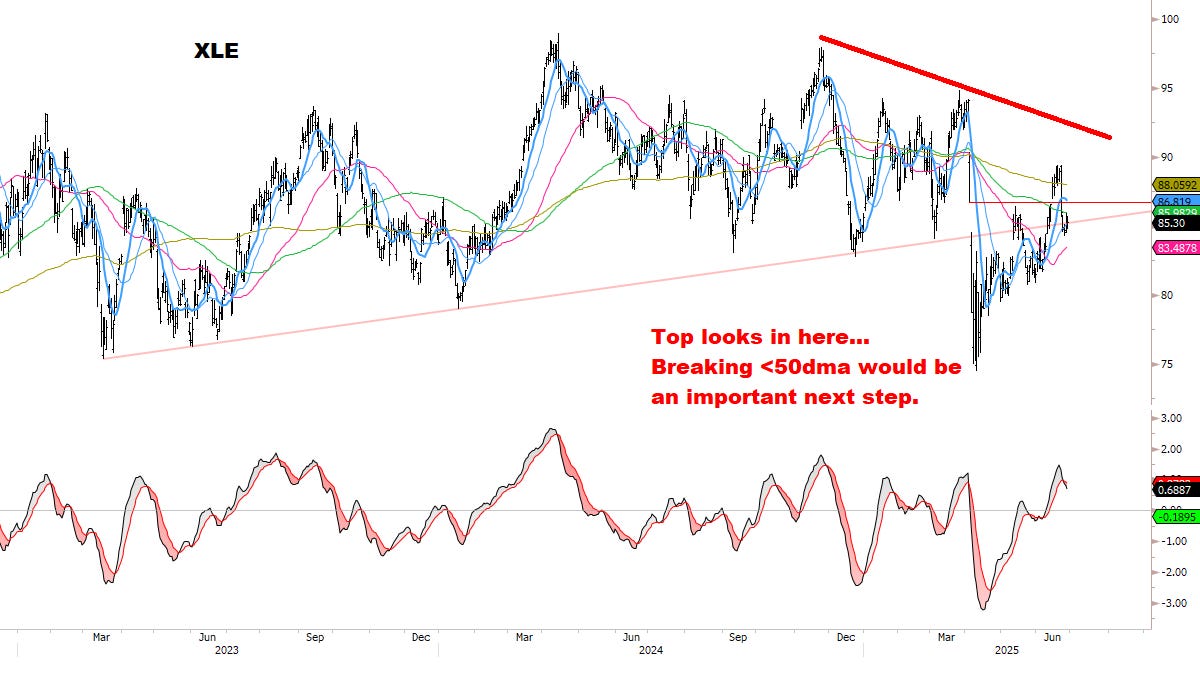
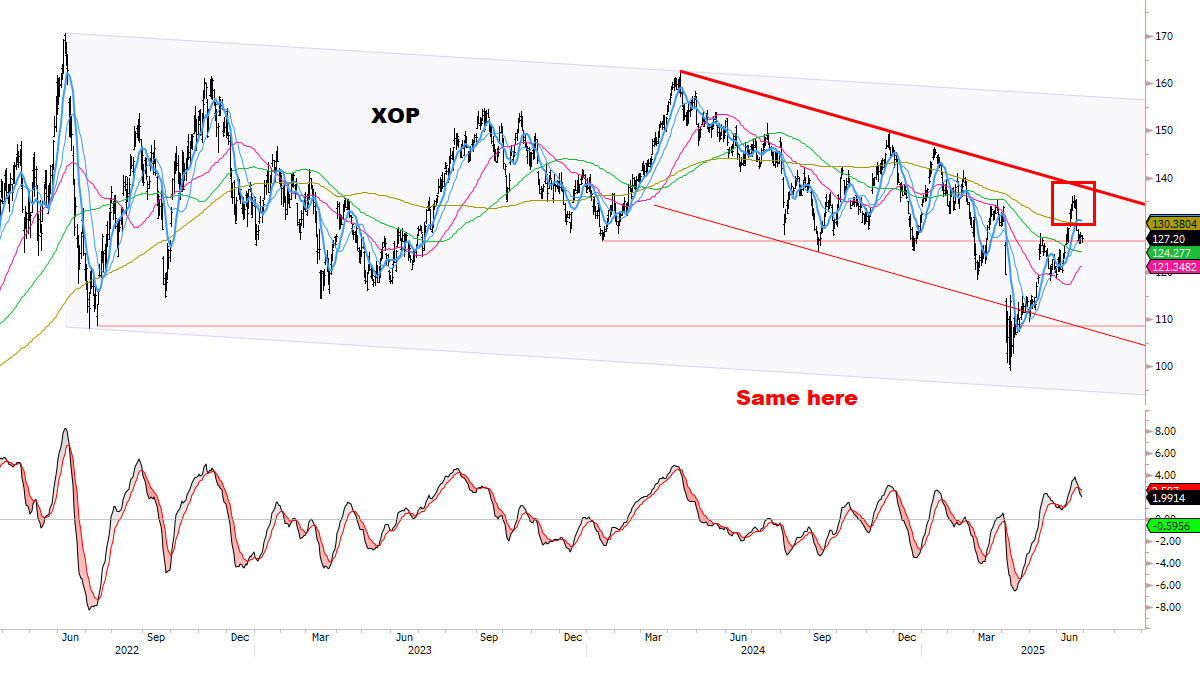
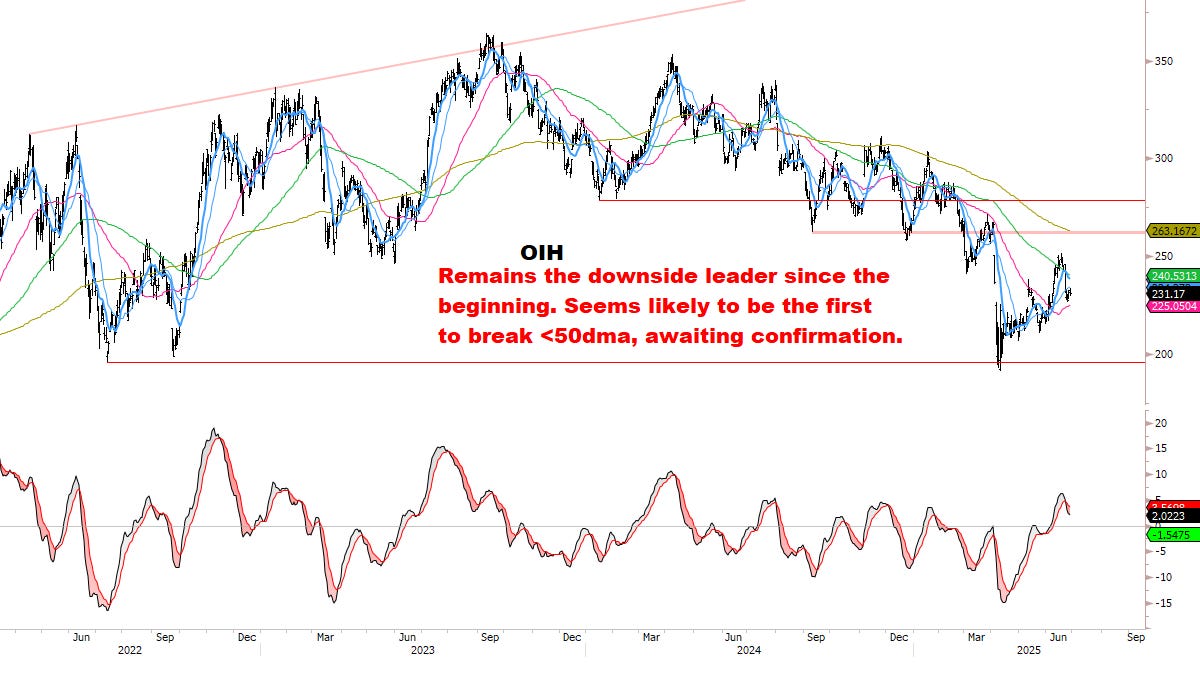
OIL & ENERGY
An important Top looks to be in:
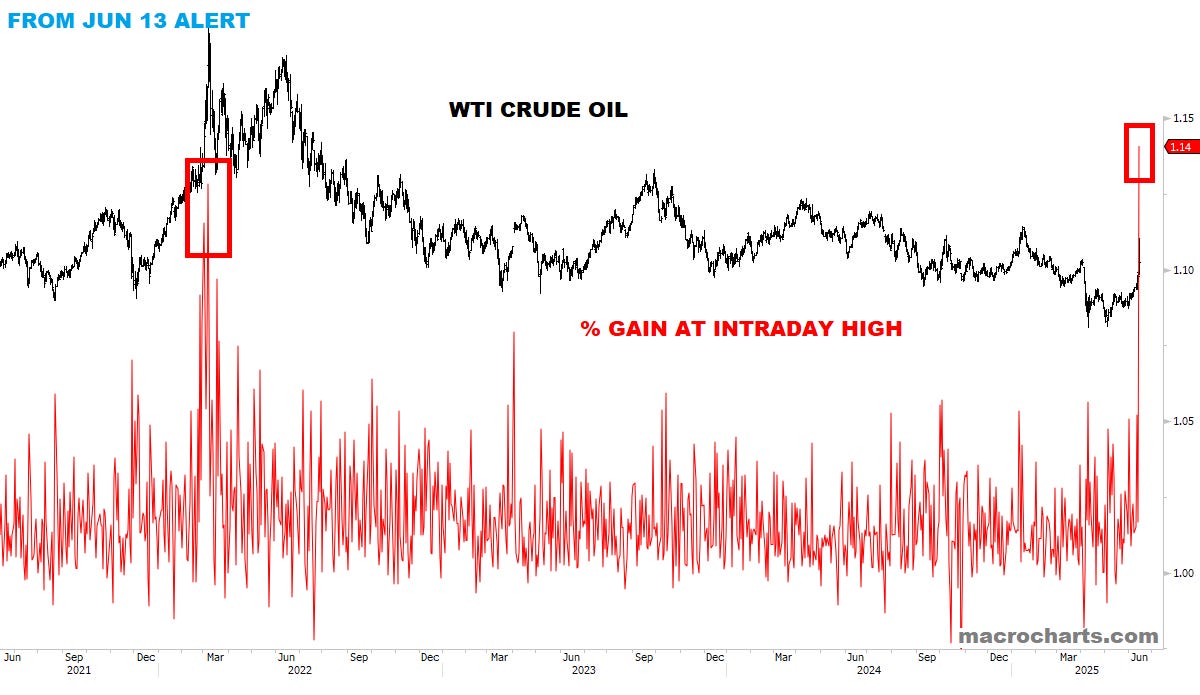
From June 13: “On the other side of this move, think this will be THE BEST Short opportunity in Oil/Energy for the entire year.”
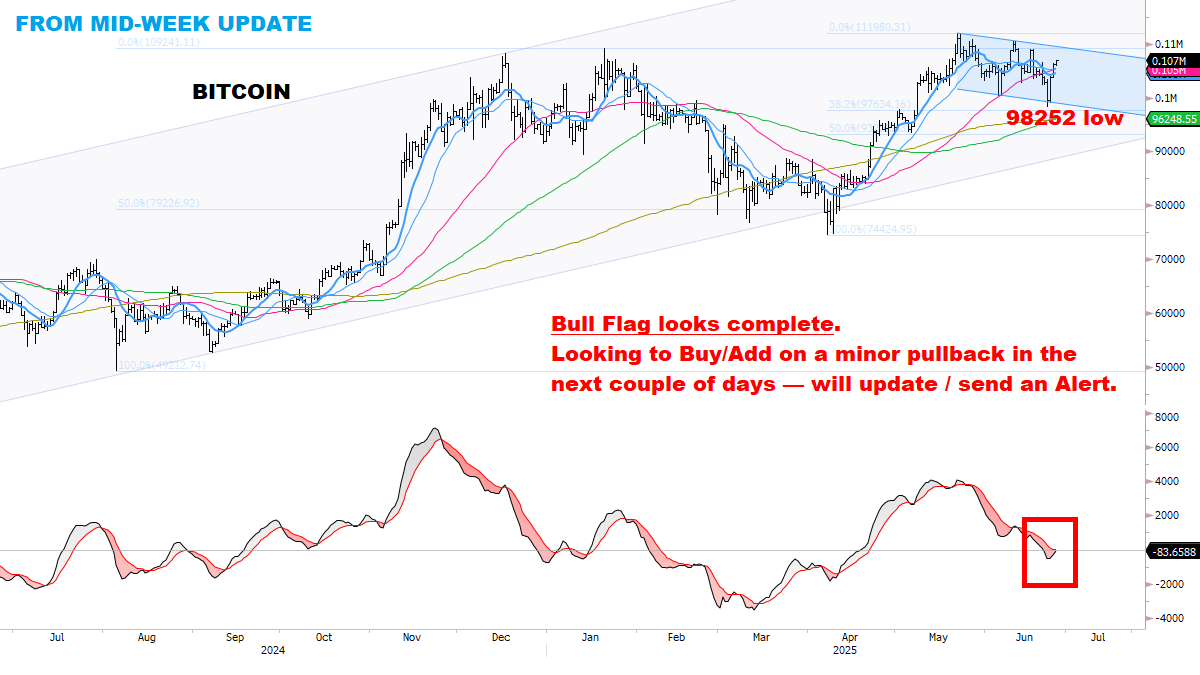
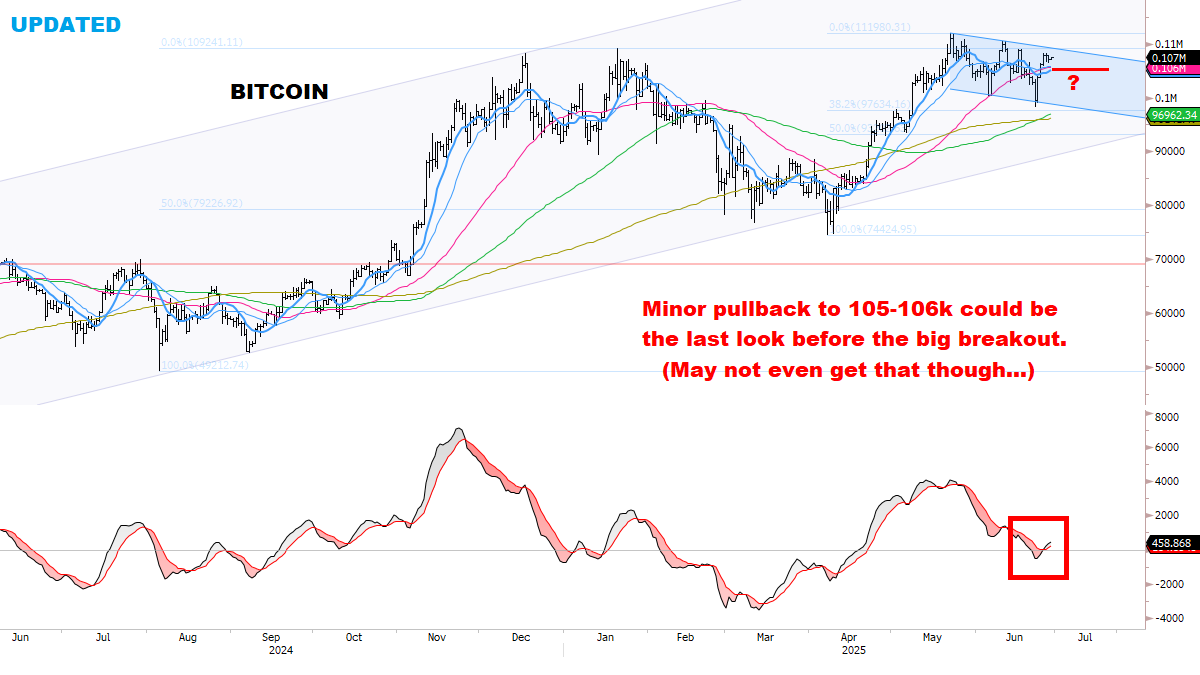
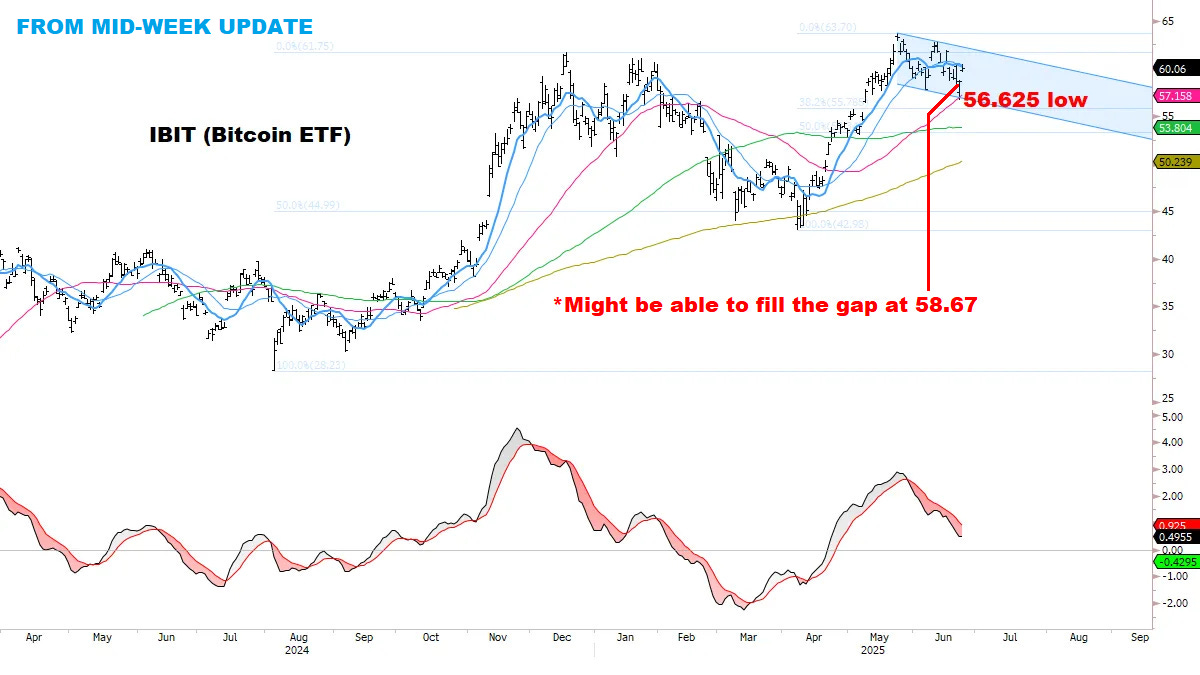
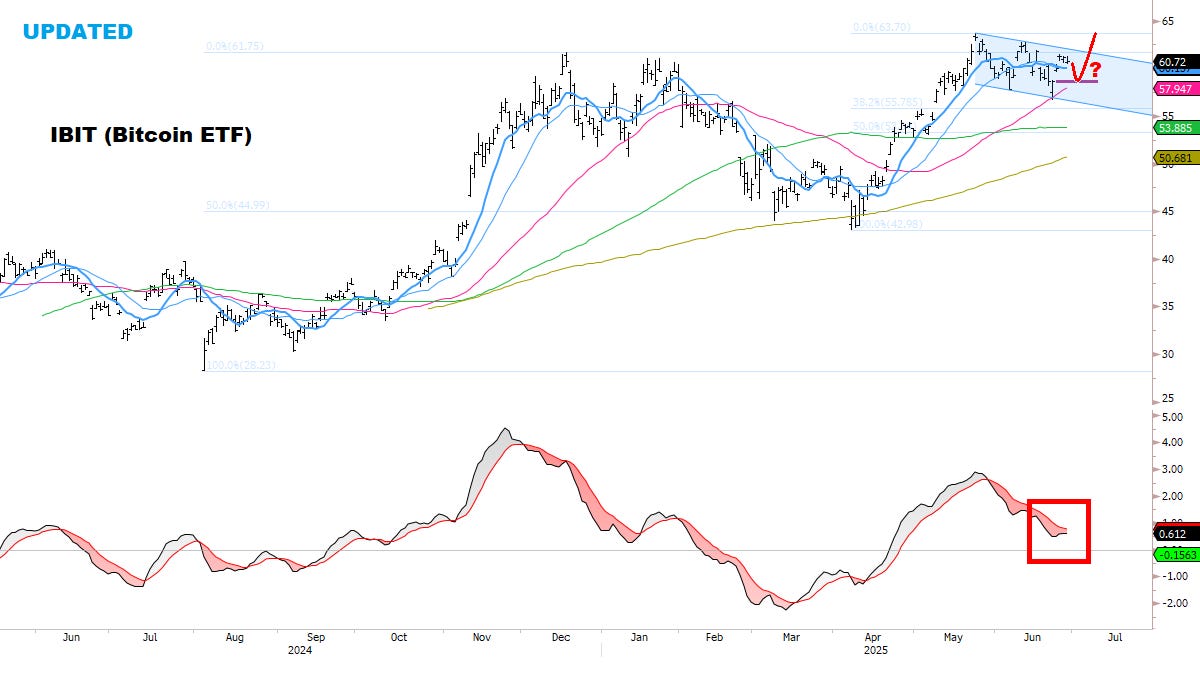
BITCOIN
Remains my #1 area of interest.
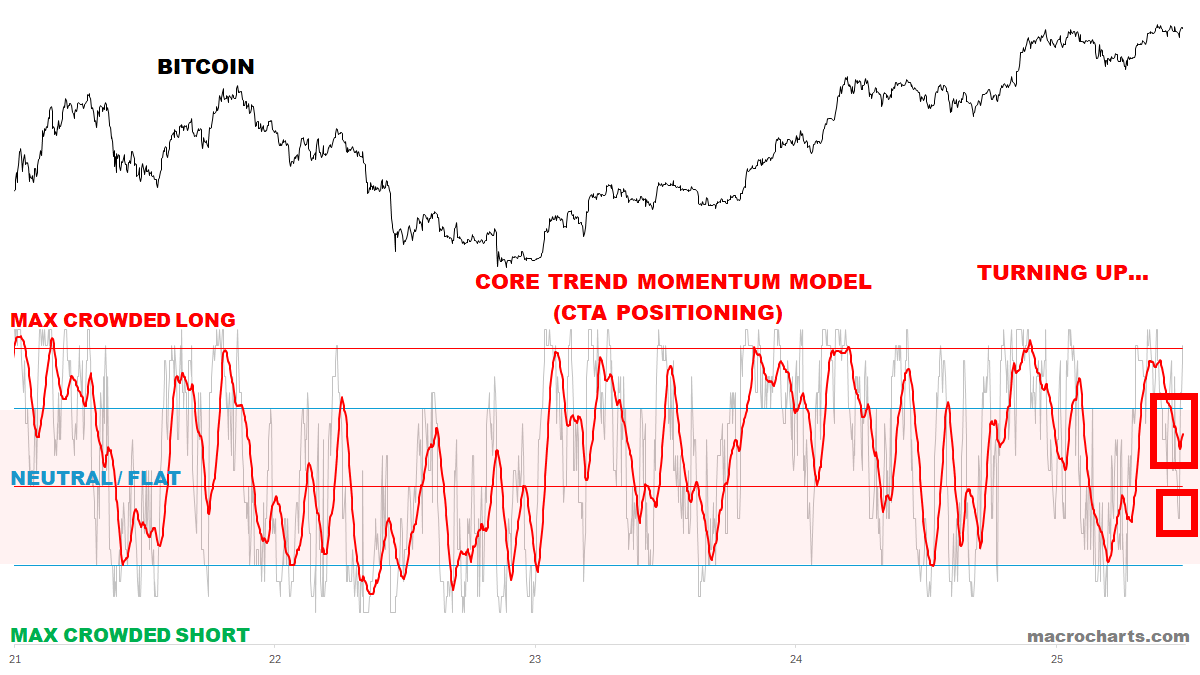
Continue to think Bitcoin could be the true leader (and has been since April):
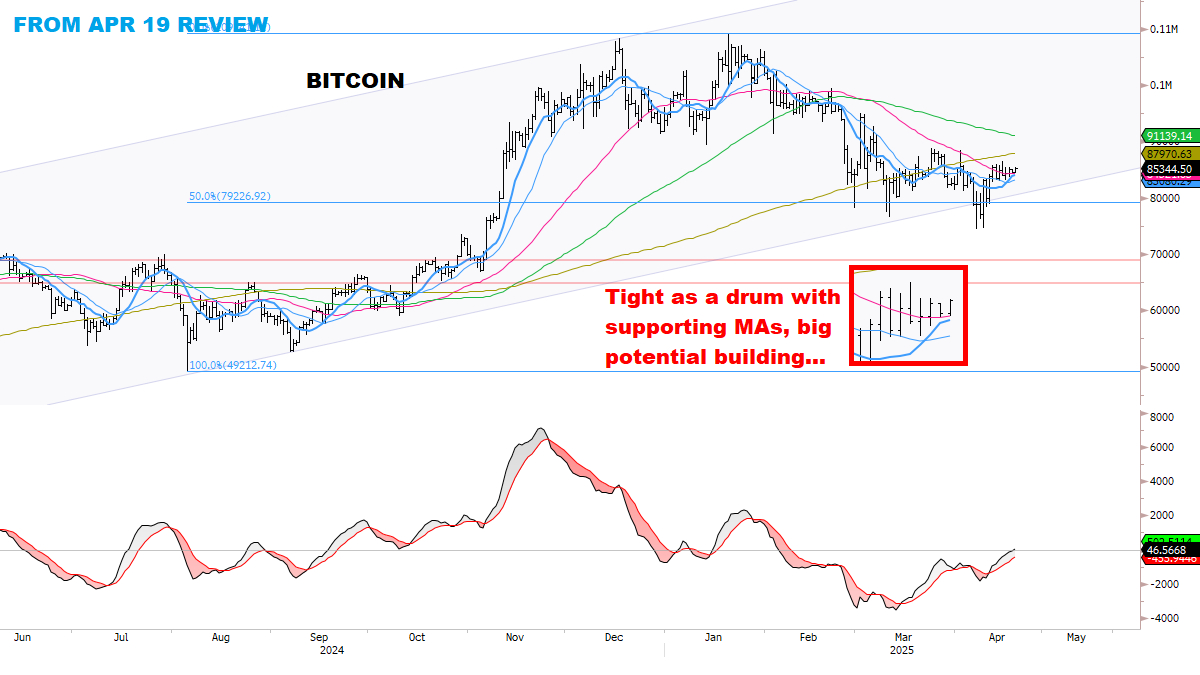
Tracking the perfect sequence:
A lot of opportunity building in many markets…
Thanks for reading.
Onwards and upwards, -MC
*If you enjoyed this report, likes are much appreciated!
✅HISTORY: (1) What We Learned in 2024, (2) Hurricane Watch: 2025 Strategy, (3) April 2025 Special Report & Core Execution Plan.
✅ABOUT: macrocharts.com/about.
✅Follow on X: @MacroCharts.
✅Charts viewable in High-Quality format on Web/App:


Copyright © 2025 Macro Charts Substack. All rights reserved.
This proprietary publication is protected by U.S. and International Copyright laws. All rights reserved. No license is granted, except for the subscriber’s personal use. No part of this publication or its contents may be copied, downloaded, transmitted, reproduced, stored, disseminated, transferred, or used, in any form or by any means, except with the prior written permission of Macro Charts Substack. Any further disclosure or use, distribution, dissemination or copying of this publication, message or any attachment is strictly prohibited. No reproduction, retransmission, or other use of the information or images is authorized.
This publication contains statements and statistics that have been obtained from sources believed to be reliable but are not guaranteed as to accuracy or completeness. References to any specific securities or investment advice of any kind do not constitute an offer to buy or sell securities. The past performance of an investment or investment strategy cannot guarantee its future performance. It should not be assumed that such analysis, past or future, will be profitable or will equal past performance or guarantee future performance or trends. All trading and investment decisions are the sole responsibility of the subscriber. Inclusion of information about portfolio changes and other information is not intended as any type of recommendation, nor solicitation.


