Prometheus and Grafana - Local server monitoring
 Stopped
VI - Monitoring the local server
VI - Monitoring the local server
a - Creating a Prometheus Grafana stack with Docker-compose
We're going to set up our server monitoring using Prometheus and Grafana. Let's start by visualizing the architecture of our working directory:
├── alertmanager
│ └── config.yml
├── docker-compose.yml
├── grafana
│ ├── config.monitoring
│ └── provisioning
│ ├── dashboards
│ │ ├── Docker_Prometheus_Monitoring.json
│ │ ├── System_Monitoring.json
│ │ ├── Datascientest_System_Monitor.json
│ │ └── dashboard.yml
│ └── datasources
│ └── datasource.yml
├── prometheus
│ ├── alert.rules
│ └── prometheus.yml
We'll start by creating a directory in which we'll create our files. We'll call prometheus-grafana-datascientest , Then we'll create the various directories and files we need:
mkdir prometheus-grafana-datascientest
mkdir prometheus-grafana-datascientest/alertmanager
mkdir prometheus-grafana-datascientest/grafana
mkdir prometheus-grafana-datascientest/grafana/provisioning
mkdir prometheus-grafana-datascientest/grafana/provisioning/dashboards
mkdir prometheus-grafana-datascientest/grafana/provisioning/datasources
mkdir prometheus-grafana-datascientest/prometheus
cd prometheus-grafana-datascientest
touch docker-compose.yml
touch alertmanager/config.yml
touch prometheus/alert.rules
touch prometheus/prometheus.yml
touch grafana/config.monitoring
touch grafana/provisioning/dashboards/Docker_Prometheus_Monitoring.json
touch grafana/provisioning/dashboards/Datascientest_System_Monitor.json
touch grafana/provisioning/dashboards/dashboard.yml
touch grafana/provisioning/datasources/datasource.yml
Now let's put the following content in the docker-compose.yml:
version: '3.7'

volumes:
    prometheus_data: {}
    grafana_data: {}

networks:
  front-tier:
  back-tier:

services:
  prometheus:
    image: prom/prometheus:v2.36.2
    volumes:
      - ./prometheus/:/etc/prometheus/
      - prometheus_data:/prometheus
    command:
      - '--config.file=/etc/prometheus/prometheus.yml'
      --'storage.tsdb.path=/prometheus'
      --web.console.libraries=/usr/share/prometheus/console_libraries'
      --web.console.templates=/usr/share/prometheus/consoles'
    ports:
      - 9090:9090
    links:
      - cadvisor:cadvisor
      - alertmanager:alertmanager
    depends_on:
      - cadvisor
    networks:
      - back-tier
    restart: always

  node-exporter:
    image: quay.io/prometheus/node-exporter:latest
    volumes:
      - /proc:/host/proc:ro
      - /sys:/host/sys:ro
      - /:/rootfs:ro
      - /:/host:ro,rslave
    command:
      - '--path.rootfs=/host'
      - '--path.procfs=/host/proc'
      - '--path.sysfs=/host/sys'
      - '--collector.filesystem.ignored-mount-points
      - "^/(sys|proc|dev|host|etc|rootfs/var/lib/docker/containers|rootfs/var/lib/docker/overlay2|rootfs/run/docker/netns|rootfs/var/lib/docker/aufs)($$|/)"
    ports:
      - 9110:9100
    networks:
      - back-tier
    restart: always
    deploy:
      mode: global

  alertmanager:
    image: prom/alertmanager
    ports:
      - 9093:9093
    volumes:
      - ./alertmanager/:/etc/alertmanager/
    networks:
      - back-tier
    restart: always
    command:
      - '--config.file=/etc/alertmanager/config.yml'
      --storage.path=/alertmanager'

  cadvisor:
    image: gcr.io/cadvisor/cadvisor
    volumes:
      - /:/rootfs:ro
      - /var/run:/var/run:rw
      - /sys:/sys:ro
      - /var/lib/docker/:/var/lib/docker:ro
    ports:
      - 8080:8080
    networks:
      - back-tier
    restart: always
    deploy:
      mode: global

  grafana:
    image: grafana/grafana
    user: "472"
    depends_on:
      - prometheus
    ports:
      - 3000:3000
    volumes:
      - grafana_data:/var/lib/grafana
      - ./grafana/provisioning/:/etc/grafana/provisioning/
    env_file:
      - ./grafana/config.monitoring
    networks:
      - back-tier
      - front-tier
    restart: always
We're going to create 5 services using our docker-compose.yml:
cAdvisor (container Advisor) which analyzes and exposes resource usage and performance data of running containers.
cAdvisorexposes Prometheus metrics.The
node_exporteris designed to monitor the host system. It is not recommended for deployment as a Docker container as it requires access to the host system.Prometheus & Grafana
The Alertmanager which manages alerts sent by client applications such as the Prometheus server.
We'll add the following content to the prometheus/alert.rules file:
groups:
- name: example
  rules:

  # Alert for any instance that is unreachable for >2 minutes.
  - alert: service_down
    expr: up == 0
    for: 2m
    labels:
      severity: page
    annotations:
      summary: "Instance {{ $labels.instance }} down"
      description: "{{ $labels.instance }} of job {{ $labels.job }} has been down for more than 2 minutes."

  - alert: high_load
    expr: node_load1 > 0.5
    for: 2m
    labels:
      severity: page
    annotations:
      summary: "Instance {{ $labels.instance }} under high load"
      description: "{{ $labels.instance }} of job {{ $labels.job }} is under high load."
Alert rules (alert rules) allow us to define alert conditions based on expressions in the Prometheus expression language, and to send notifications about alert triggers to an external service. Whenever the alert expression results in one or more vector elements at a given time, the alert is considered active for the label sets of these elements.
The optional for clause forces Prometheus to wait for a certain amount of time between the first encounter with a new expression output vector element and the counting of an alert as triggered for that element.
In this case, Prometheus will check that the alert continues to be active during each evaluation for 10 minutes before triggering the alert. Items that are active, but not yet triggered, are in the pending state.
The labels clause allows you to specify a set of additional labels to attach to the alert. All existing conflicting labels will be overwritten. Label values can be modeled.
The annotations clause specifies a set of information labels that can be used to store longer additional information such as alert descriptions or runbook links. Annotation values can be modeled.
We'll add the following content to the prometheus/prometheus.yml:
# Our global configuration
global:
  scrape_interval: 15s # By default, scrapes targets every 15 seconds.
  evaluation_interval: 15s # By default, scrapes targets every 15 seconds.
  # scrape_timeout is set to the global default value (10s).

  # Attach these tags to any time series or alerts when communicating with
  # external systems (federation, remote storage, Alertmanager).
  external_labels:
    monitor: "my-project"

# Load and evaluate rules in this file every 'evaluation_interval' seconds.
rule_files:
  - "alert.rules"
  # - "first.rules"
  # - "second.rules

# alert
alerting:
  alertmanagers:
    - scheme: http
      static_configs:
        - targets:
            - "alertmanager:9093"

# A scrape configuration containing exactly one endpoint to scrape :
# Here, it's Prometheus itself.
scrape_configs:
  # The job name is added as a `job=<job_name>` tag to all time series extracted from this configuration.

  - job_name: "prometheus"

    # Overrides the default global value and retrieves this job's targets every 15 seconds.
    scrape_interval: 15s

    static_configs:
      - targets: ["localhost:9090"]

  - job_name: "cadvisor"

    # Override the default global value and retrieve targets for this job every 5 seconds.
    scrape_interval: 15s

    static_configs:
      - targets: ["cadvisor:8080"]

  - job_name: "node-exporter"

    # Override the default global value and retrieve targets for this job every 5 seconds.
    scrape_interval: 15s

    static_configs:
      - targets: ["node-exporter:9100"]
Next, we'll add our Grafana interface accesses to the grafana/config.monitoring file:
GF_SECURITY_ADMIN_PASSWORD=Datascientest2023@! # user password definition "admin"
GF_USERS_ALLOW_SIGN_UP=false # prevent users from registering
Next, we will define the data source, the one that will be used to supply logs and metrics to our Grafana server. We're going to use Prometheus. Let's add the following content to the file grafana/provisioning/datasources/datasource.yml:
# configuration file version
apiVersion: 1

# list of data sources to be deleted from the database
deleteDatasources:
  - name: Prometheus
    orgId: 1

# list of data sources to be inserted/updated according to what's available in the database
datasources:
  # <string, required> data source name. Required
  - name: Prometheus
    # <string, required> type of data source. Required
    type: prometheus
    # <string, required> Access mode. direct or proxy. Required
    access: proxy
    # <int> organization identifier. will default to orgId 1 if not specified
    orgId: 1
    # <string> url to use, pointing to prometheus with the service name defined in the docker-compose.yml file
    url: http://prometheus:9090
    # <string> database password, if used
    password:
    # <string> database user, if used
    user:
    # <string> database name, if used
    database:
    # <bool> enable/disable database authentication
    basicAuth: false
    # <string> basic authentication username, if used
    basicAuthUser:
    # <string>basic authentication password, if used
    basicAuthPassword:
    # <bool> enable/disable with credentials headers
    withCredentials:
    # <bool> mark as default data source. One maximum per organization
    isDefault: true
    # <map> fields to be converted to json and stored in json_data
    jsonData:
      graphiteVersion: "1.1"
      tlsAuth: false
      tlsAuthWithCACert: false
    # string> json object for data to be encrypted.
    secureJsonData:
      tlsCACert: "..."
      tlsClientCert: "..."
      tlsClientKey: "..."
    version: 1
    # <bool> allow users to edit data sources from the user interface.
    editable: true
Next, we're going to create a dashboard that will retrieve all the metrics related to the docker environment and the containers deployed in it.
In the grafana/provisioning/dashboards/ file, we can download the dashboard file:
wget https://dst-de.s3.eu-west-3.amazonaws.com/prometheus_devops_fr/scripts/Docker_Prometheus_Monitoring.json
We have a file that will create an array called Datascientest Docker Monitoring with all the elements we needed for monitoring our docker instance, and even alerts. We'll talk about this once our deployment is complete.
We'll then create a dashboard that will retrieve all metrics related to Prometheus and the system in general. In the grafana/provisioning/dashboards/ file, we can download the dashboard files:
wget https://dst-de.s3.eu-west-3.amazonaws.com/prometheus_devops_fr/scripts/System_Monitoring.json
wget https://dst-de.s3.eu-west-3.amazonaws.com/prometheus_devops_fr/scripts/Datascientest_System_Monitor.json
We'll also add the following content to the grafana/provisioning/dashboards/dashboard.yml file to specify the location of our various dashboard Json files to be loaded by Grafana:
apiVersion: 1

providers:
  - name: "Prometheus"
    orgId: 1
    folder: ""
    type: file
    disableDeletion: false
    editable: true
    options:
      path: /etc/grafana/provisioning/dashboards
Let's add the following content to the alertmanager/config.yml file to define the way to notify when alerts are triggered by the system:
route:
  receiver: "slack"

receivers:
  - name: "slack"
# slack_configs:
# - send_resolved: true
# username: '<username>'
# channel: '#<channel-name>'
# api_url: '<incomming-webhook-url>'
Once we have the contents of our various files, we can run our stack:
docker-compose up -d
Output display:
Creating network "prometheus_back-tier" with the default driver
Creating network "prometheus_front-tier" with the default driver
Creating prometheus_node-exporter_1... done
Creating prometheus_cadvisor_1 ... done
Creating prometheus_alertmanager_1 ... done
Creating prometheus_prometheus_1 ... done
Creating prometheus_grafana_1 ... done
We can now check that all containers are in the Up state:
docker ps
Output display:
CONTAINER ID IMAGE COMMAND CREATED STATUS PORTS NAMES
81d2d7912ed0 grafana/grafana "/run.sh" 36 seconds ago Up 34 seconds 0.0.0.0:3000->3000/tcp, :::3000->3000/tcp prometheus_grafana_1
a3141b546dae prom/prometheus:v2.36.2 "/bin/prometheus --c..."   37 seconds ago Up 35 seconds 0.0.0.0:9090->9090/tcp, :::9090->9090/tcp prometheus_prometheus_1
3bdc682ab0b0 gcr.io/cadvisor/cadvisor "/usr/bin/cadvisor -..."   38 seconds ago Up 36 seconds (healthy) 0.0.0.0:8080->8080/tcp, :::8080->8080/tcp prometheus_cadvisor_1
5b374db53d9d prom/alertmanager "/bin/alertmanager -..."   38 seconds ago Up 36 seconds 0.0.0.0:9093->9093/tcp, :::9093->9093/tcp prometheus_alertmanager_1
1976a114526b quay.io/prometheus/node-exporter:latest "/bin/node_exporter ..."   38 seconds ago Up 36 seconds 0.0.0.0:9110->9100/tcp, :::9110->9100/tcp prometheus_node-exporter_1
We see that all containers are running successfully, we can now connect to our Grafana instance via port 3000 on our host as this is the port used for port mapping externally on our server:
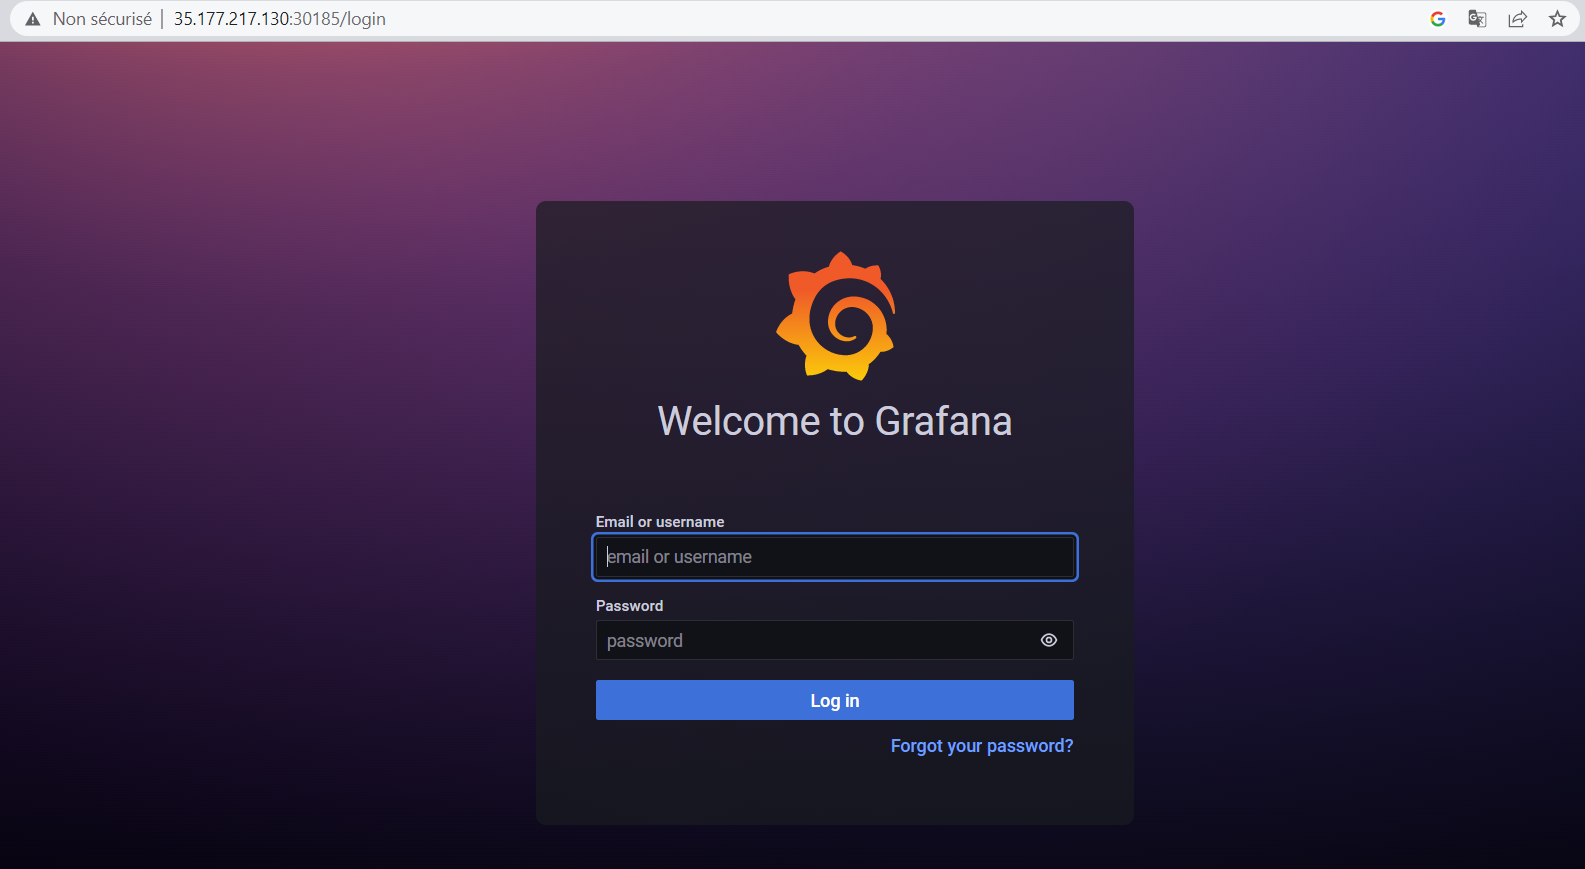
We can connect with the information filled in the grafana/config.monitoring:
cat grafana/config.monitoring
Output display:
GF_SECURITY_ADMIN_PASSWORD=Datascientest2023@! # user password definition "admin"
GF_USERS_ALLOW_SIGN_UP=false # prevent users from registering
The username is admin and the password is Datascientest2023@!. Let's now connect to our instance:
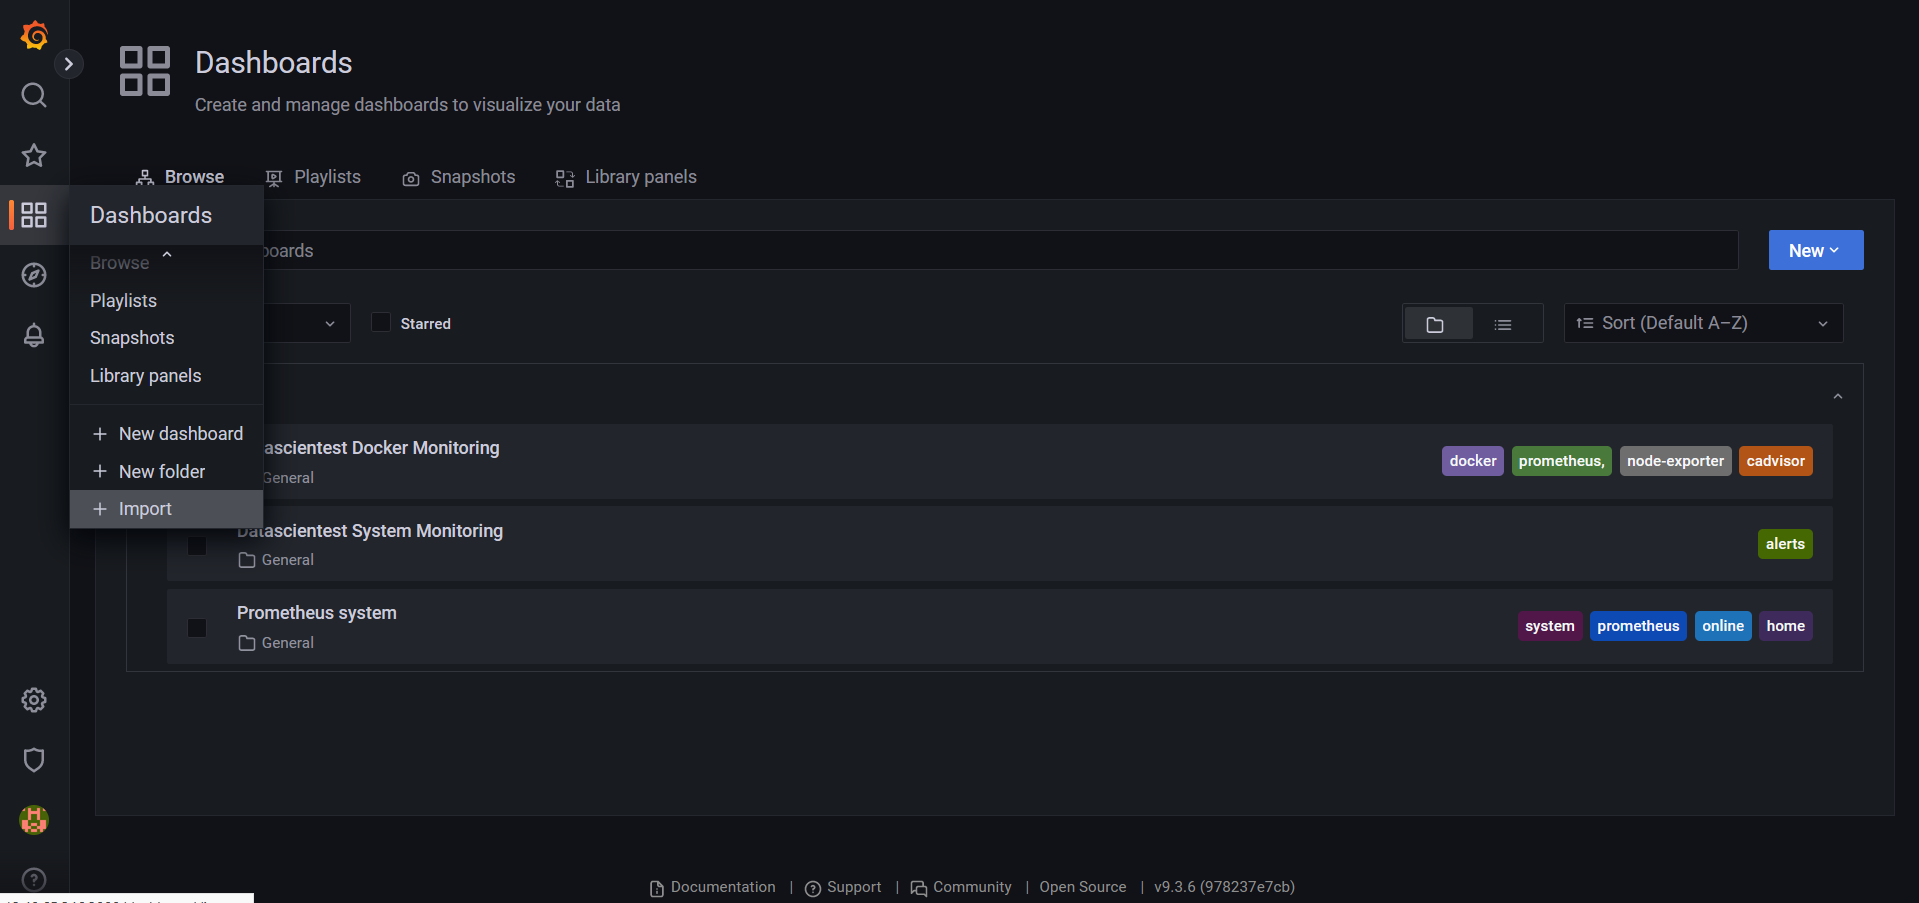
On the left-hand menu , we can click on dashboard ![]() , and on the
, and on the browse button to see the list of dashboards created with the supplied Json files.
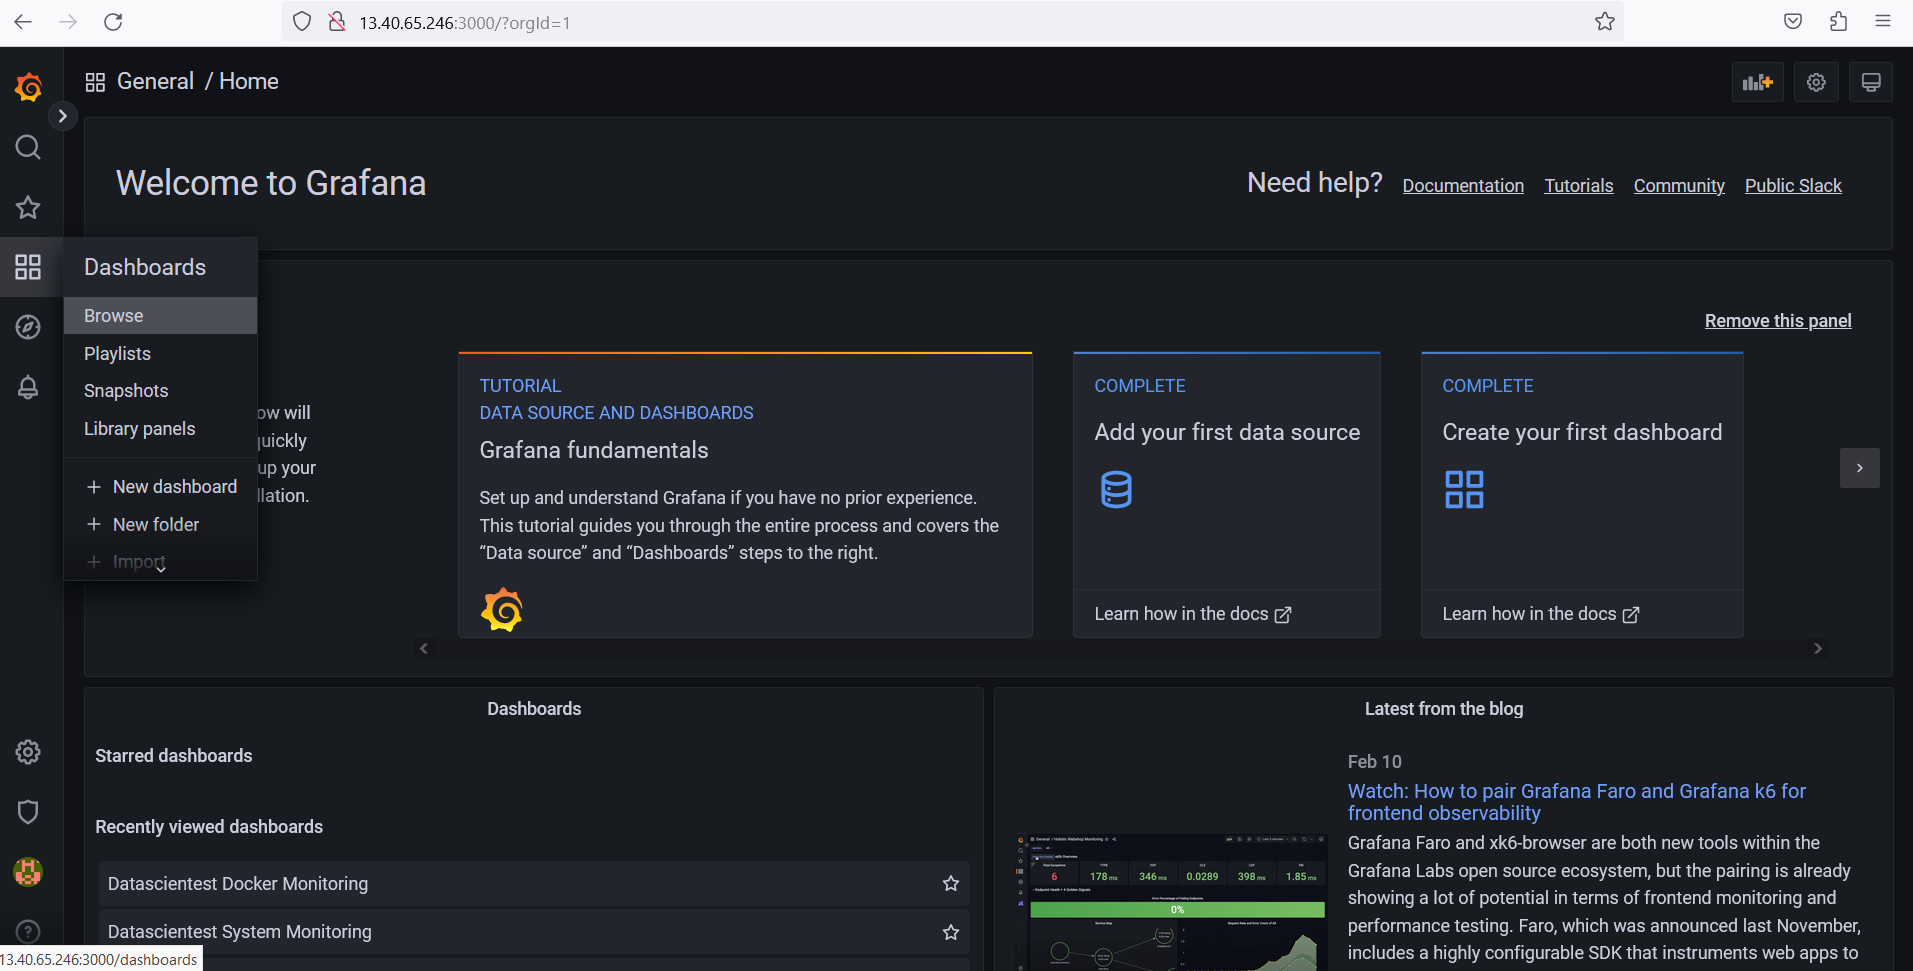
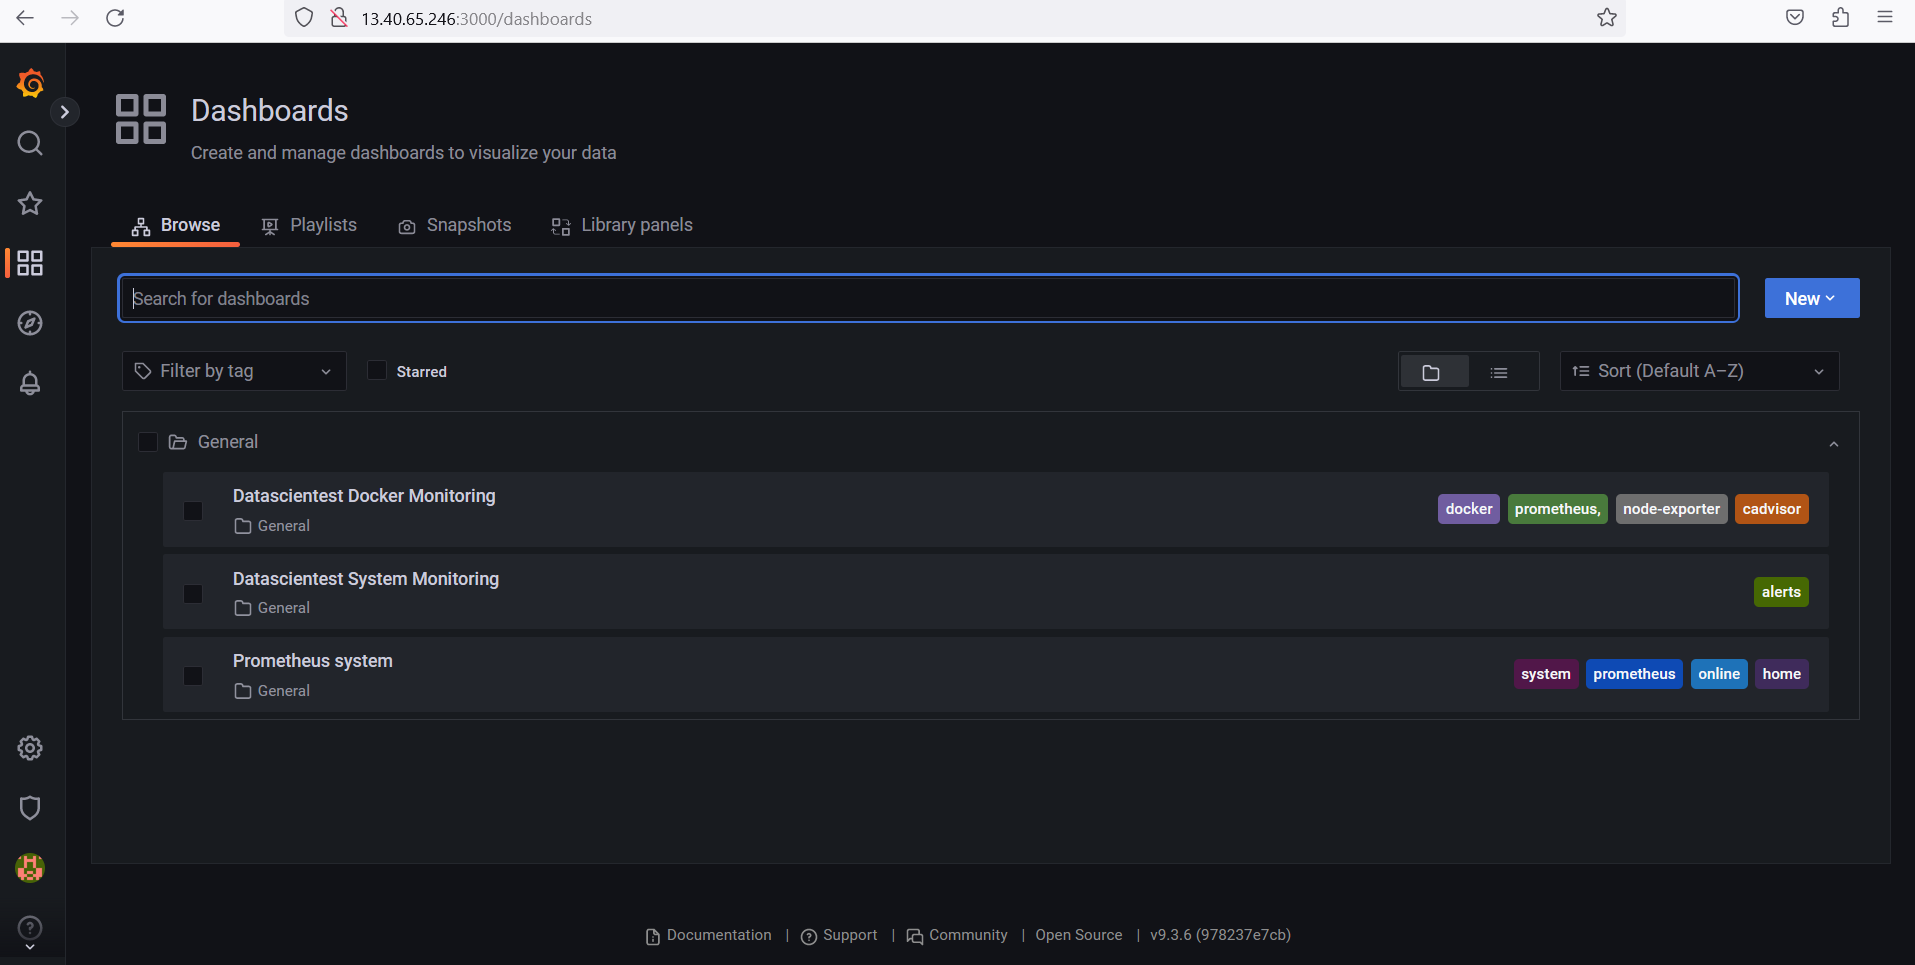
We can see the 03 dashboards present:
Datascientest Docker Monitoring
Datascientest System Monitoring
Prometheus system
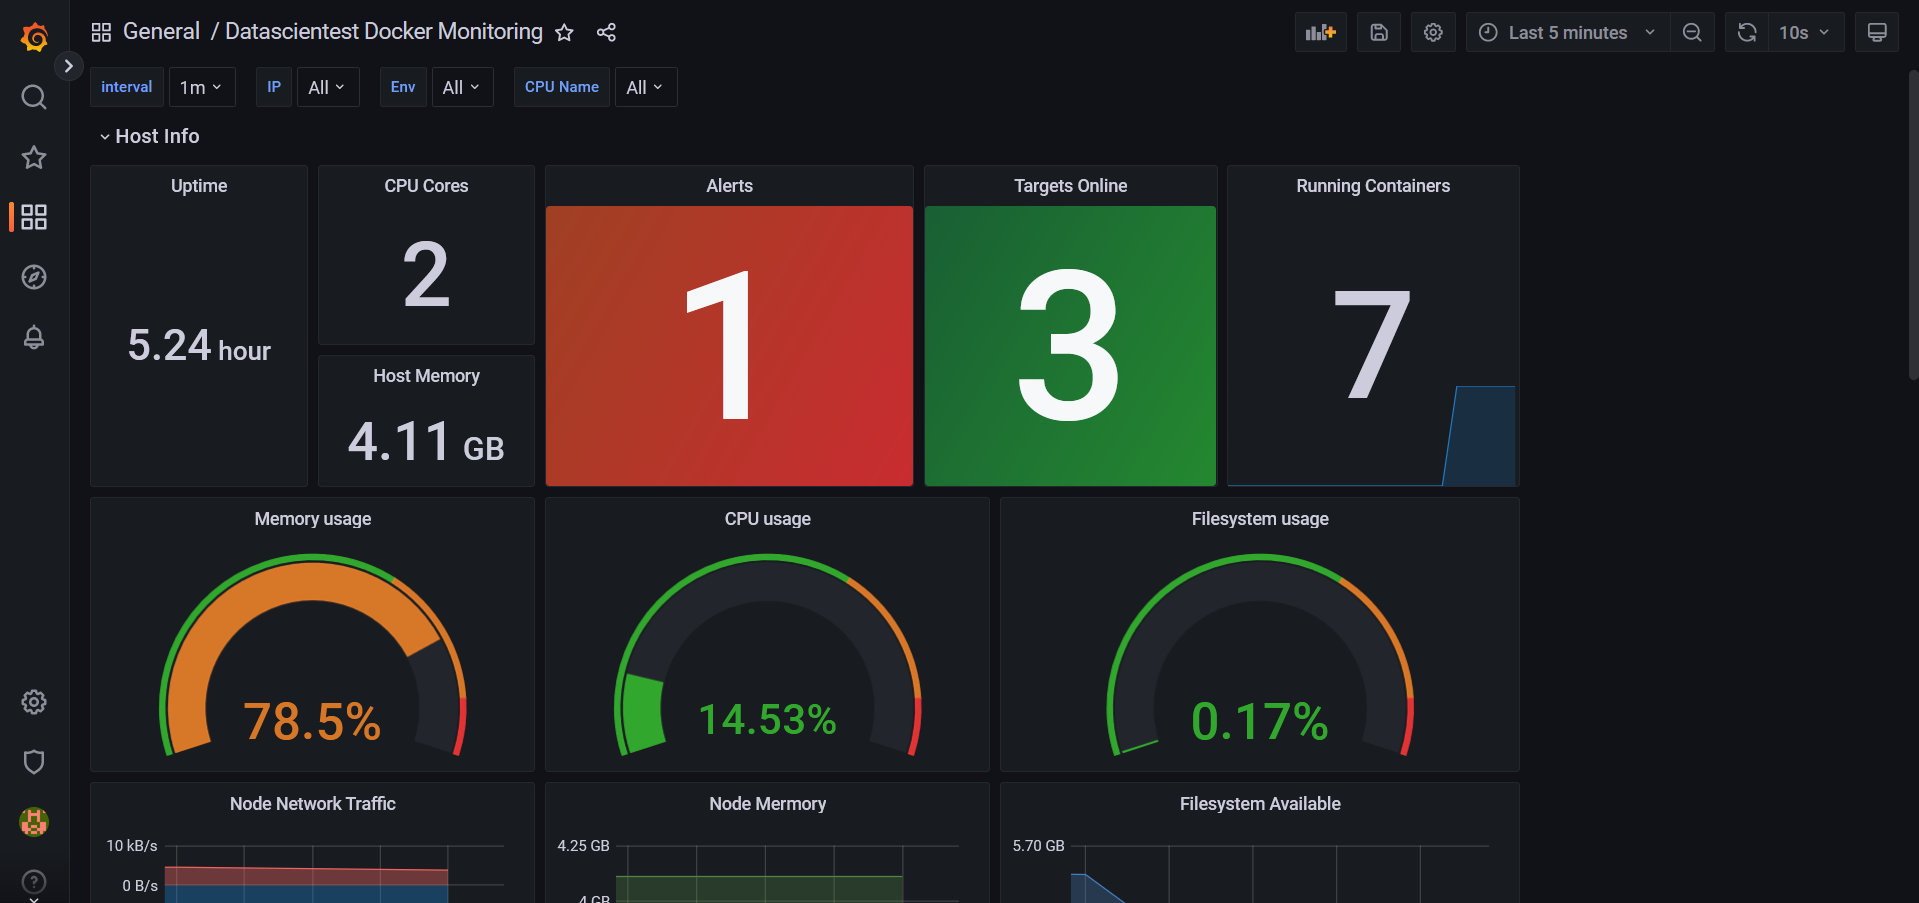
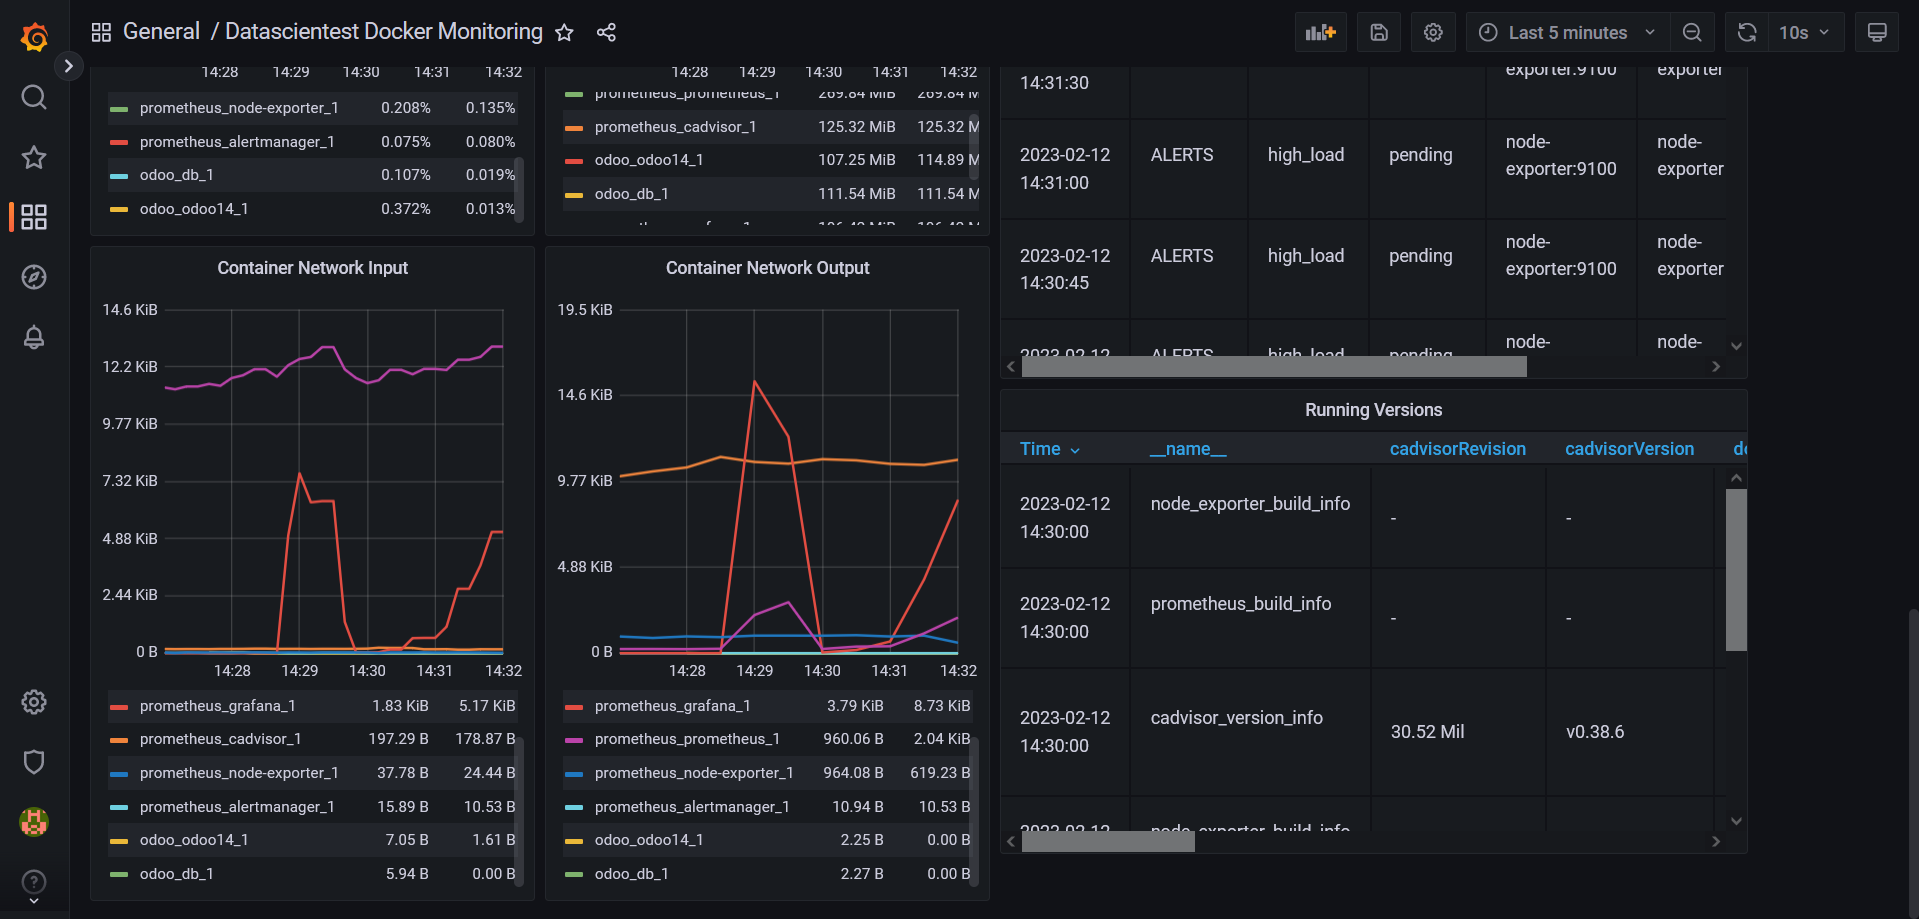
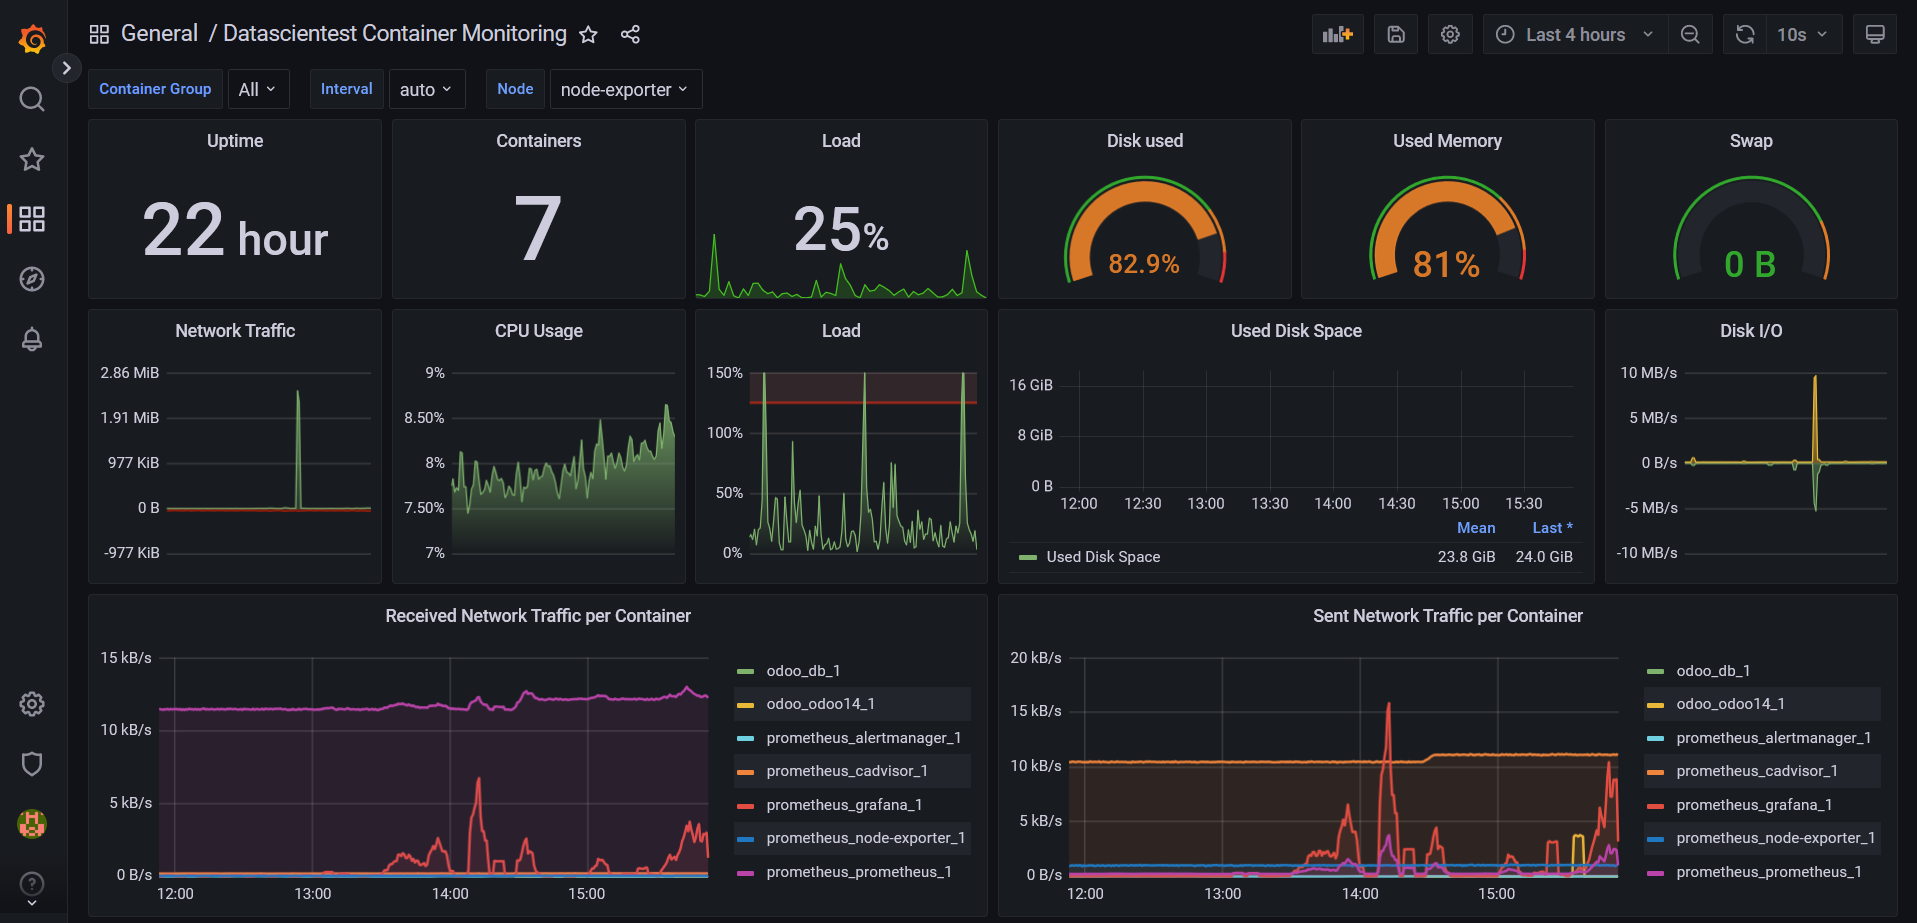
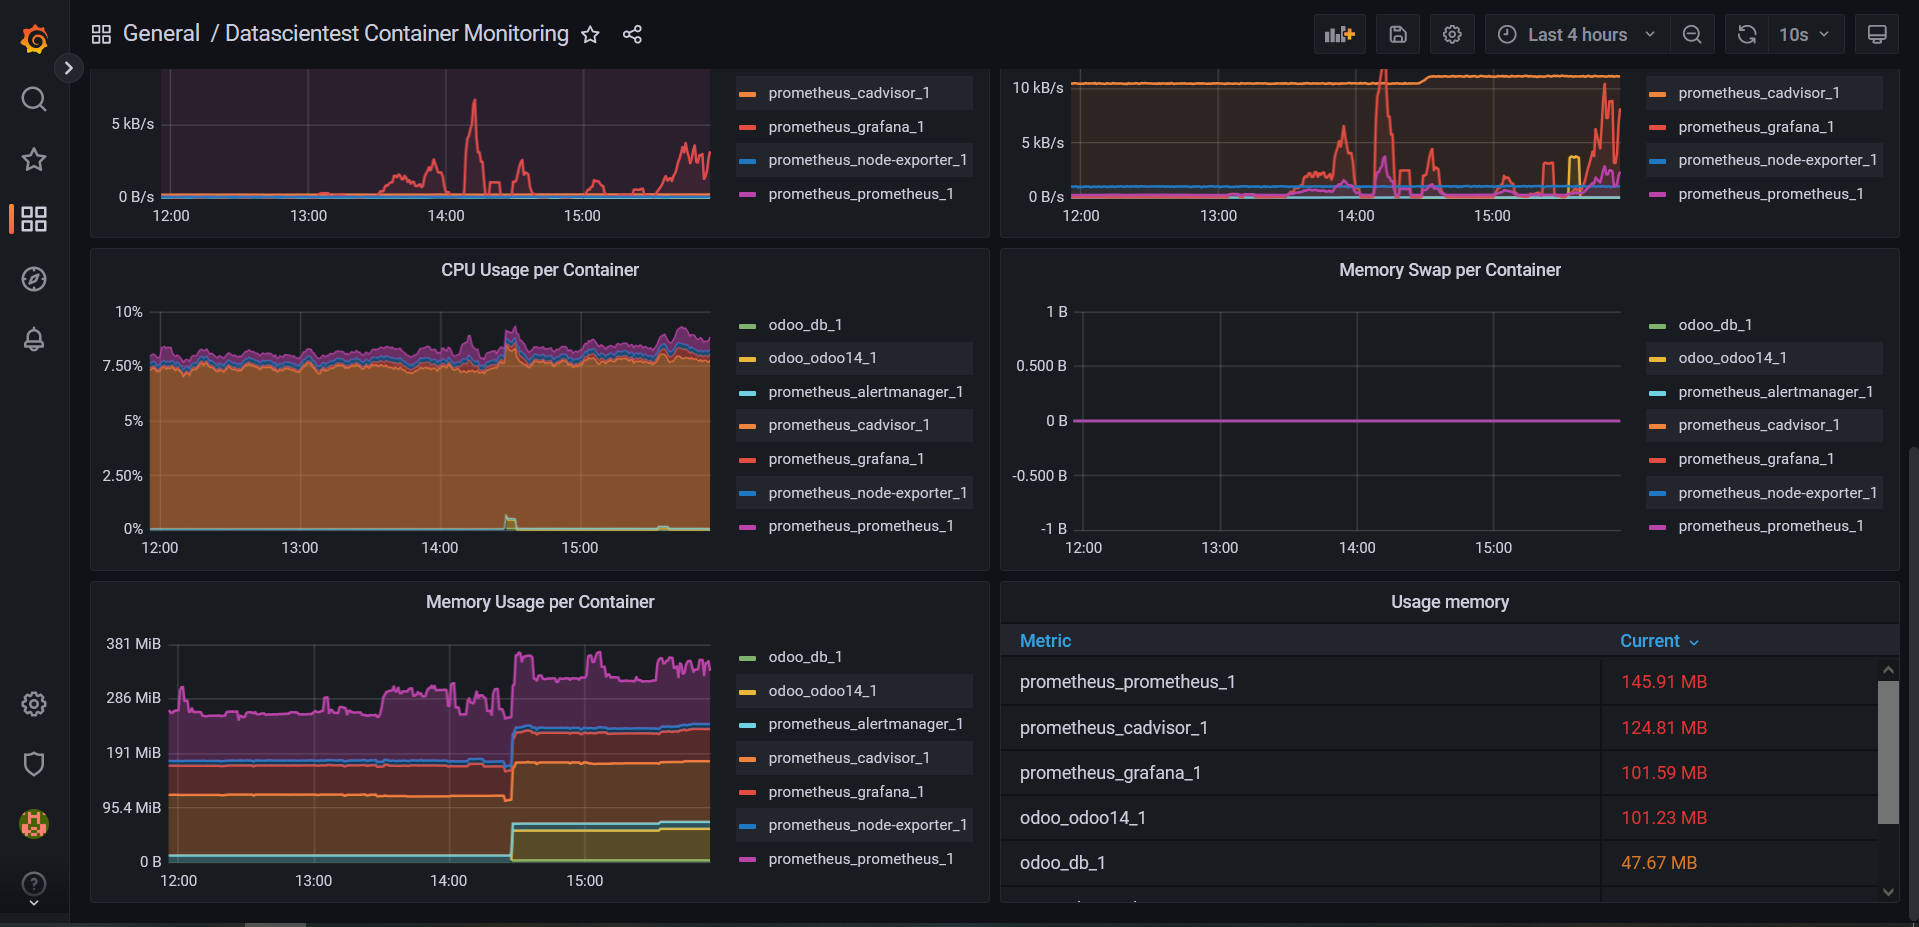
We can click on the first dashboard Datascientest Docker Monitoring to see it:
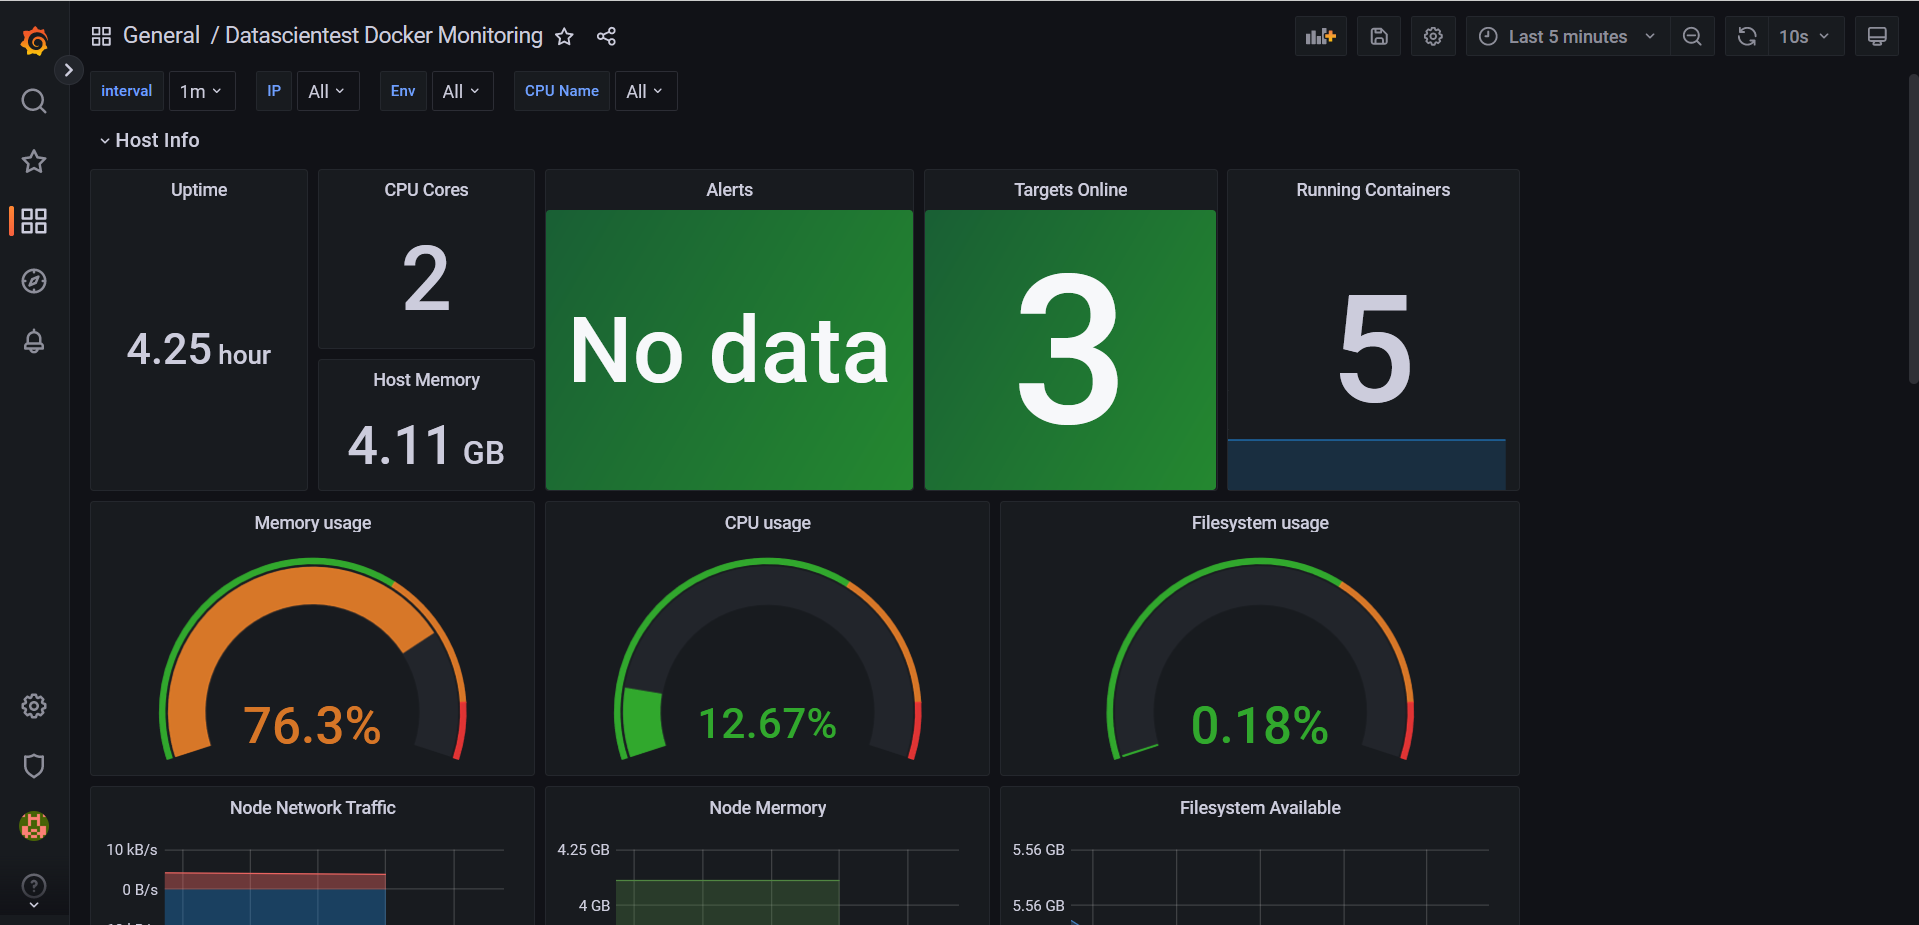
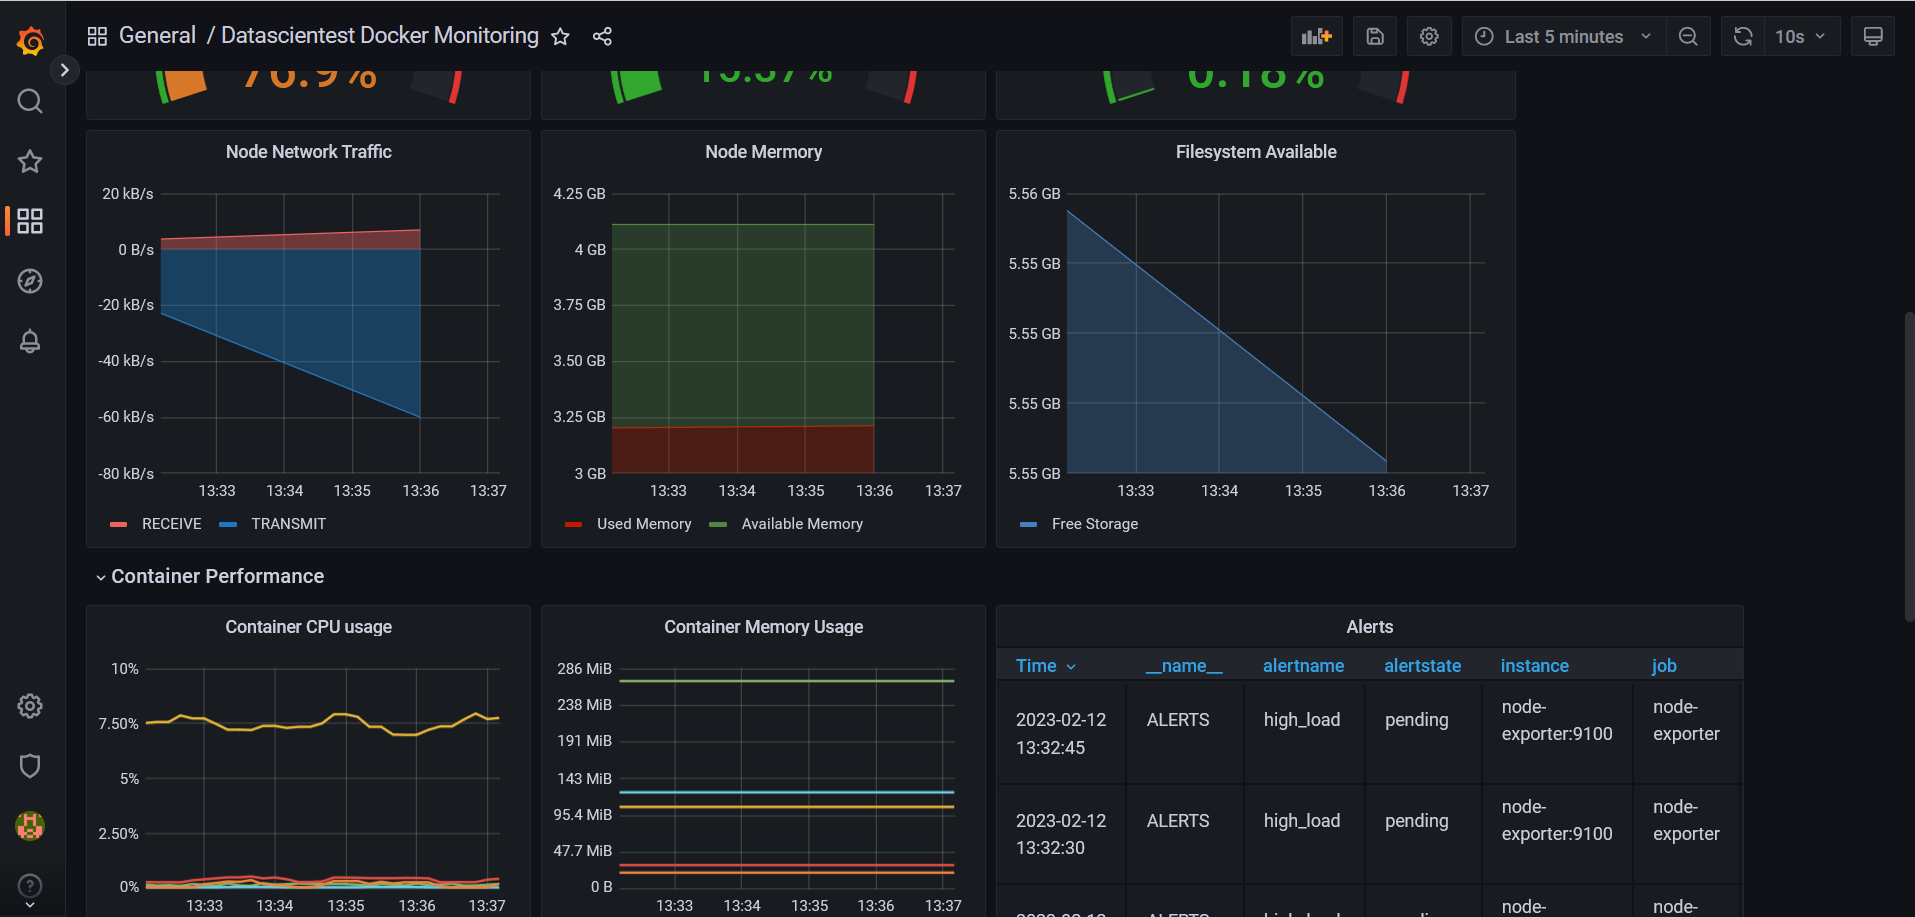
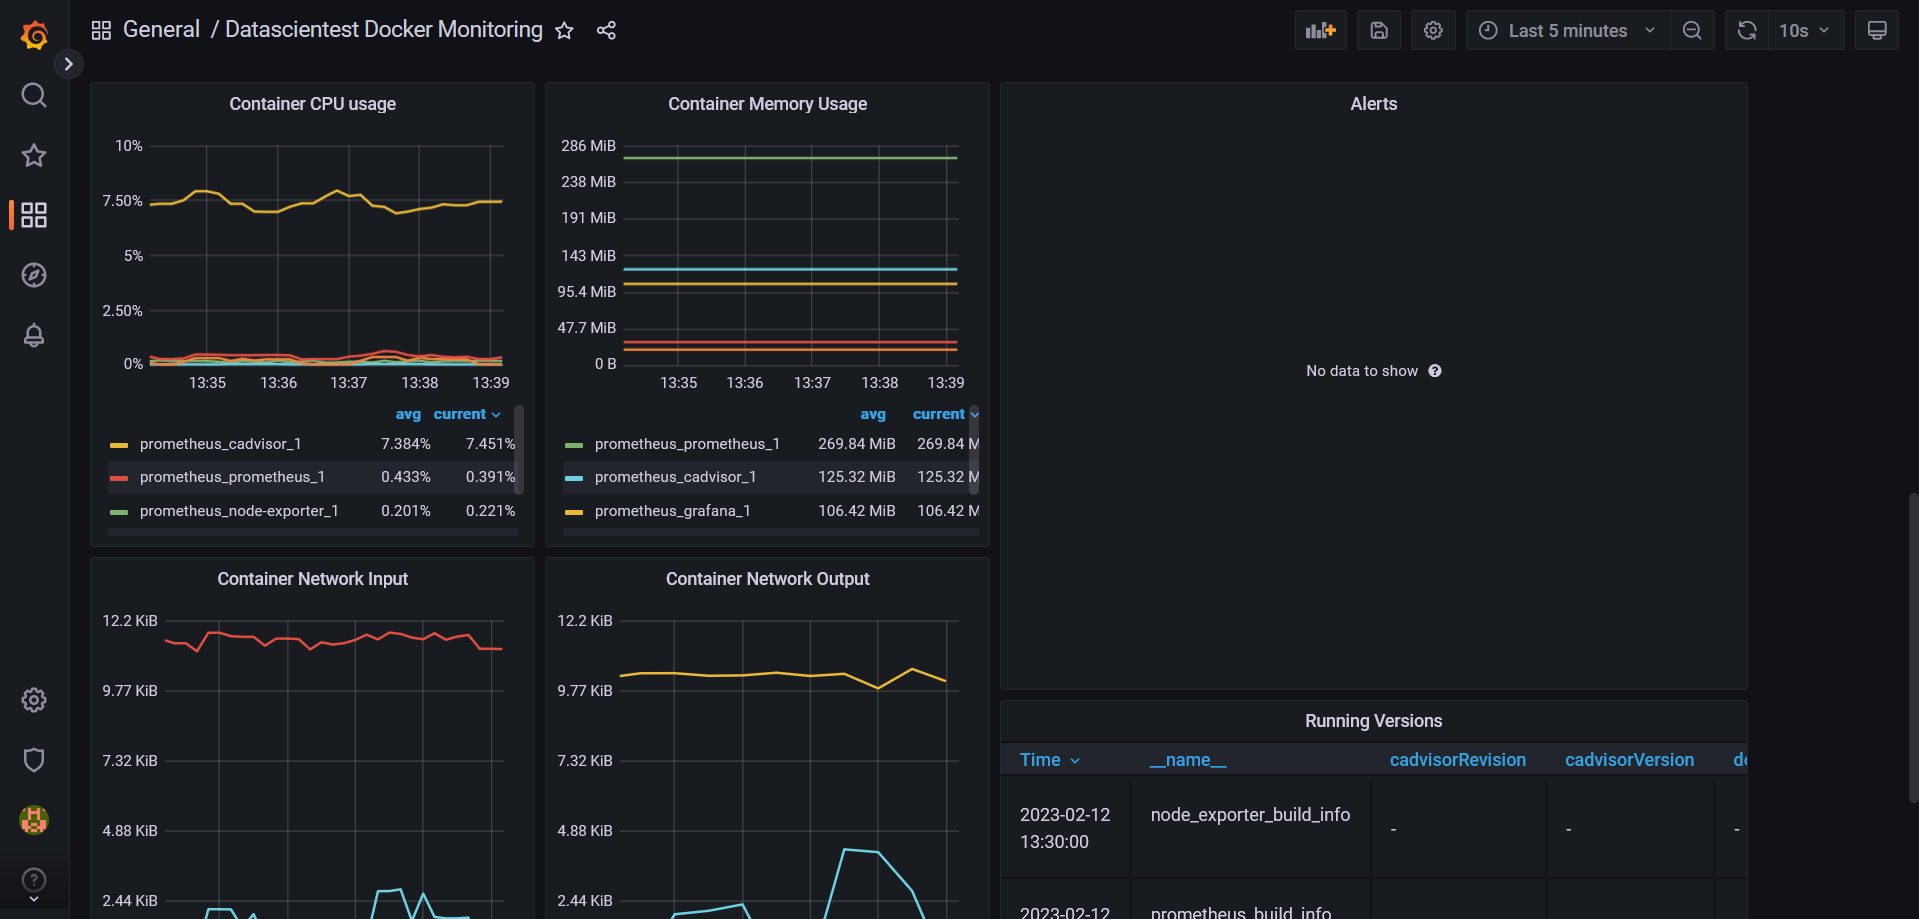
We can list the tiles, panels and graphics used in this table:
Number of server CPUs.
Number of RAM available.
The number of containers in
Upstate.The use of the server's file system.
Network traffic.
The CPU and RAM consumption for each container
Alerts, etc.
We can also return to the Datascientest System Monitoring dashboard to see:
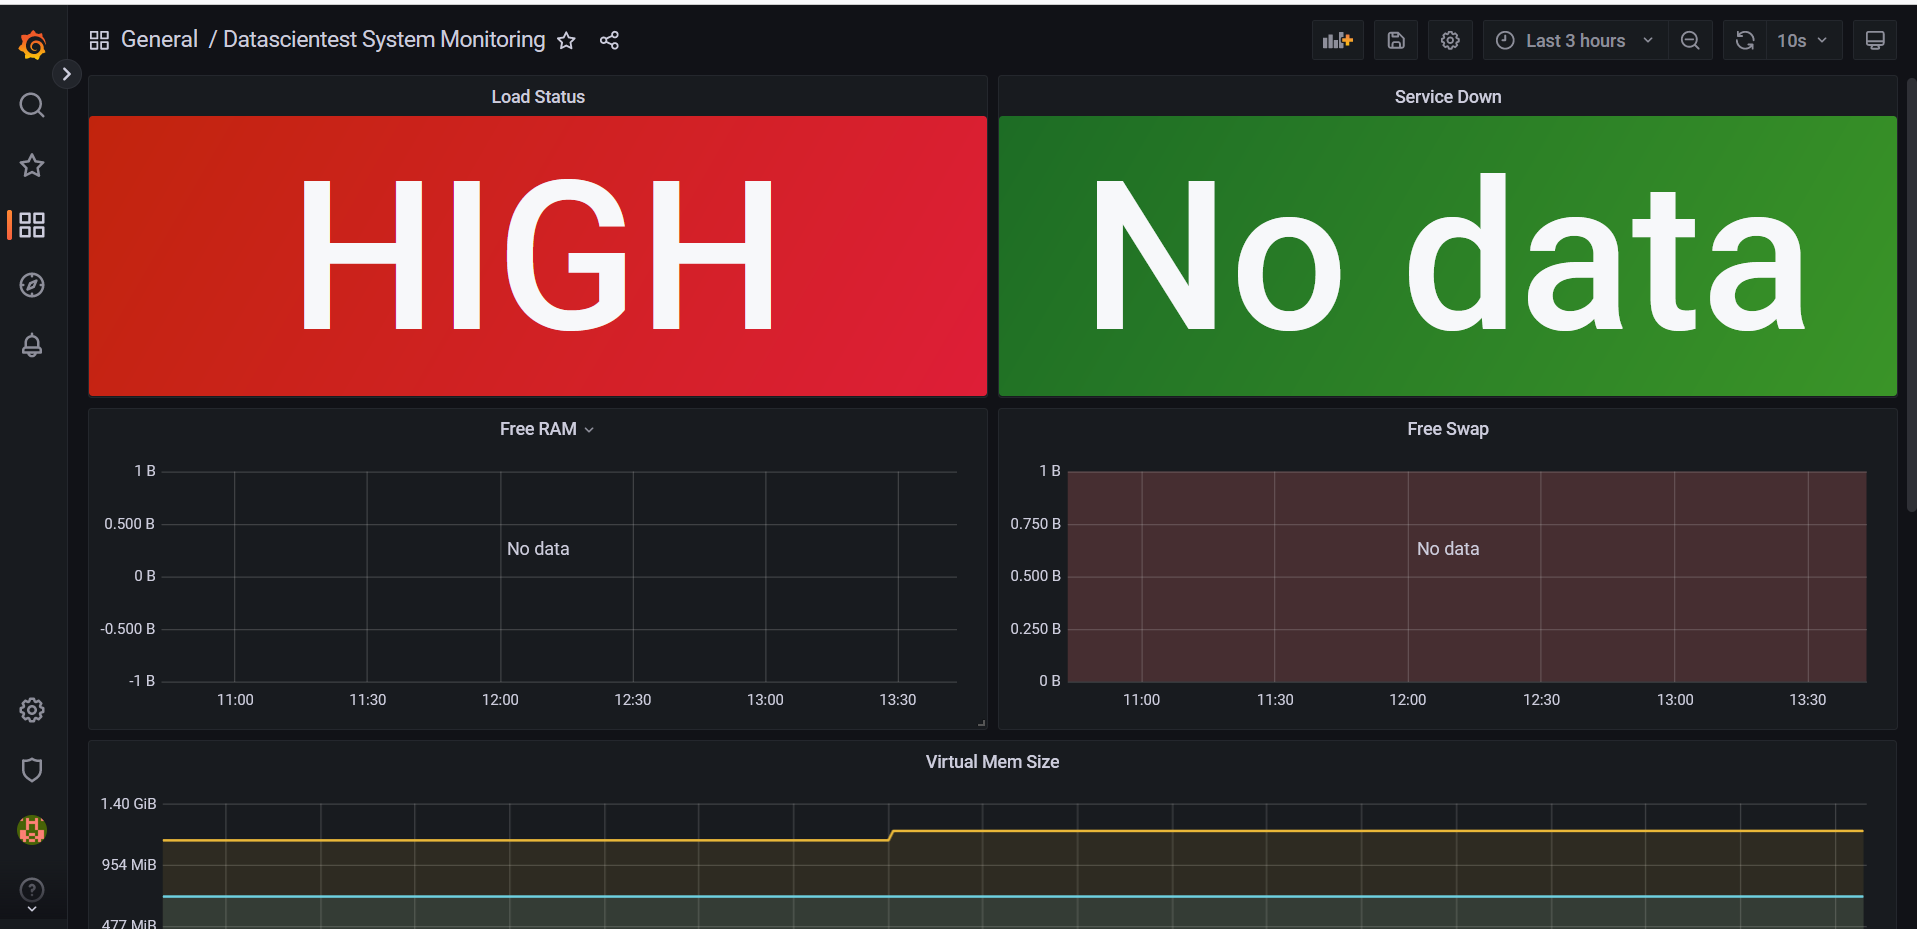
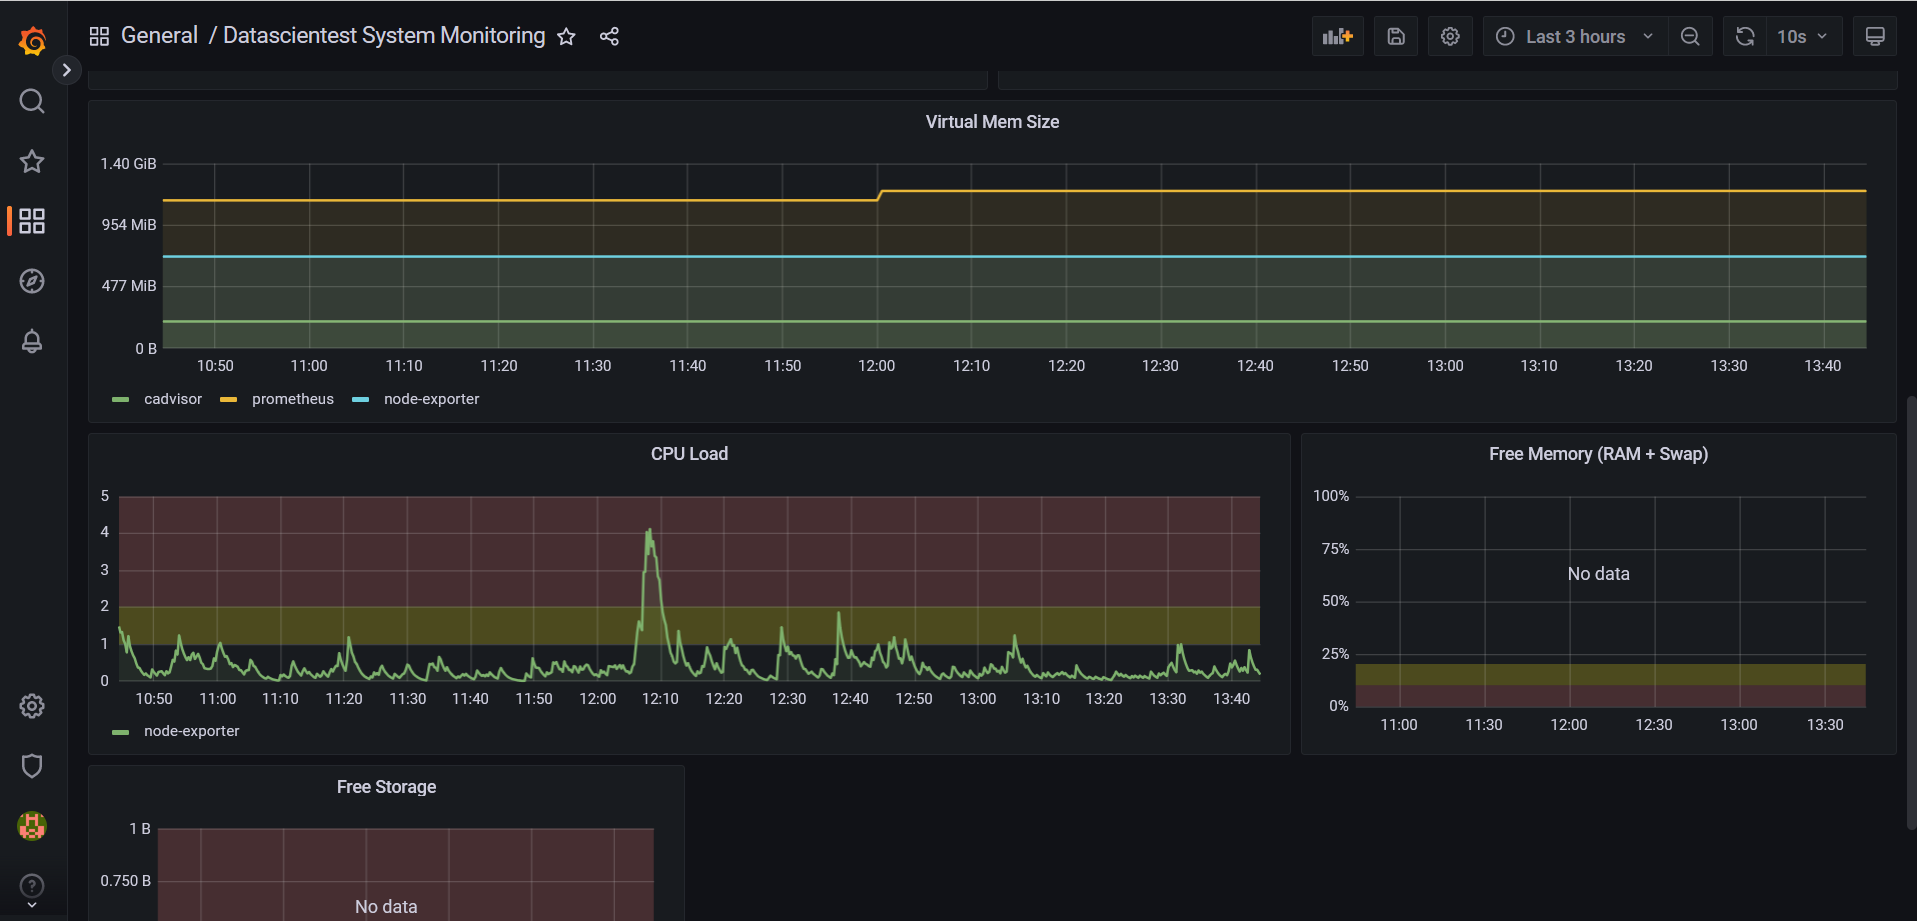
We can list the tiles, panels and graphics used in this table:
Status of the load on the server.
Services that are not Ok.
Free RAM.
Free SWAP.
Free storage.
Virtual memory size, etc.
Let's also click on the last dashboard called Prometheus system:
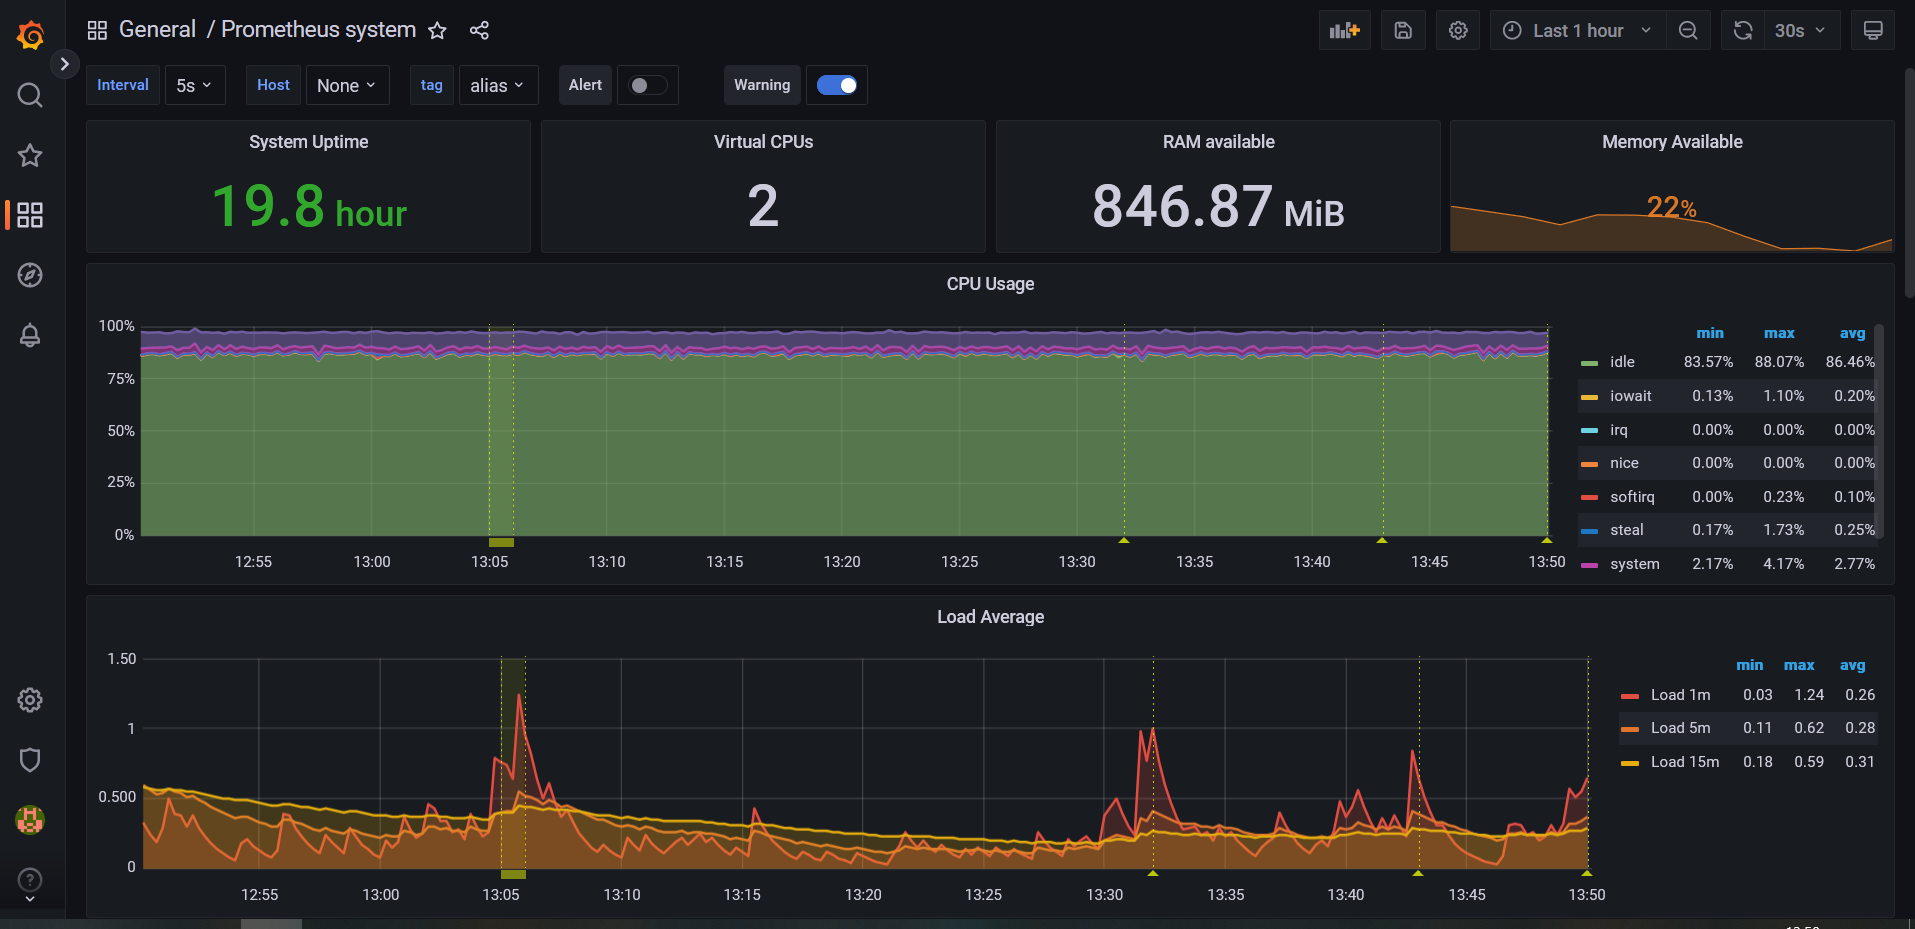
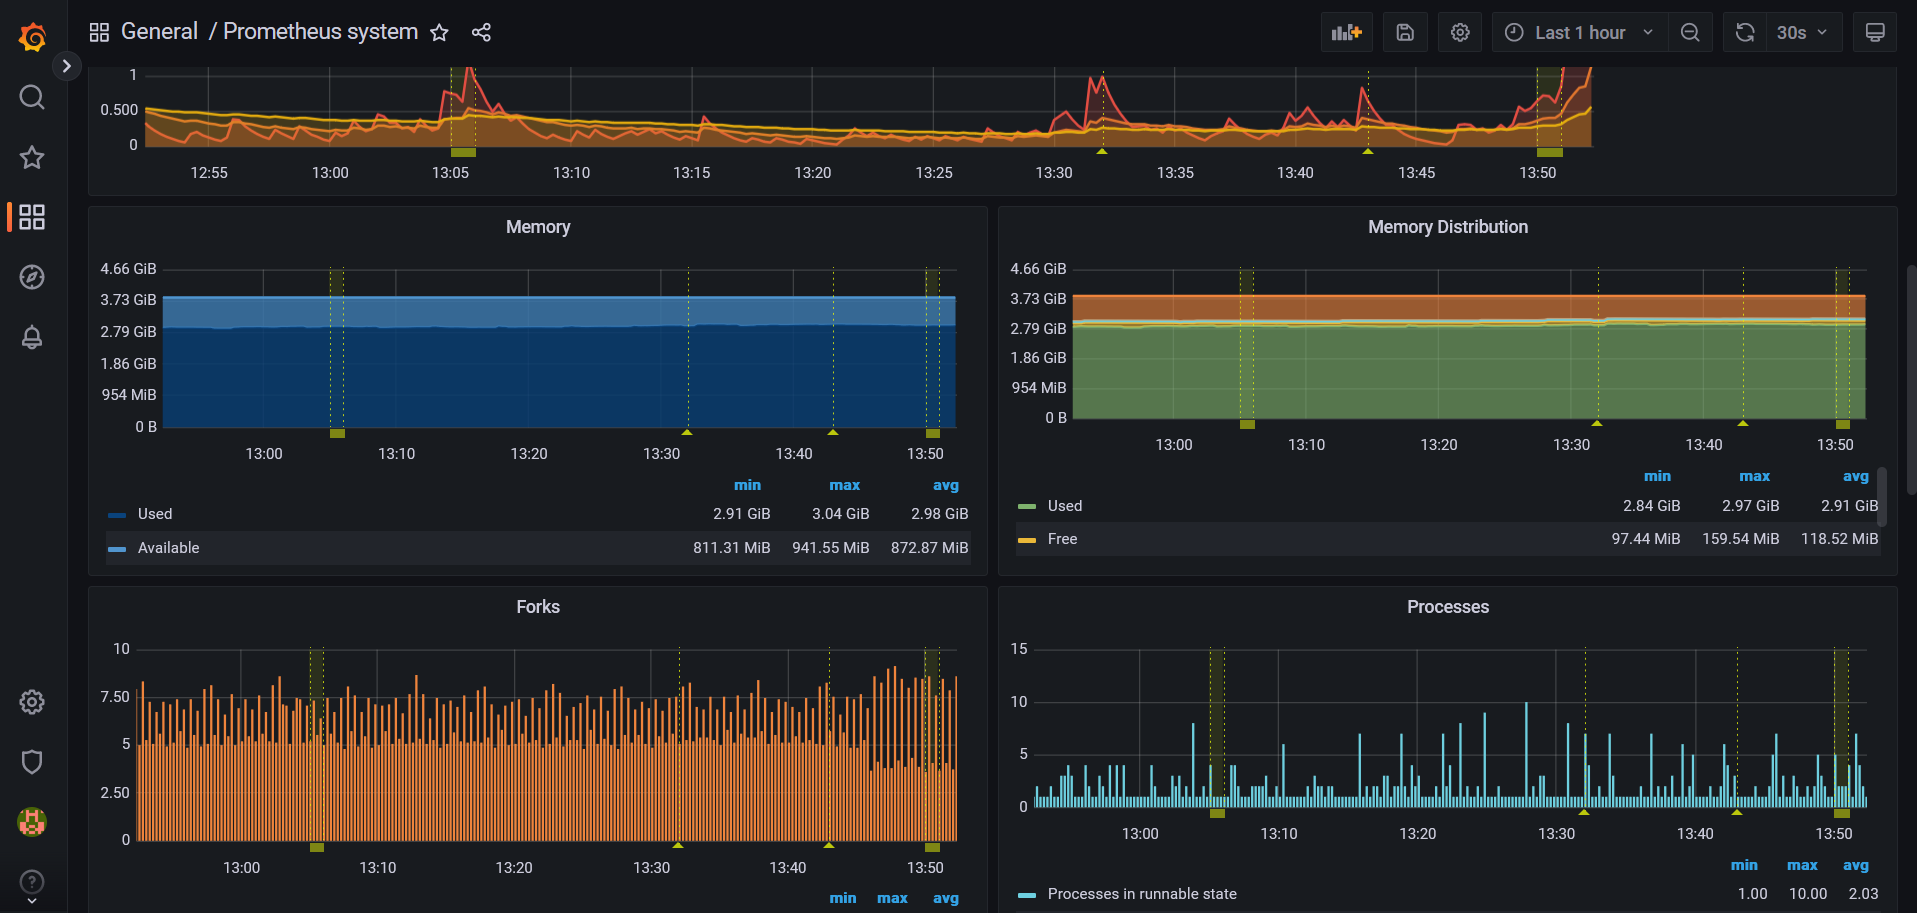
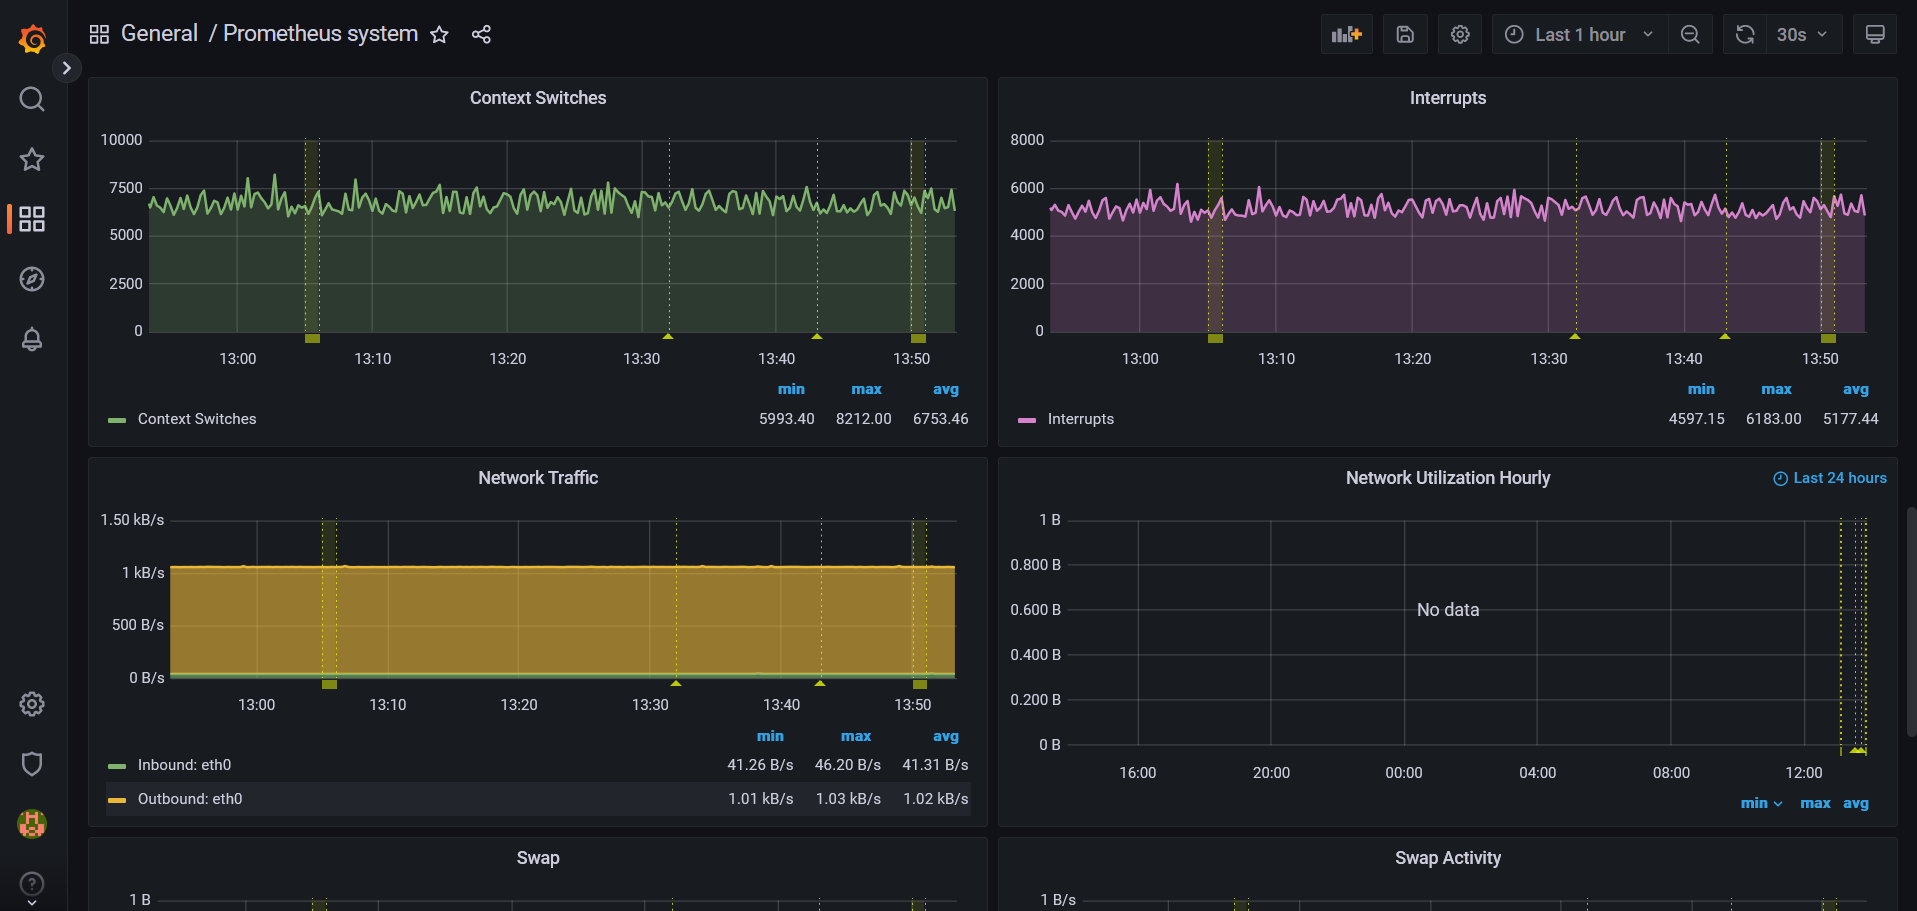
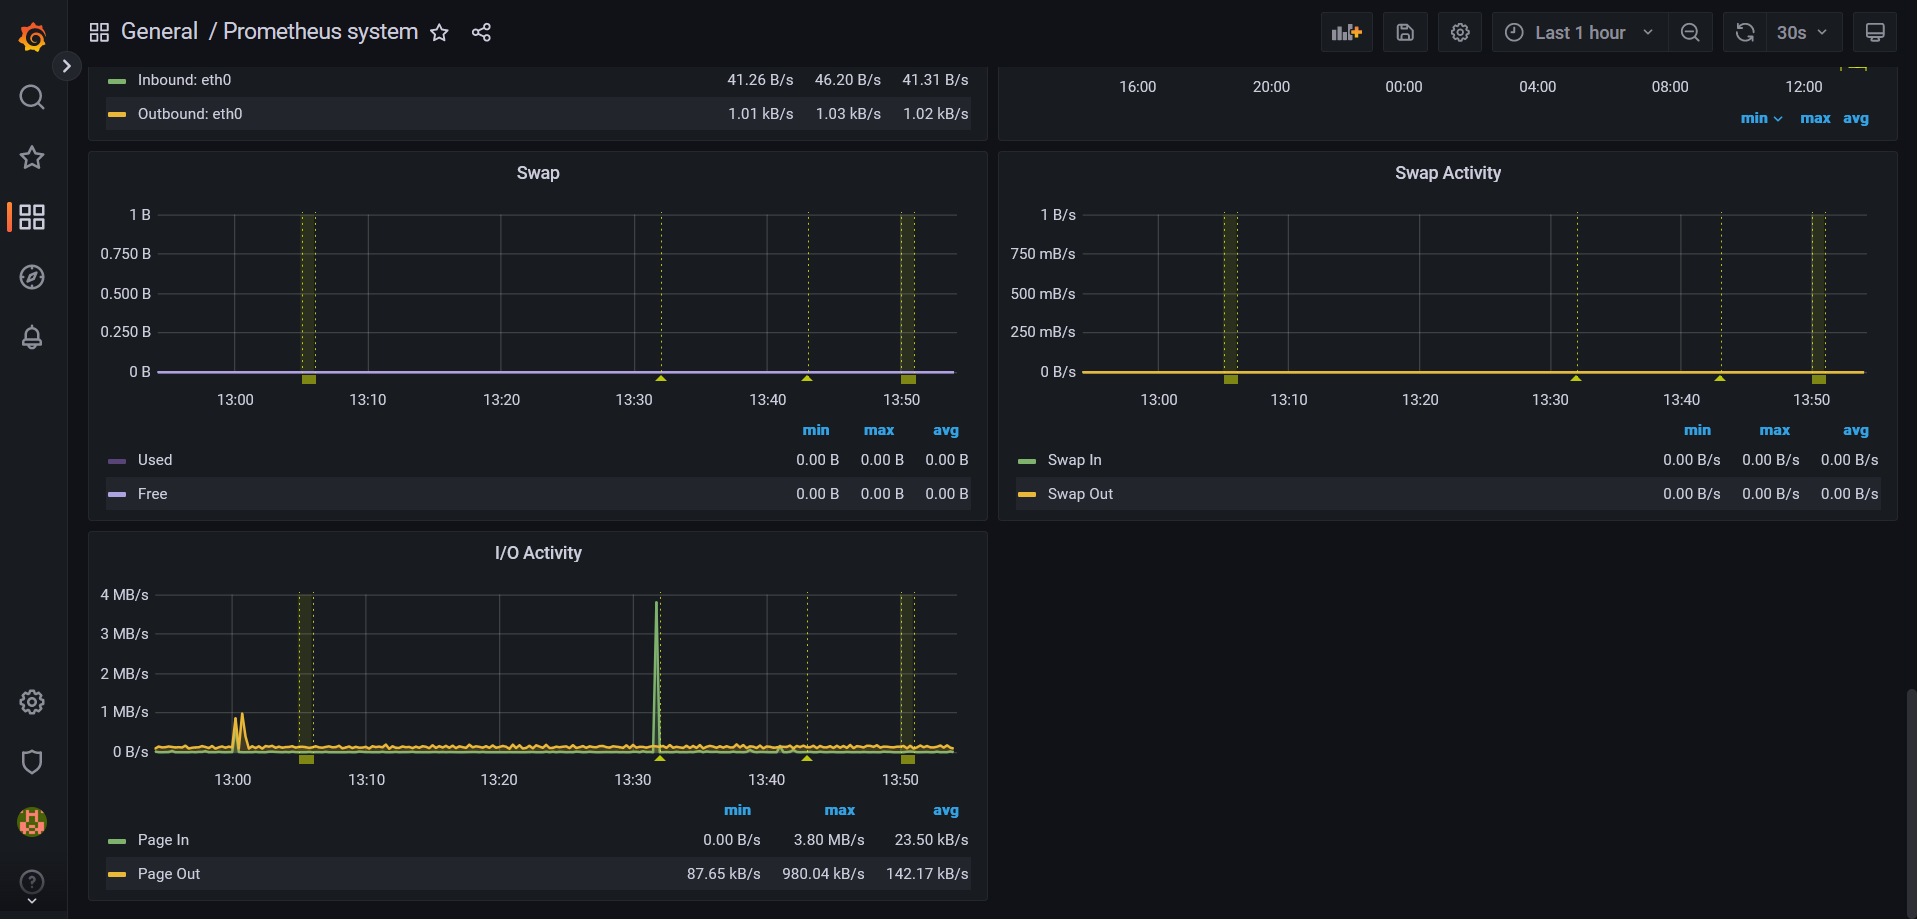
Some tiles, panels and graphics used in this table:
The
Uptimewhich shows how long the server has been running.The number of CPUs.
Available RAM.
The load on the server every 5 minutes.
The server's CPU consumption every 5 minutes, etc.
Situational setting:
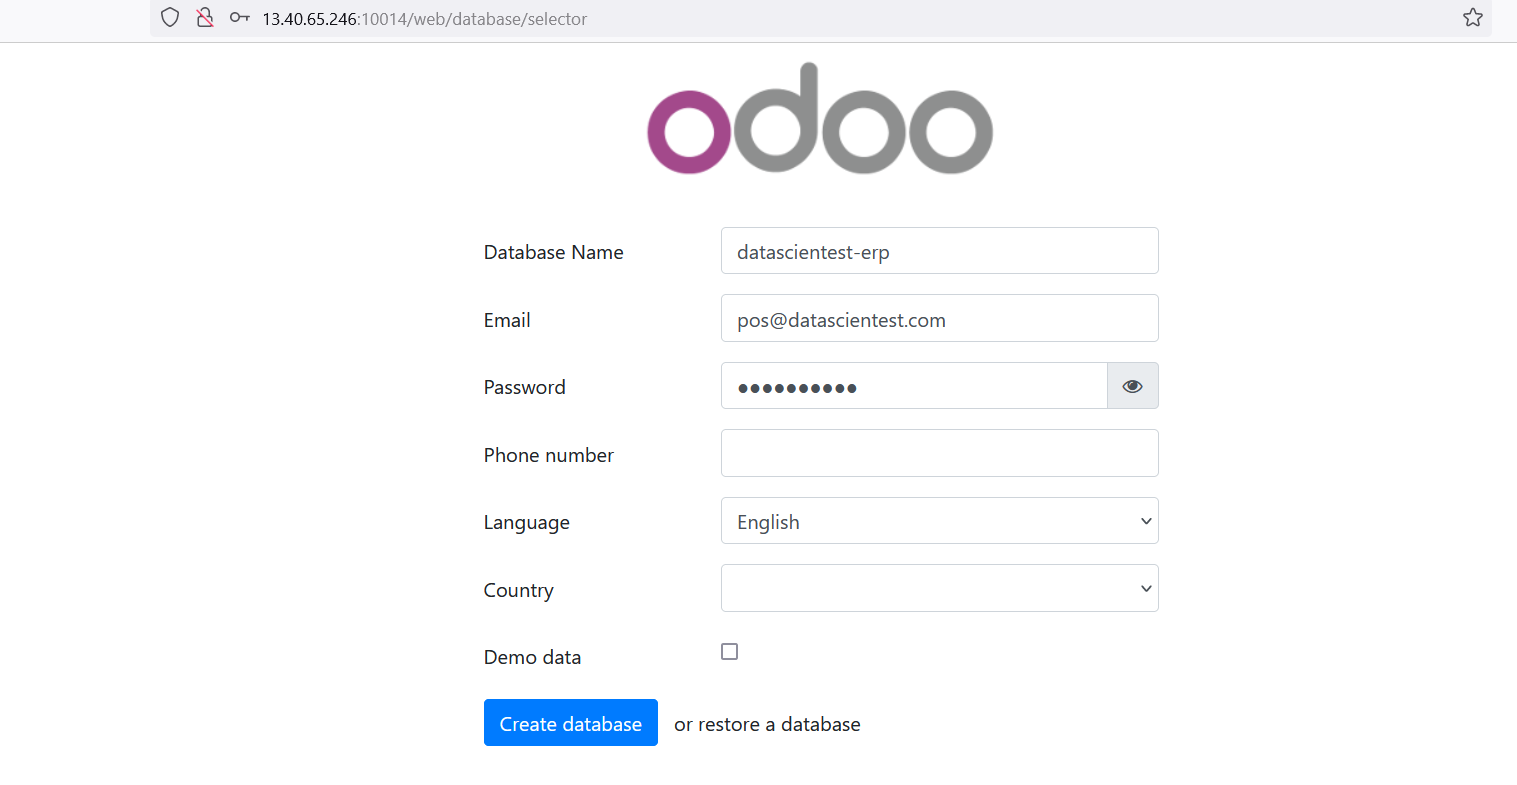
You will have to deploy Odoo which is a **ERP** in order to manage the various points of sale that enable the sale of a new software solution implemented by your company's developer teams.
You can deploy Odoo using
docker-compose, the images to use can be found at [https://hub.docker.com/_/odoo].You can specify the email
pos@datascientest.comand password of your choice on your Odoo instance.You'll name your database
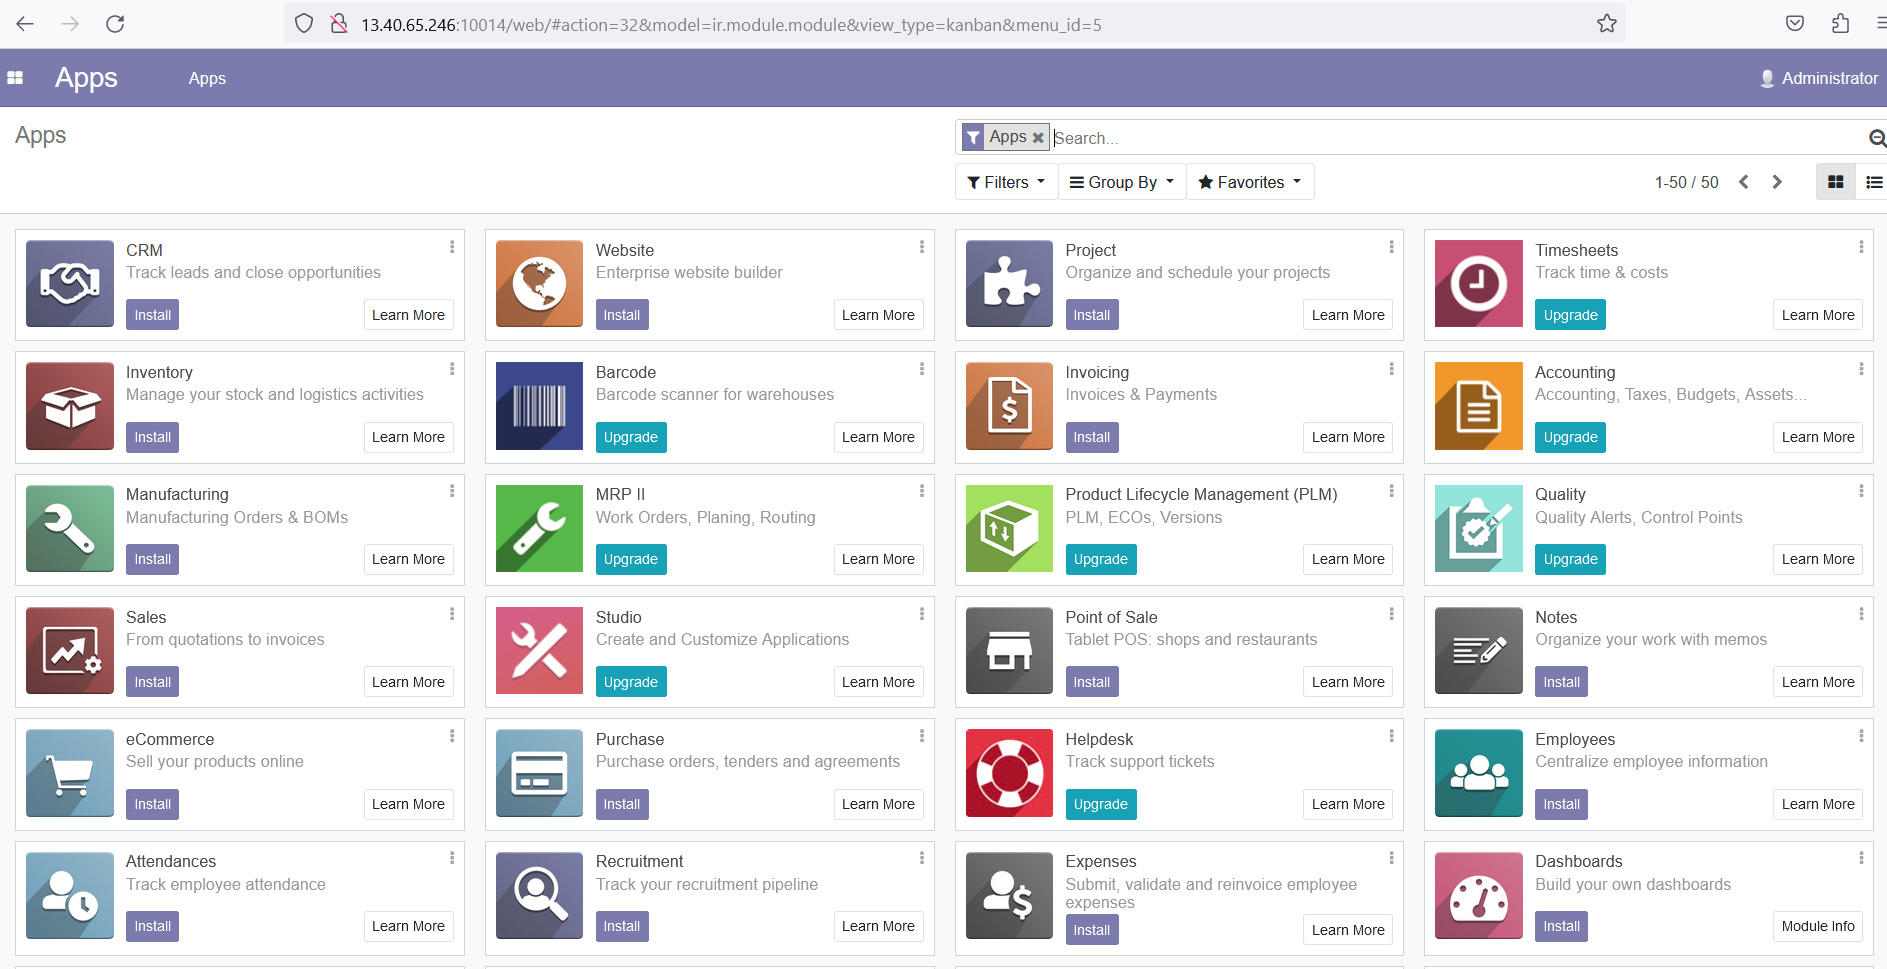
datascientest-erp. As language, you will chooseEnglish. Make sure you arrive at the module installation page.Once finished, you'll need to check that the metrics from the new containers are being retrieved by the dashboards.
b - Create a new dashboard
Dashboards can be created from the Grafana dashboard The ID of a dashboard created by the Grafana community or team at [https://grafana.com/grafana/dashboards/].
We're going to add a new dashboard that allows us to supervise operations on the containers on our server, we'll go to the following address to retrieve the ID of this dashboard at address [https://grafana.com/grafana/dashboards/16310-docker-and-system-monitoring/] which we'll use to create our dashboard:
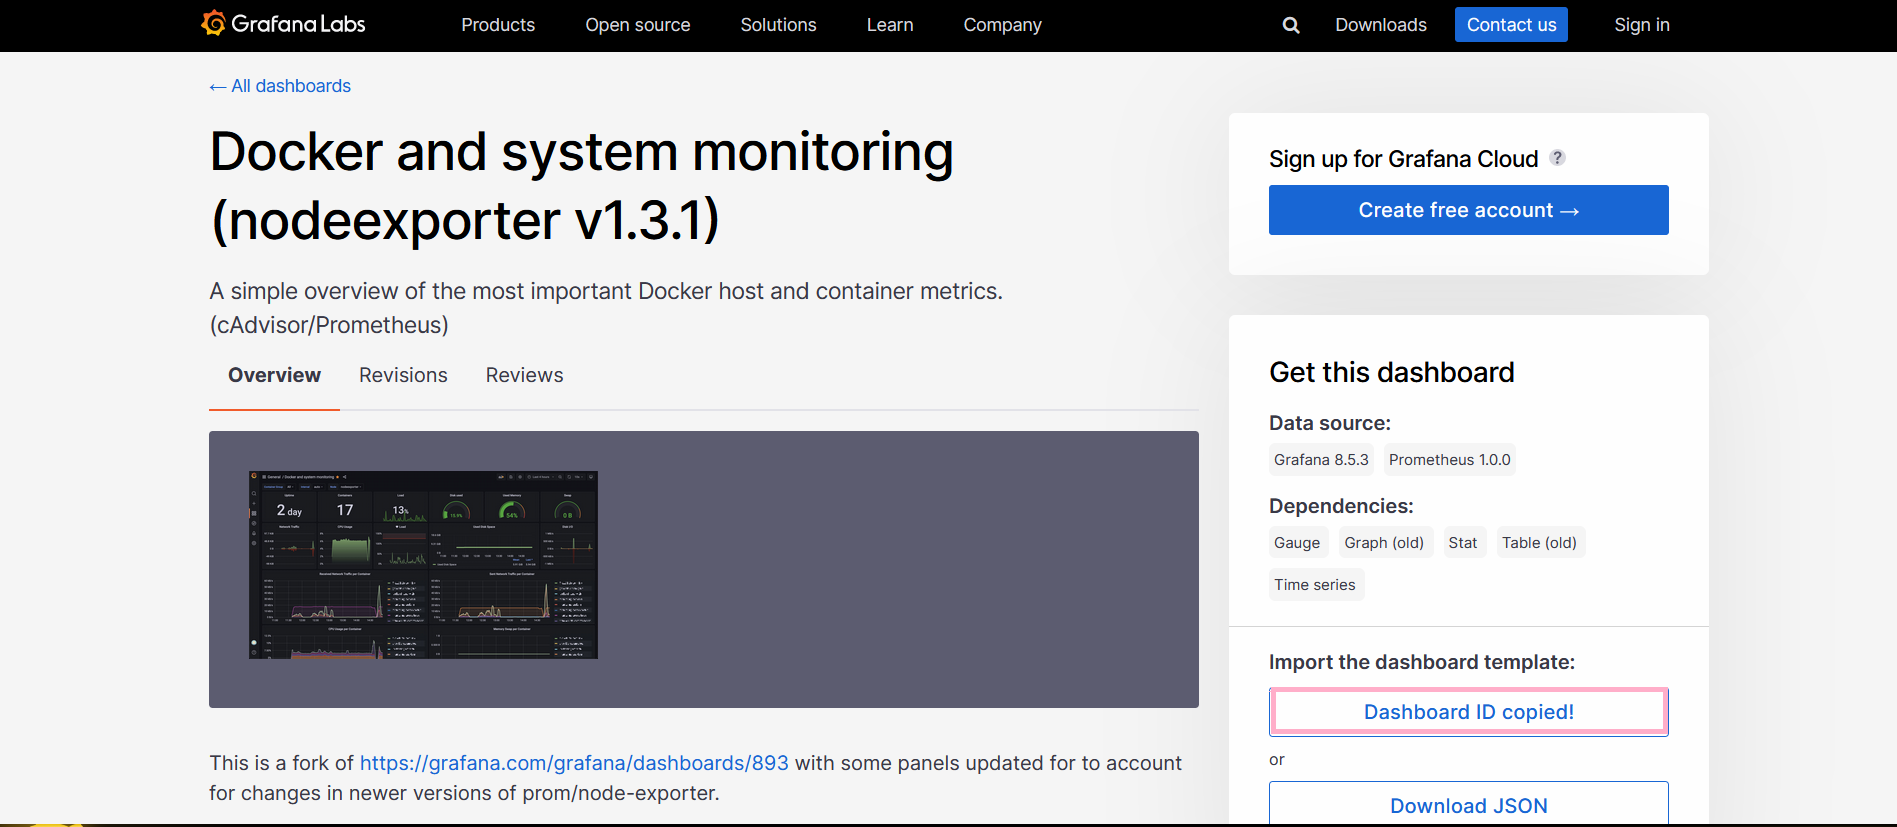
Copy ID to CLipboard button to retrieve this dashboard's ID. Once done, let's return to our Grafana instance and create a new dashboard as follows:
Let's click on the dashboard menu and then on the import submenu.
We will then paste the dashboard ID copied earlier and click on the Load button next to the form to load the dashboard:
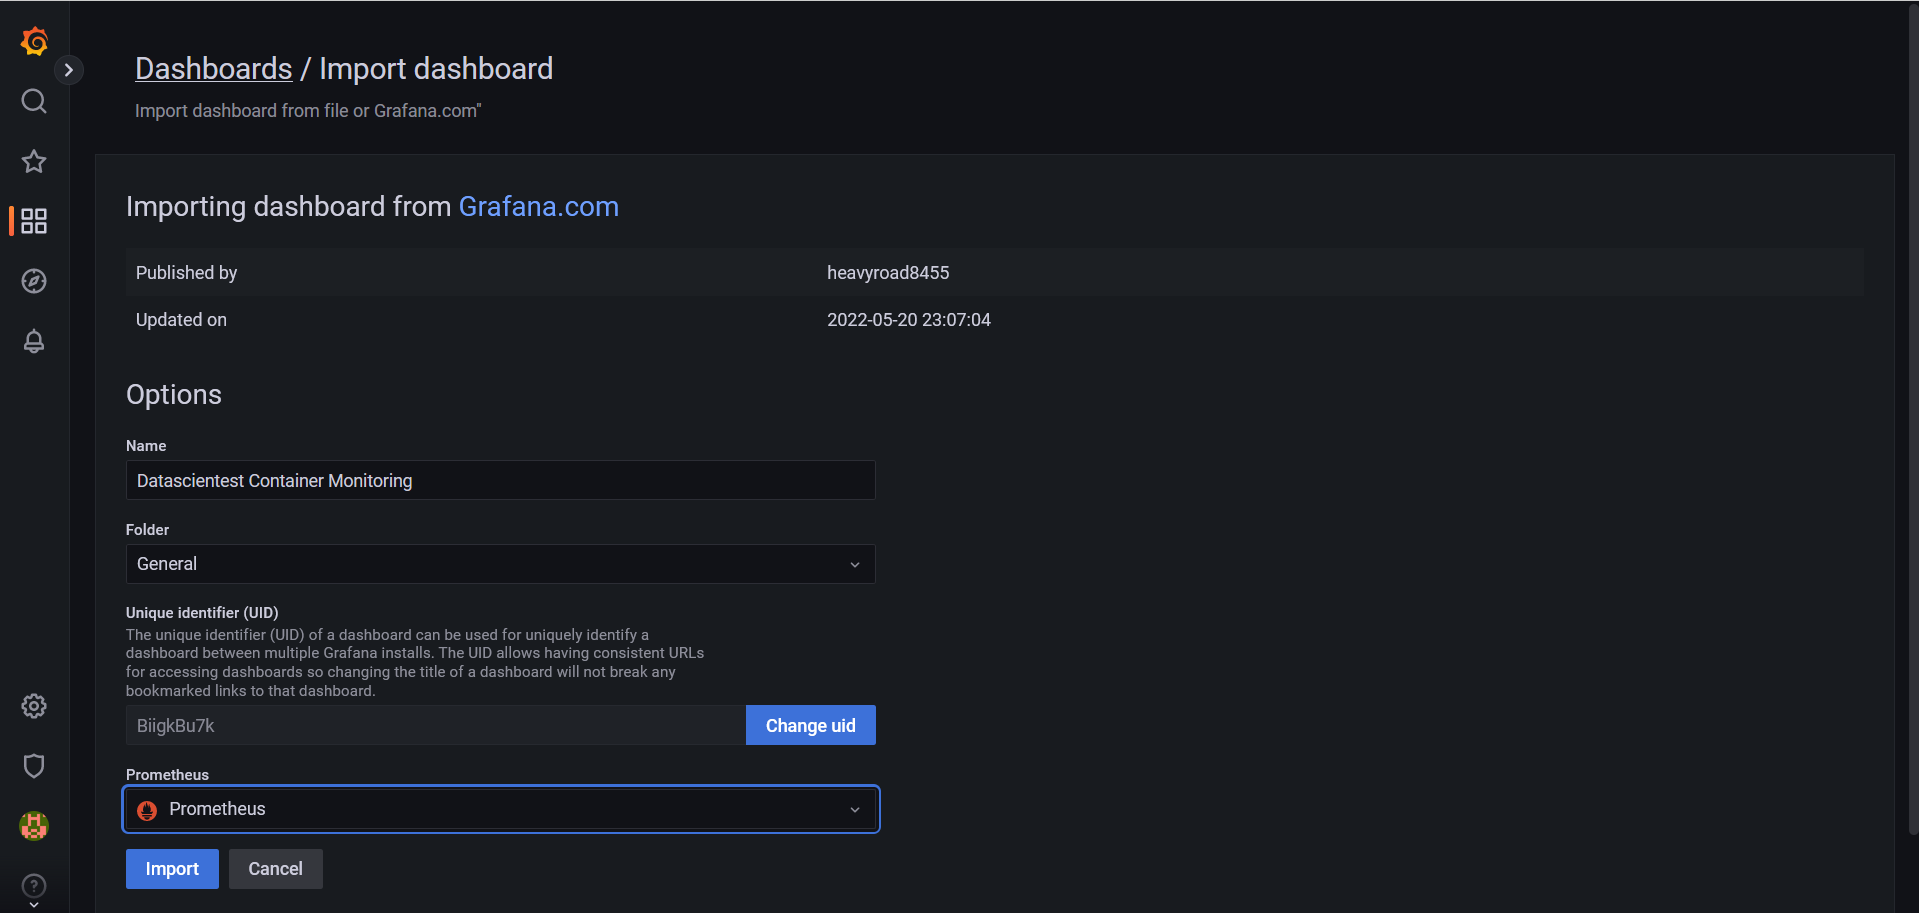
We need to define a name and set a directory to save this dashboard. We'll call Datascientest Container Monitoring and leave it in the General directory and select Prometheus as the data source. We can now import it by clicking on the Import button:
We can now press the key combinations crtl + S, a panel will appear and we will click on the save button to save our dashboard.
It's also possible to create dashboards from JSON templates.
Instead of the ID, we could have retrieved the JSON template to create our dashboard as follows:
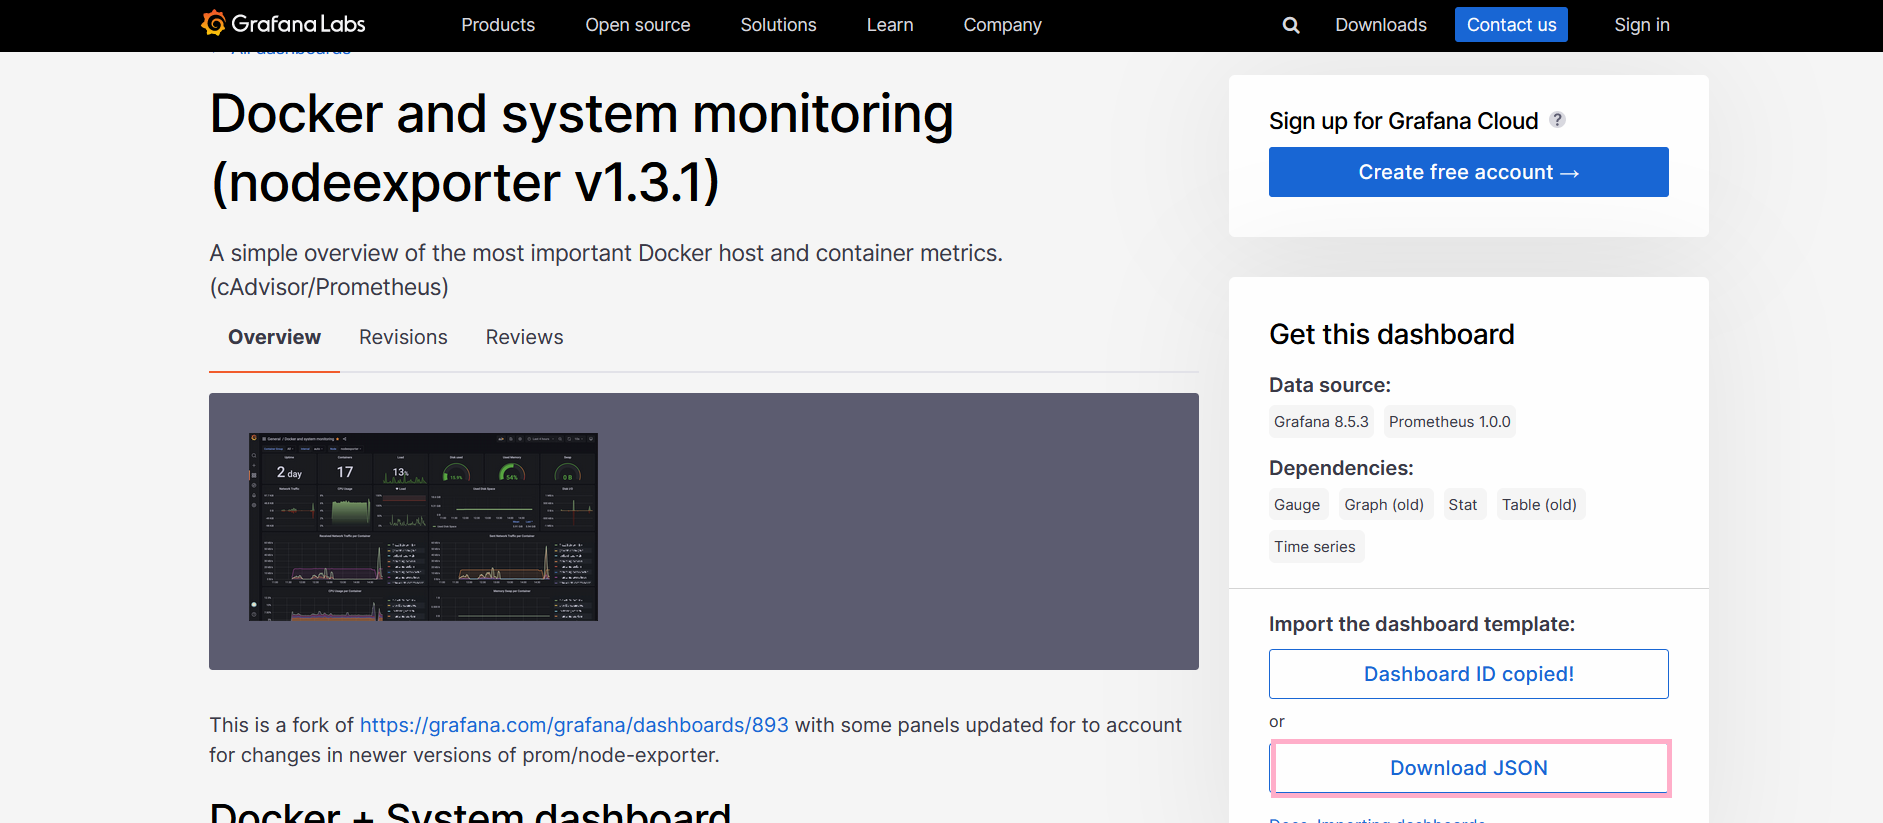
Click on the Download JSON button to retrieve the JSON file for the dashboard.
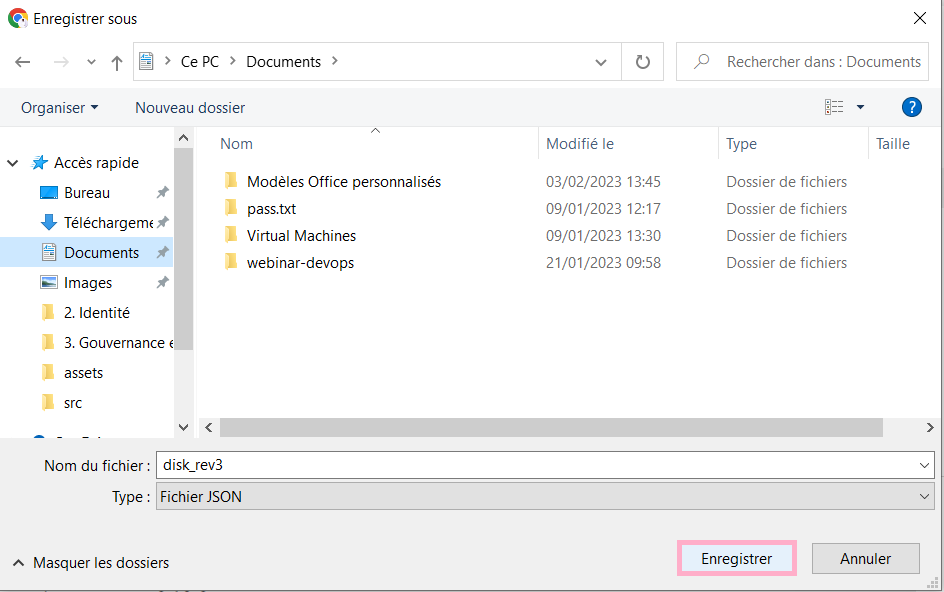
We define a location on our machine and save the file:
Now all we need to do is retrieve the file contents, go to the Dashboard menu and the import submenu:
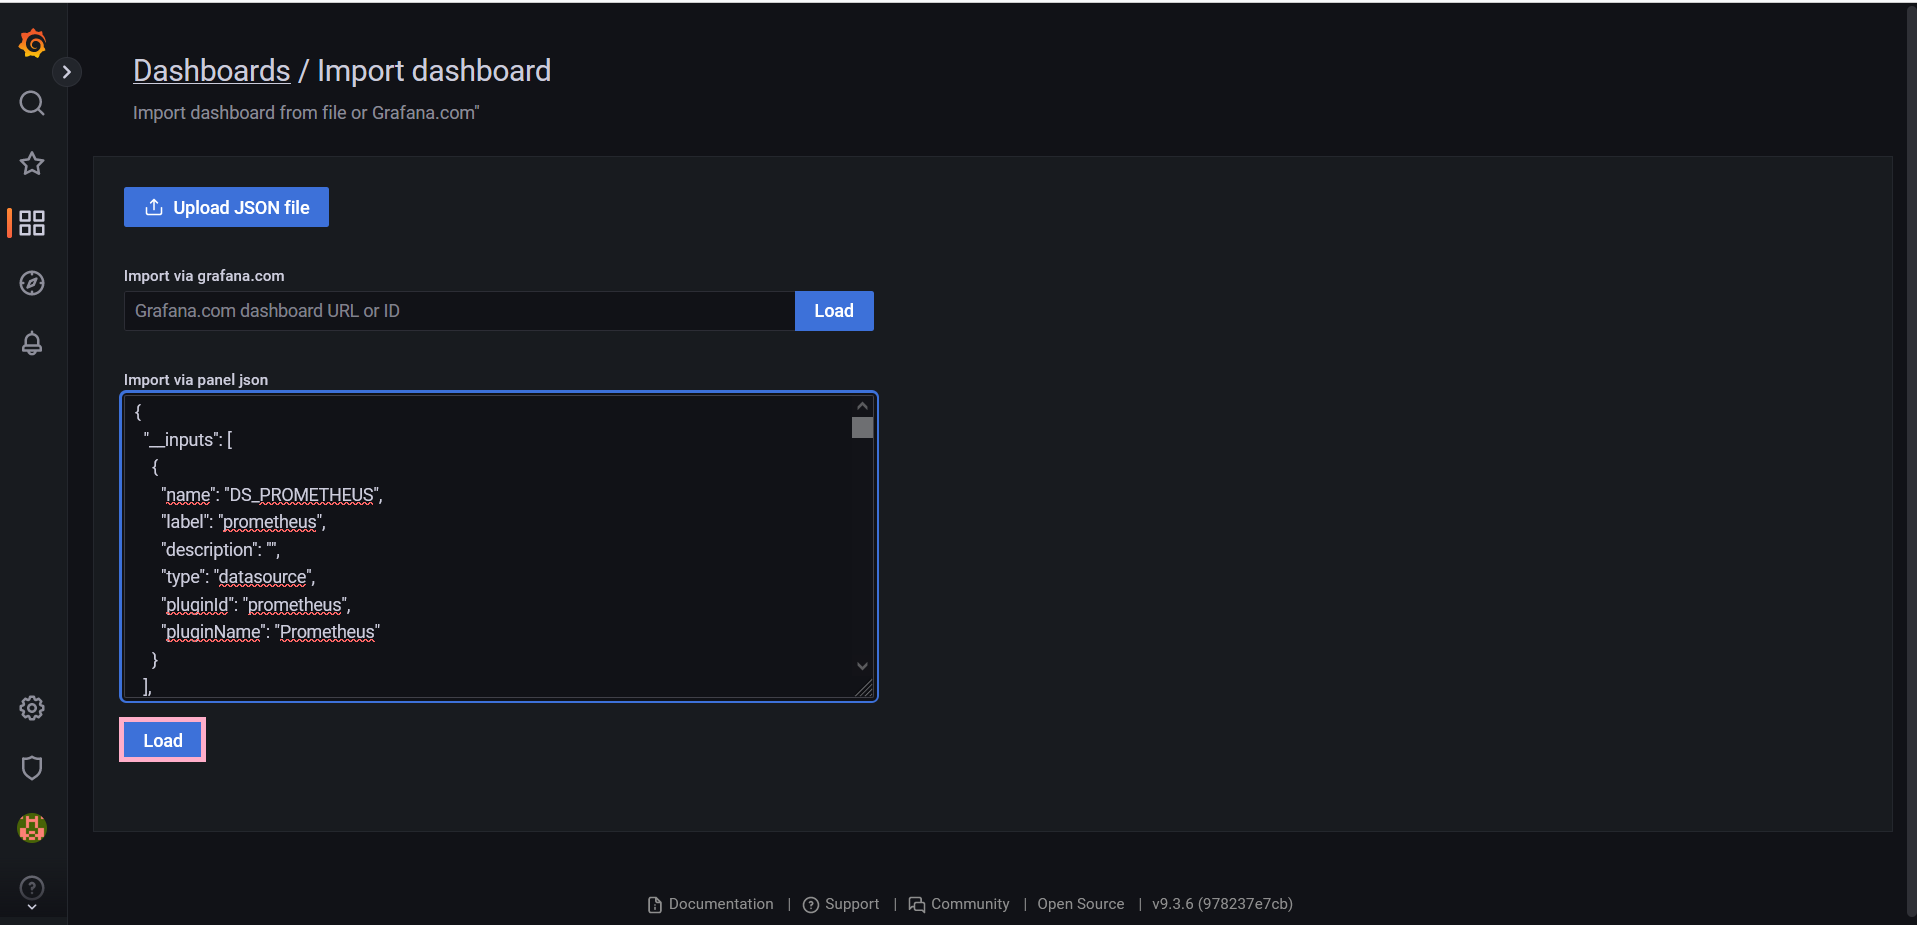
We can fill in the JSON template content on the Import via panel json form and click on the Load button in order to load it. All that remains is to define a name , directory and data source and we'll be able to import the panel.
We'll now delete our Prometheus Grafana stack as follows:
cd..
docker-compose down
Output display:
Stopping prometheus_grafana_1 ... done
Stopping prometheus_prometheus_1 ... done
Stopping prometheus_cadvisor_1 ... done
Stopping prometheus_alertmanager_1 ... done
Stopping prometheus_node-exporter_1... done
Removing prometheus_grafana_1 ... done
Removing prometheus_prometheus_1 ... done
Removing prometheus_cadvisor_1 ... done
Removing prometheus_alertmanager_1 ... done
Removing prometheus_node-exporter_1... done
Removing network prometheus_back-tier
Removing network prometheus_front-tier
c - Defining a data source from Grafana
c.1 - Data sources
Grafana comes with built-in support for many data sources. If you need other data sources, we install them through data source plugins. Each data source comes with a query editor , which formulates custom queries based on the source structure. We can use these as input for a number of operations:
Only users with the organization administrator role can add or delete data sources.
c.2 - PostgreSQL as a data source
PostgreSQL , also known as Postgres , is a free, open source relational database management system (RDBMS) with an emphasis on extensibility and SQL compliance. It was developed at the University of California at Berkeley and first released on July 8, 1996. It was the successor to the Ignes database. Instead of storing data as documents, PostgreSQL stores it as structured objects. It follows traditional SQL format and syntax.
c.3 - Key PostgreSQL features
PostgreSQL contains some unique features that make it a good alternative to other traditional RDBMSs. Some of these features are:
PostgreSQL supports a wide variety of data types, document types and customizations.
It has a monolithic architecture where all components work together in an automated way.
It is ideal for transactional workflows such as banking systems, performing risk assessments, BI (Business Intelligence) and powering various business applications.
It features several safeguards and redundancies that make storage reliable.
It's open-source, so any user can use all its features, free of charge.
It has limited scalability because its processing power depends on the machine on which it runs.
It has a robust access control system with additional features such as row and column-level security and multi-factor authentication with certificates.
It runs successfully on all major operating systems and is ACID (atomicity, consistency, isolation and durability) compliant.
c.4 - Configuration
we're going to set up a data source in order to create dashboards by hand. For this data source , we'll use our instance of PostgreSQL deployed as the database for our Odoo ERP. We can check the presence of our container as follows:
docker ps | grep postgres
Output display:
38f7632647f5 postgres:13 "docker-entrypoint.s..." 2 hours ago Up 2 hours 5432/tcp odoo_db_1
The name of our container is odoo_db_1.
We're going to run an instance of Grafana through Docker to leverage our data source. We'll modify the Odoo and PostgreSQL docker-compose.yml file as follows:
version: '2'

services:
  db:
    image: postgres:16-alpine
    environment:
      - POSTGRES_PASSWORD=odoo
      - POSTGRES_USER=odoo
      - POSTGRES_DB=postgres
    restart: always # run as service
    volumes:
        - ./postgresql:/var/lib/postgresql/data
  odoo14:
    image: odoo:12.0
    depends_on:
      - db
    ports:
      - "10014:8069"
      - "20014:8072" # chat between users
    environment:
      - HOST=db
      - USER=odoo
      - PASSWORD=odoo
      - ./addons:/mnt/extra-addons
      - ./etc:/etc/odoo
    restart: always # run as service
# access will be admin/admin for Grafana
grafana:
image: grafana/grafana
ports:
- 3000:3000
restart: unless-stopped
We can run the docker-compose stack:
docker-compose up -d
Output display:
odoo_db_1 is up-to-date
odoo_odoo14_1 is up-to-date
Creating odoo_grafana_1... done
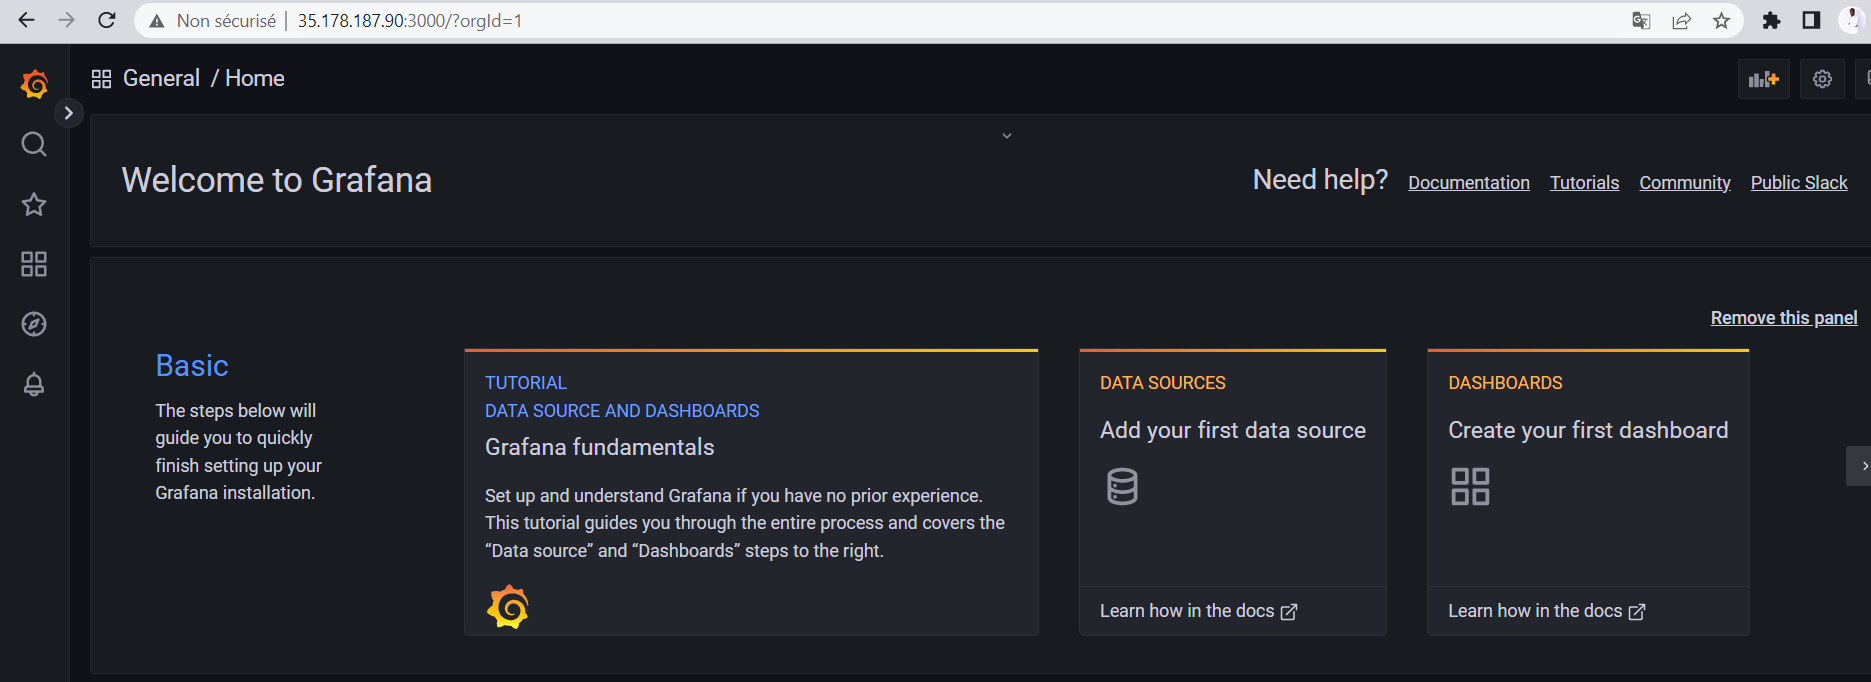
We can log in and change Grafana's password to whatever we want.
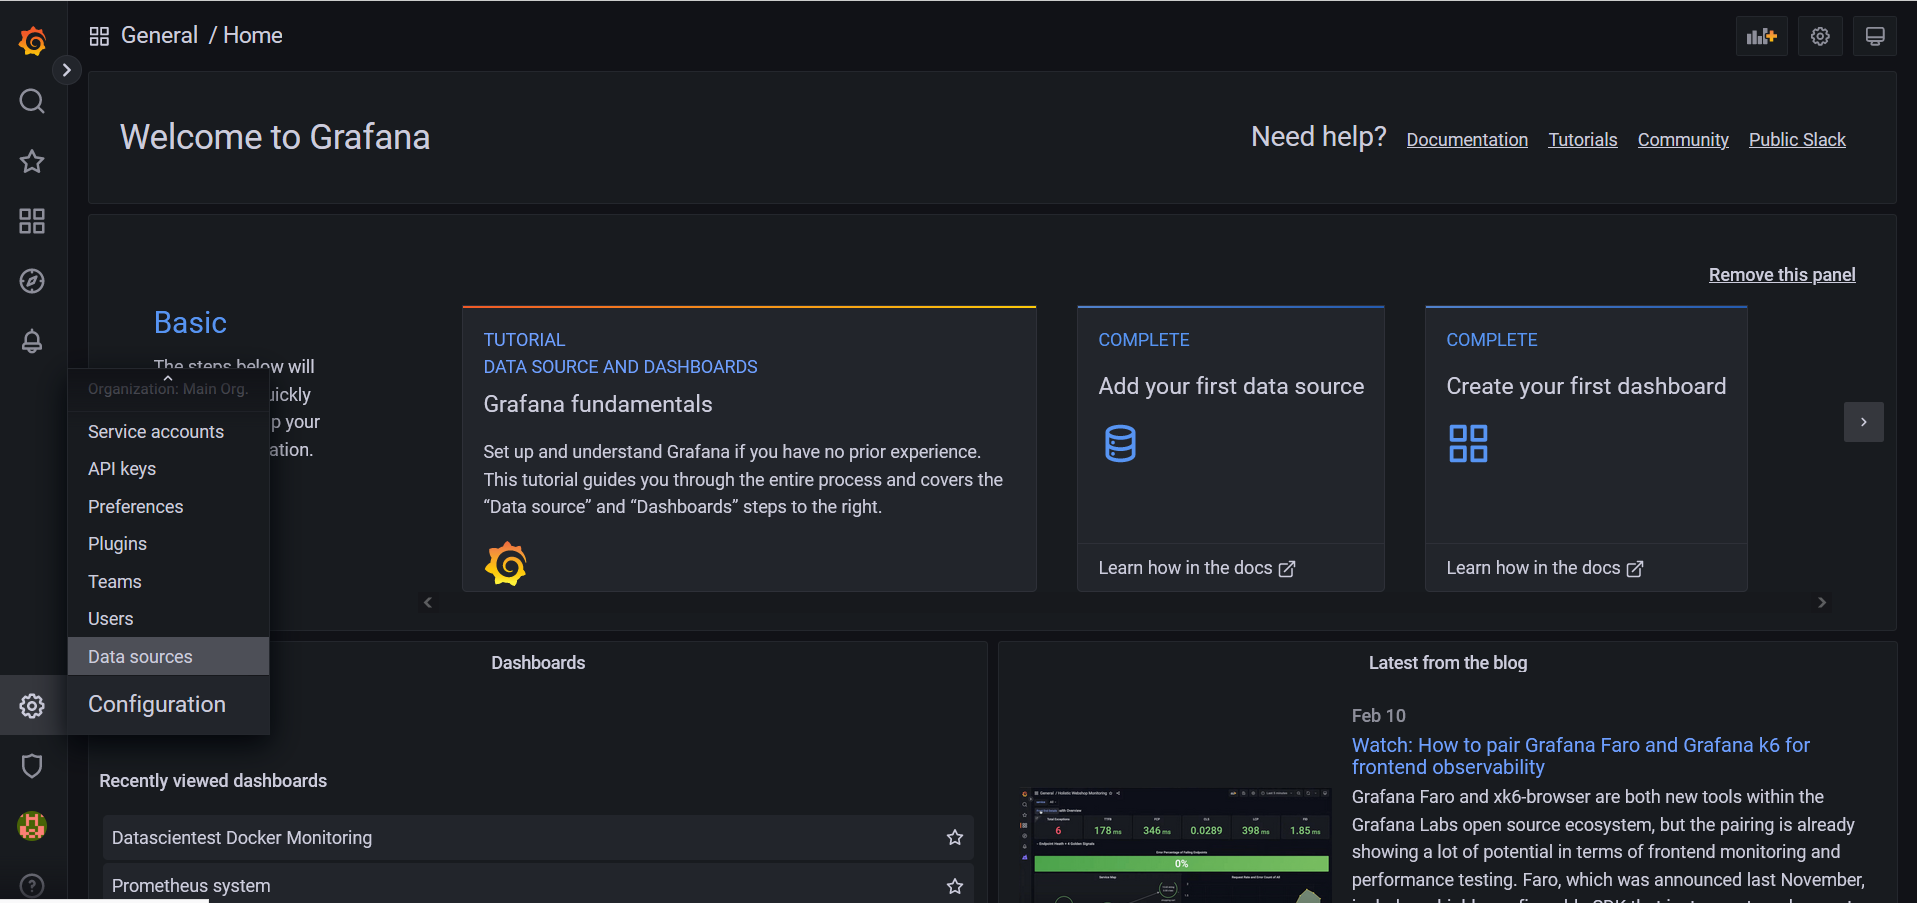
We'll start by adding a data source (data sources) to provide metrics for our dashboards. We click on the configuration menu icon, and click on the data sources submenu:
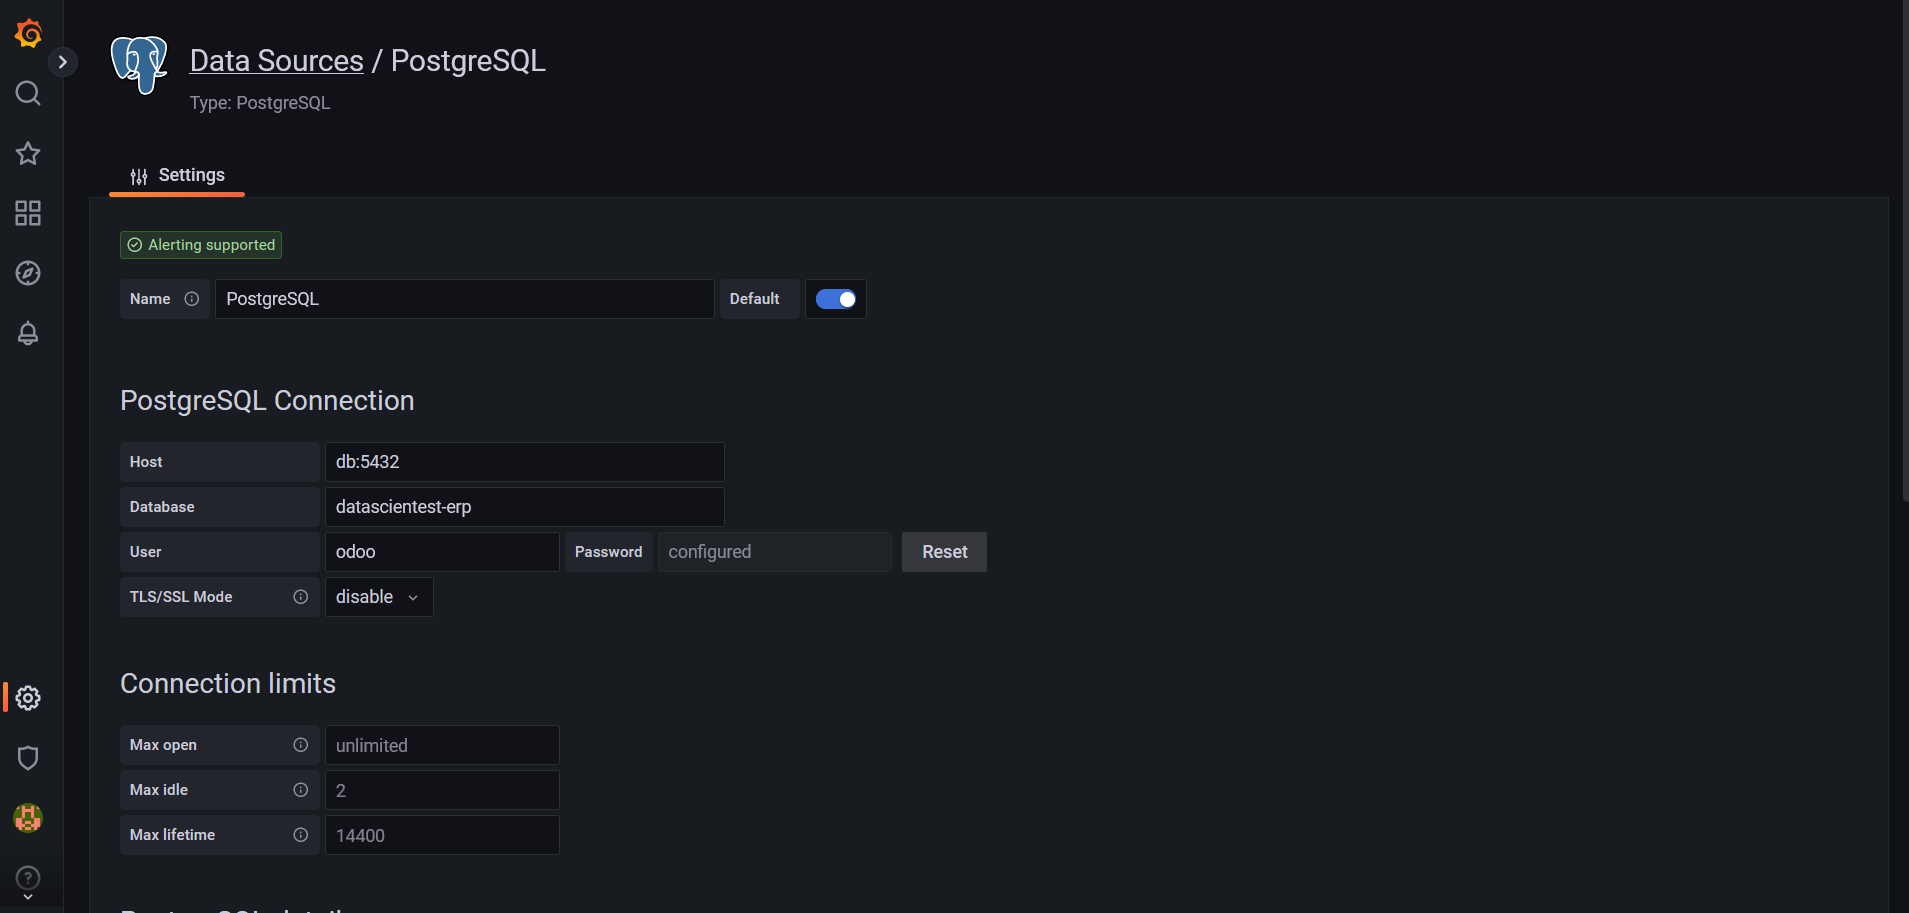
It's time to add our data source. Let's filter the search form and write PostgreSQL.We can provide the following configurations to our data source:
Host:
db:5432,Database :
datascientest-erp,User:
odoo,Password:
odoo,TLS/SSL Mode:
Disable,PostgreSQL Version:
13.
We leave the rest of the configurations as default.
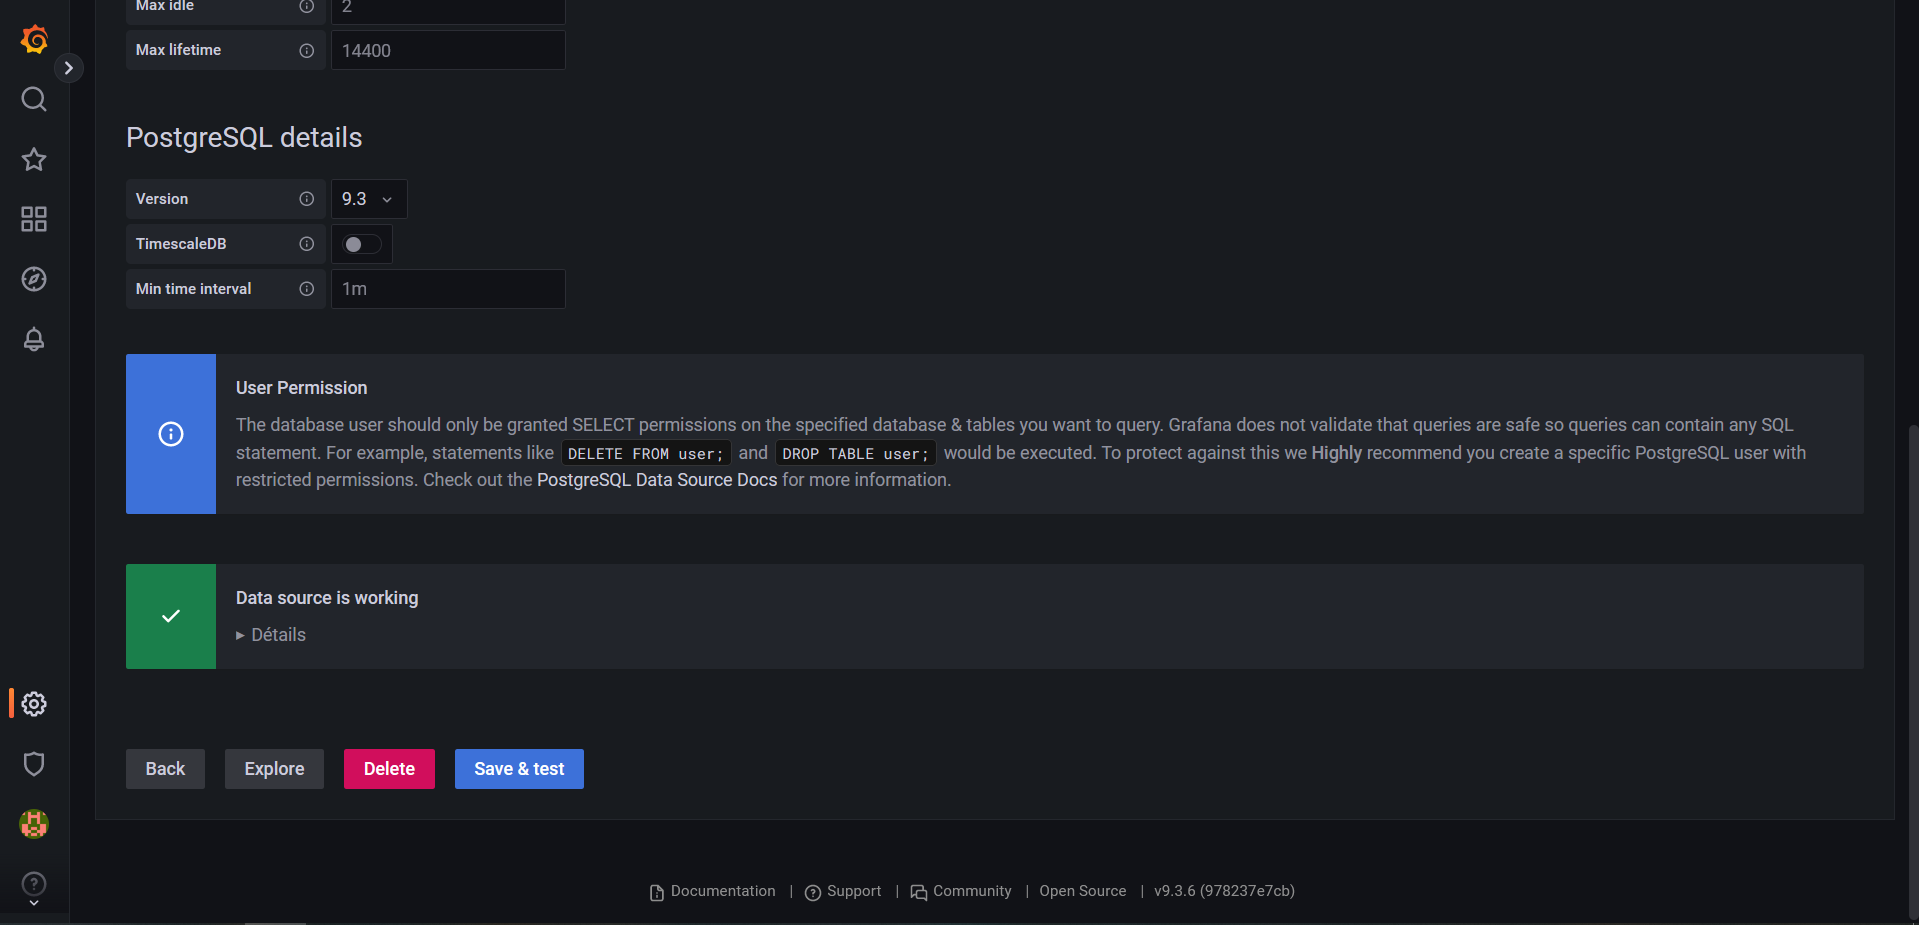
We have a Database Connection OK message which means that Grafana was able to connect to our database successfully. We can now create a dashboard to consume the data from our data source. Let's click on the Dashboard menu and the New Dashboard:
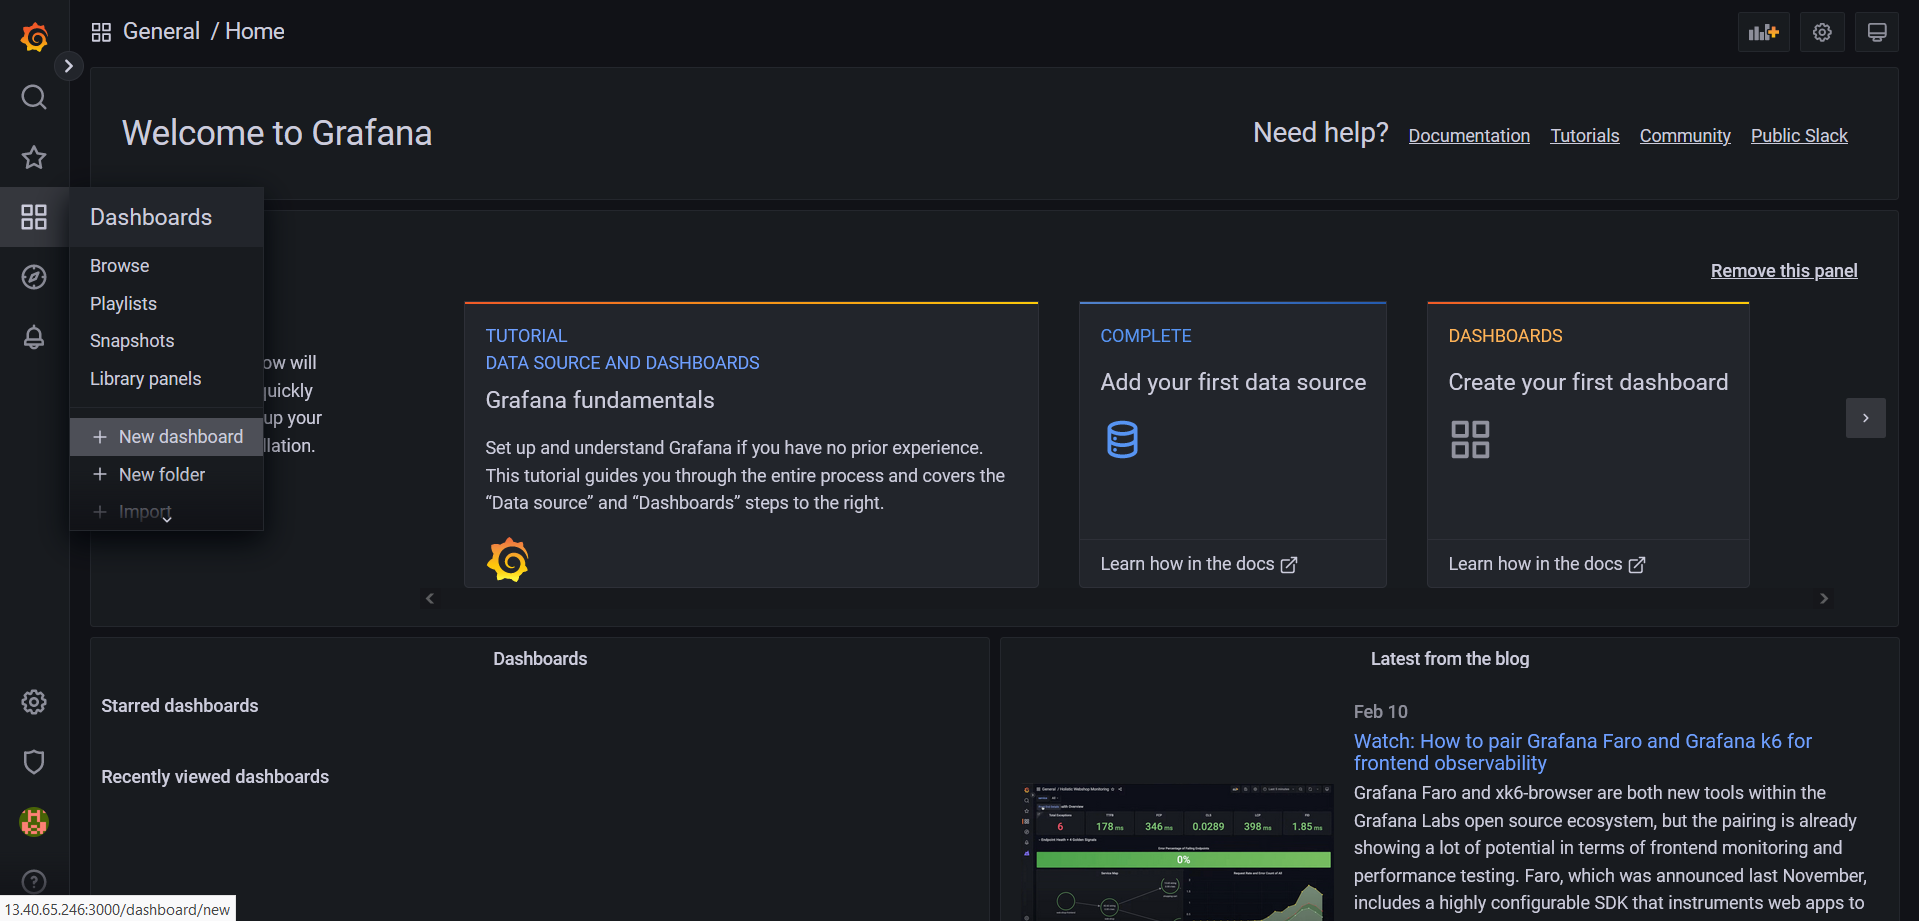
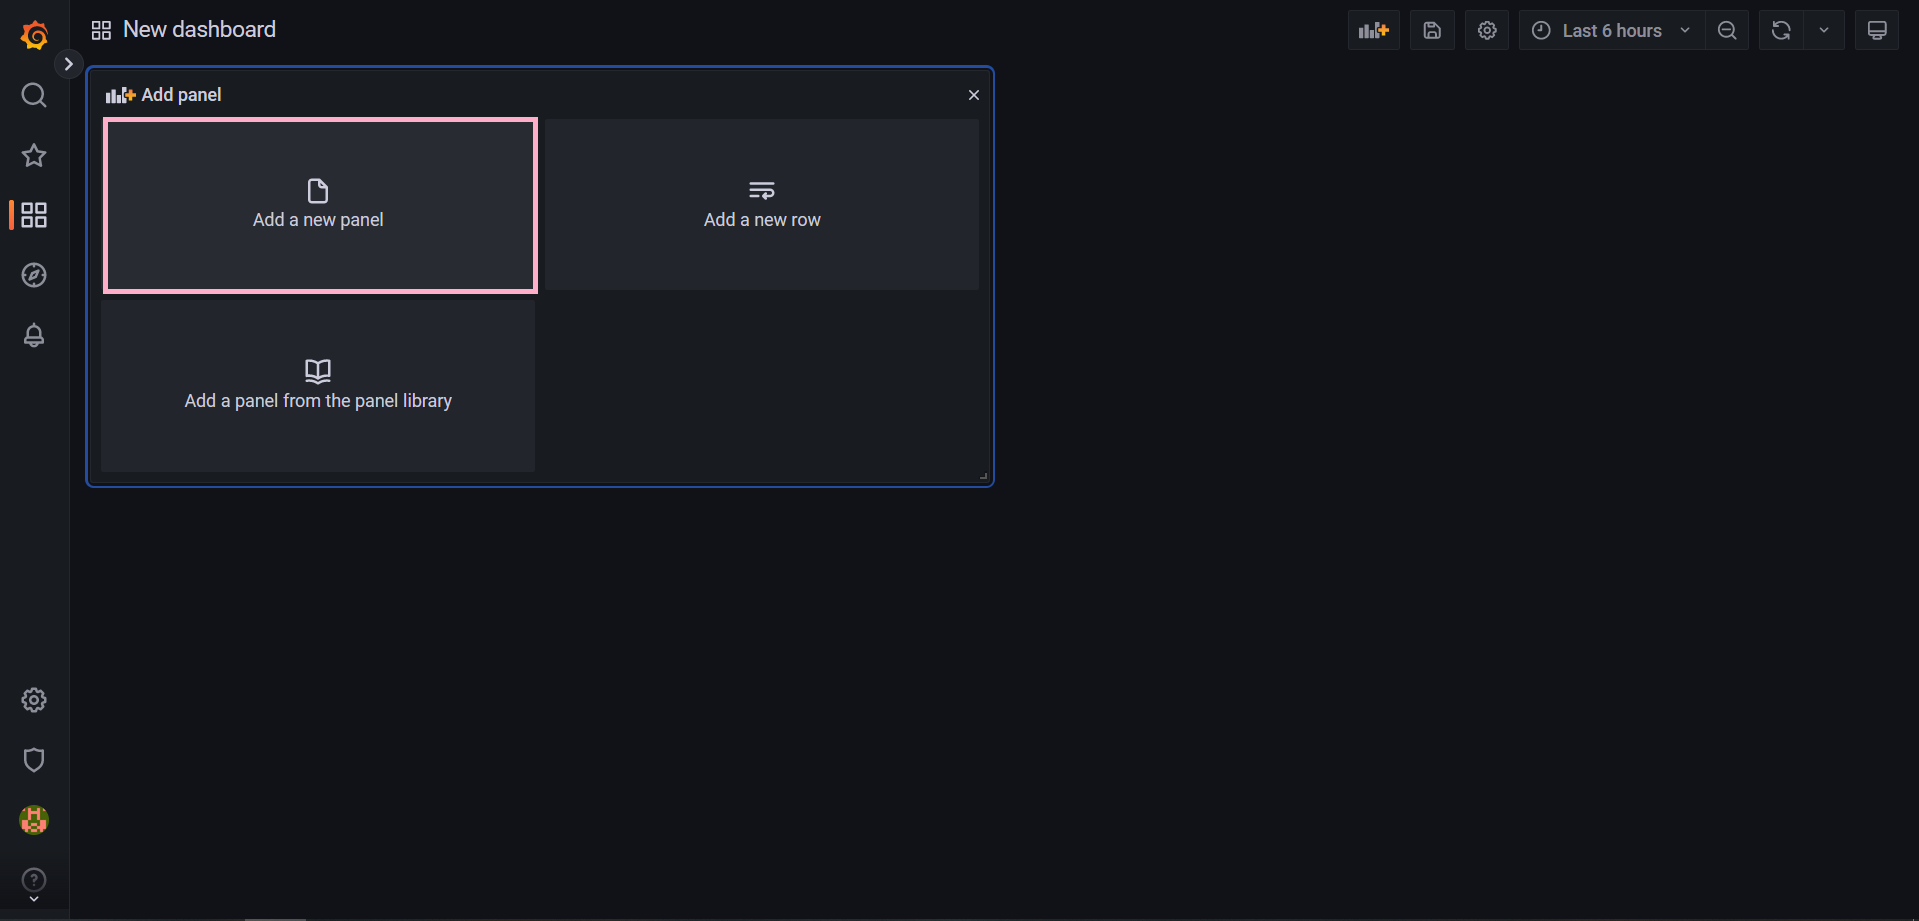
Next, we will click on the New Panel:
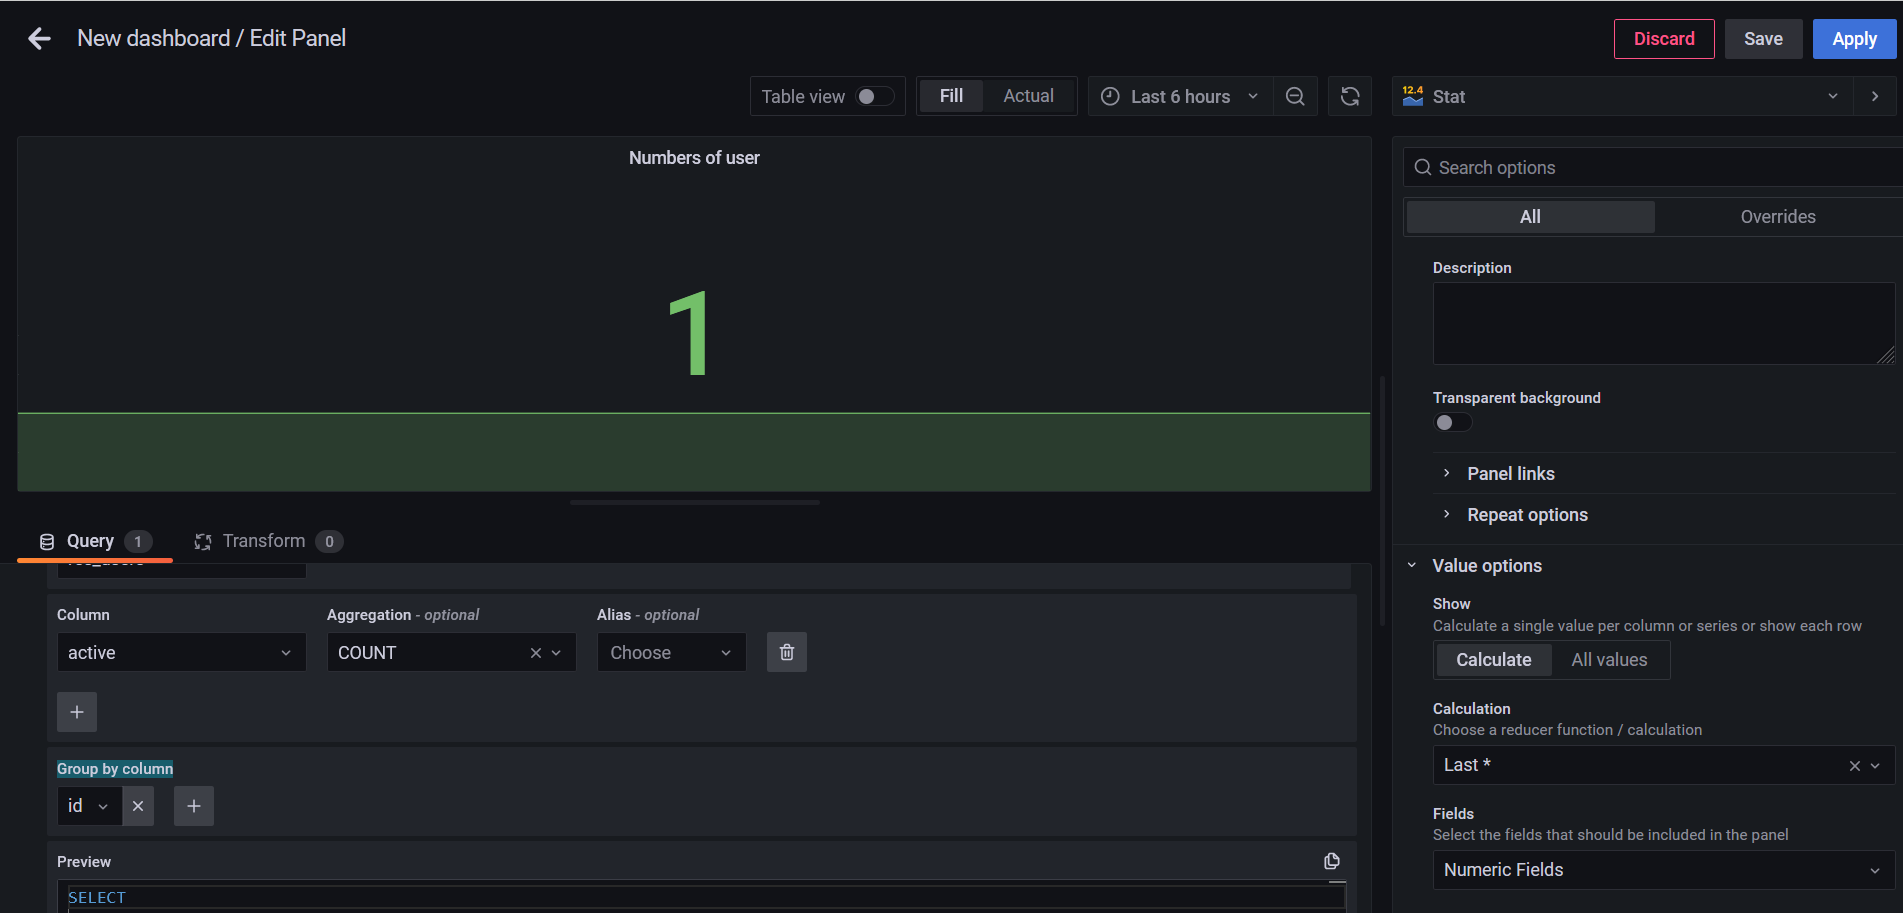
We will select as Data sources:
PostgreSQL.As database table we select
res_users.We choose for the column field:
active.for the Aggregation field:
COUNT.For the Group by column field we provide the value
id.On the Visualization column located on the right-hand side of Grafana's interface, let's choose the
Statdiagram.
And finally we can click on the run query button.
In order to have the number of users present in the database:
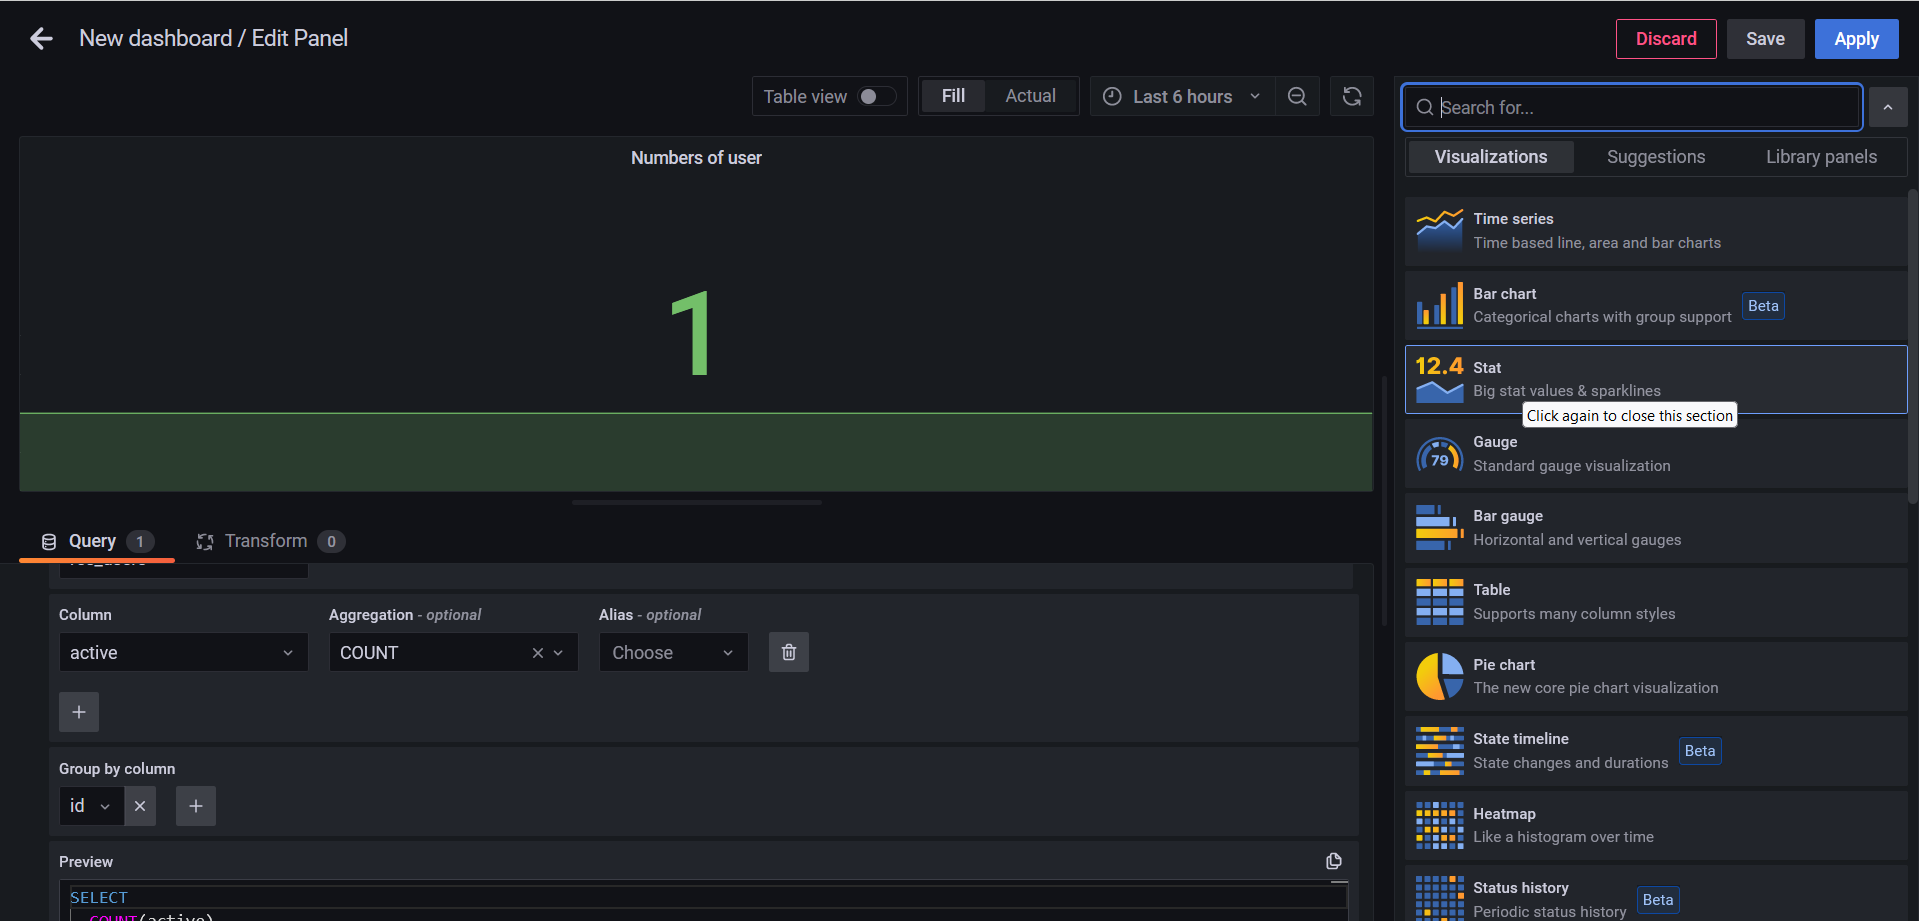
On the right-hand menu , we can fill the title field with the value Numbers of user. Finally we can click on the apply button.
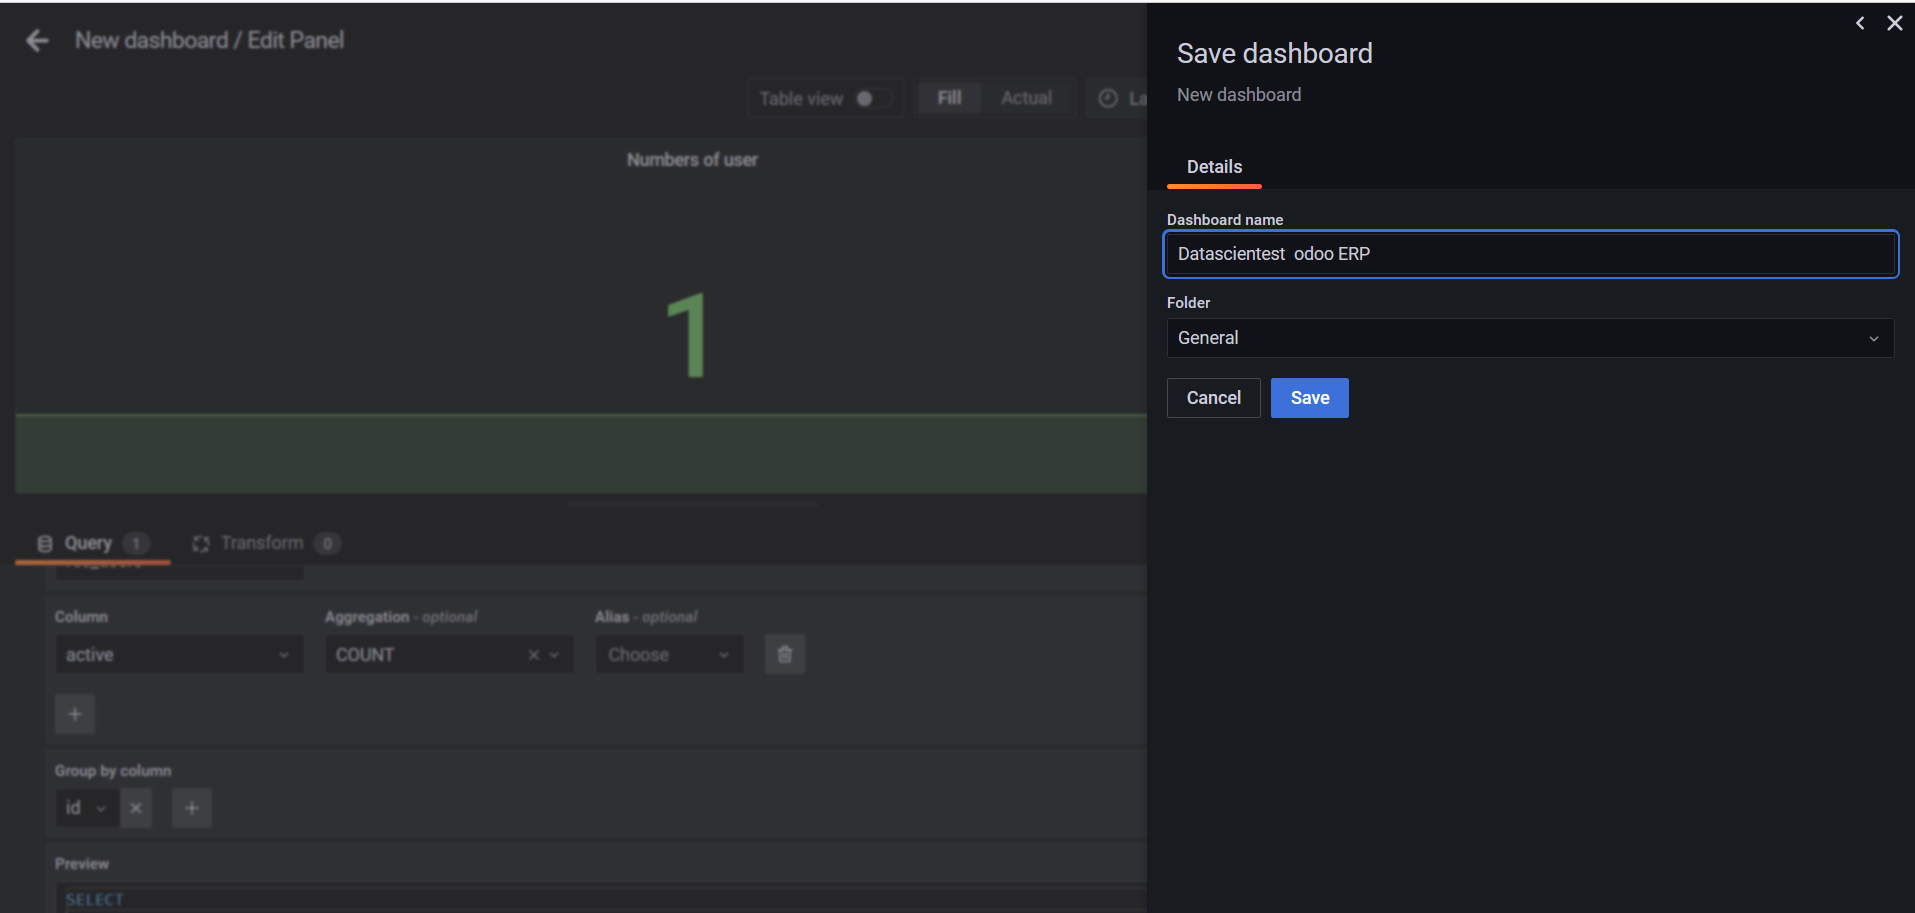
We can use the key combination `ctrl + S to save our dashboard. We need to give it a name , we'll call it Datascientest Odoo ERP , we'll save it in the general directory. All that remains is to press the save button.
We can also add the number of companies created within Odoo. We click on the little Add new Panel button to add a new panel that we'll configure.
We'll select as Data sources: PostgreSQL, as database table we select res_company, We choose for the column field: id , for the Aggregation field: COUNT. On the Visualization column located on the right side of Grafana's interface , let's choose the Gauge diagram , and finally we can click on the run query button to get the number of users present in the database:
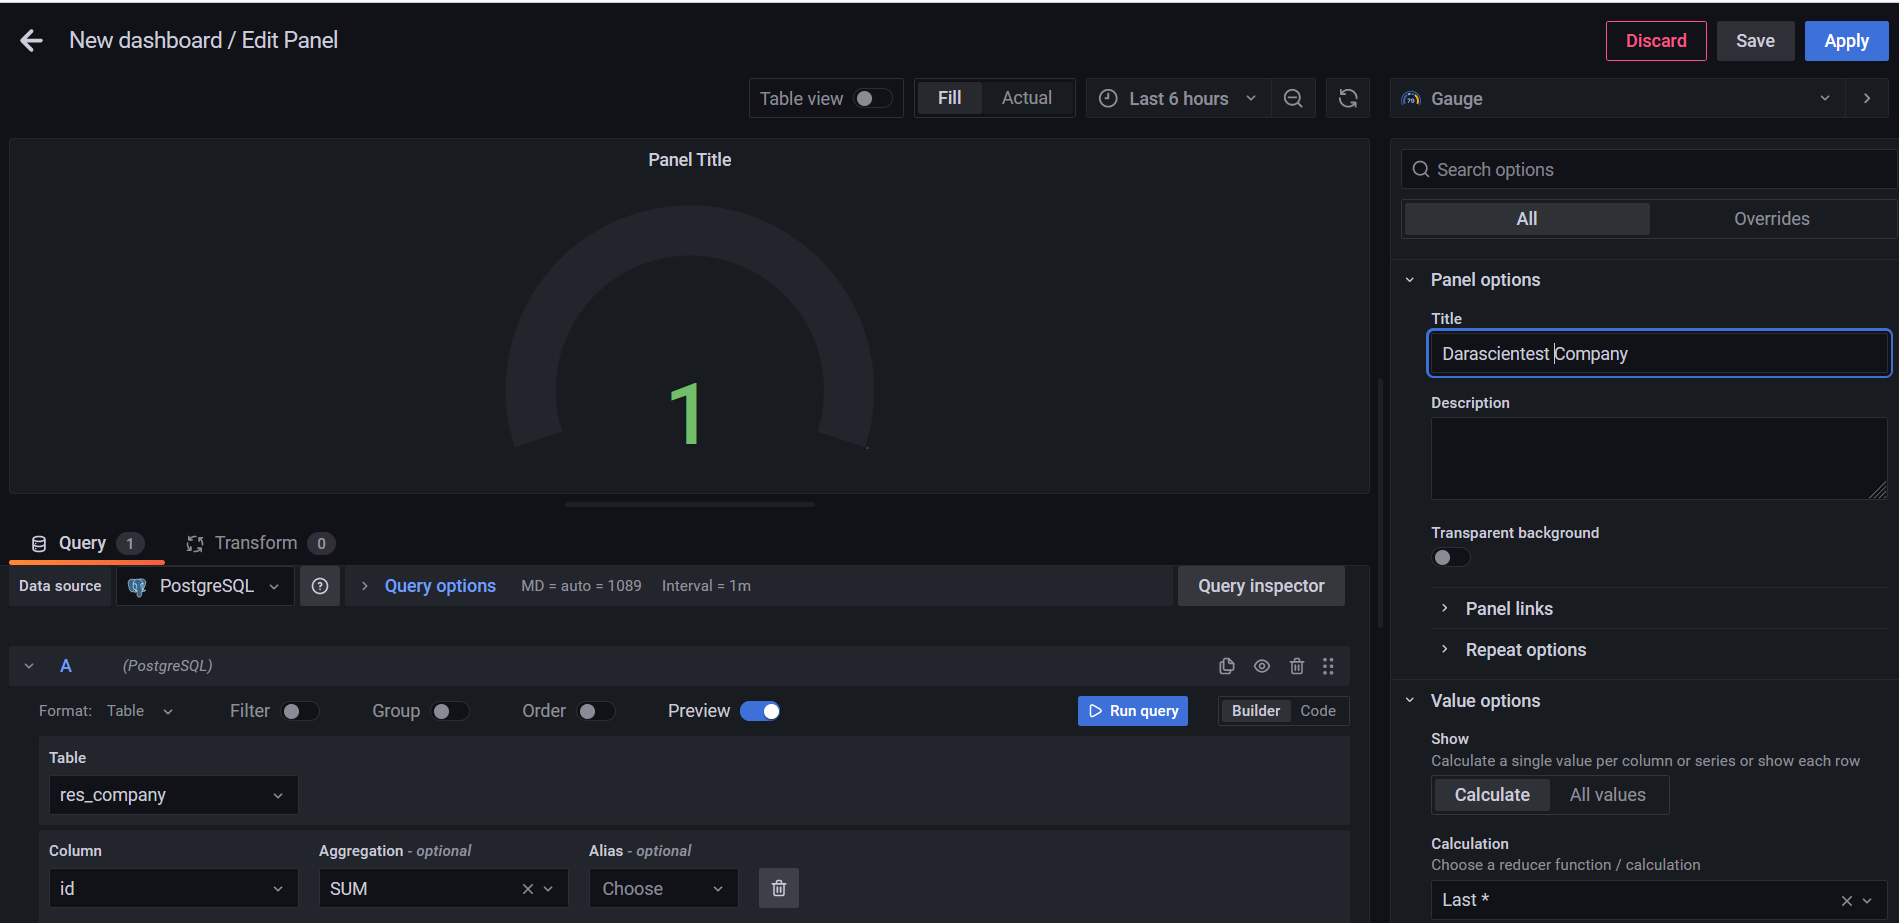
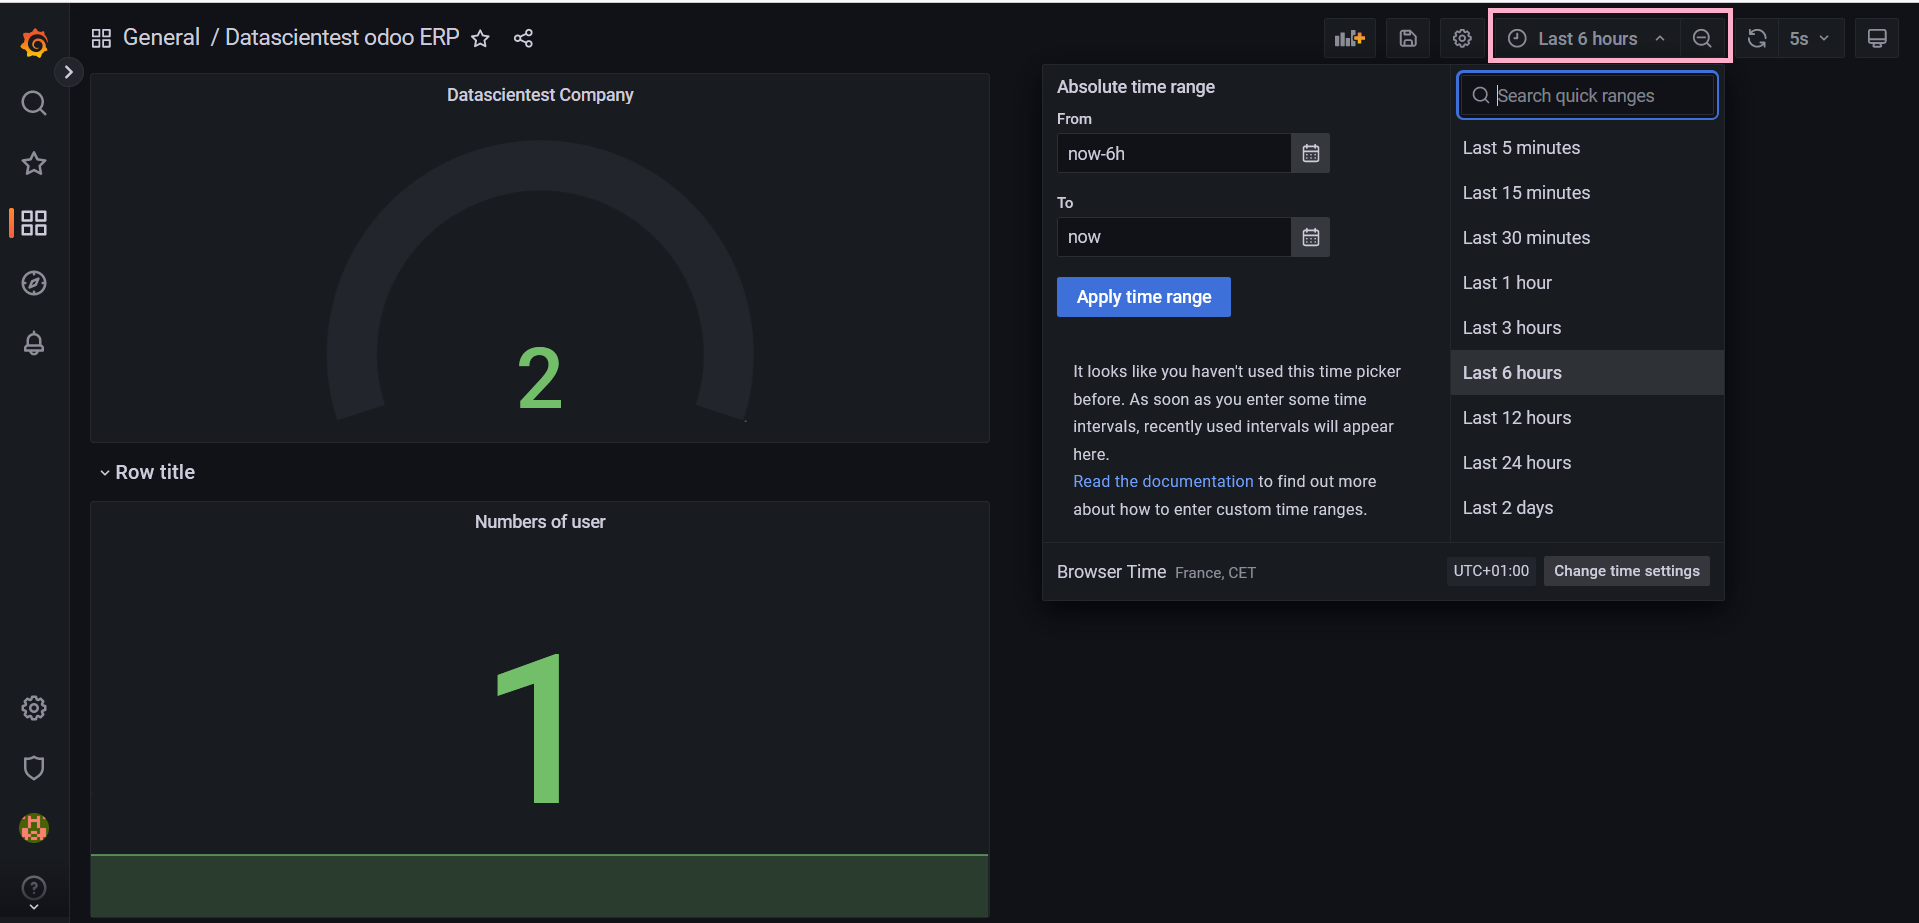
We can also give it a name on the title field on the right , we'll call Datascientest Company , we can now click on the Apply button.
Let's connect to Odoo now add a new company and check that we get the new updated number. Let's connect to our application , click on the menu and select settings.
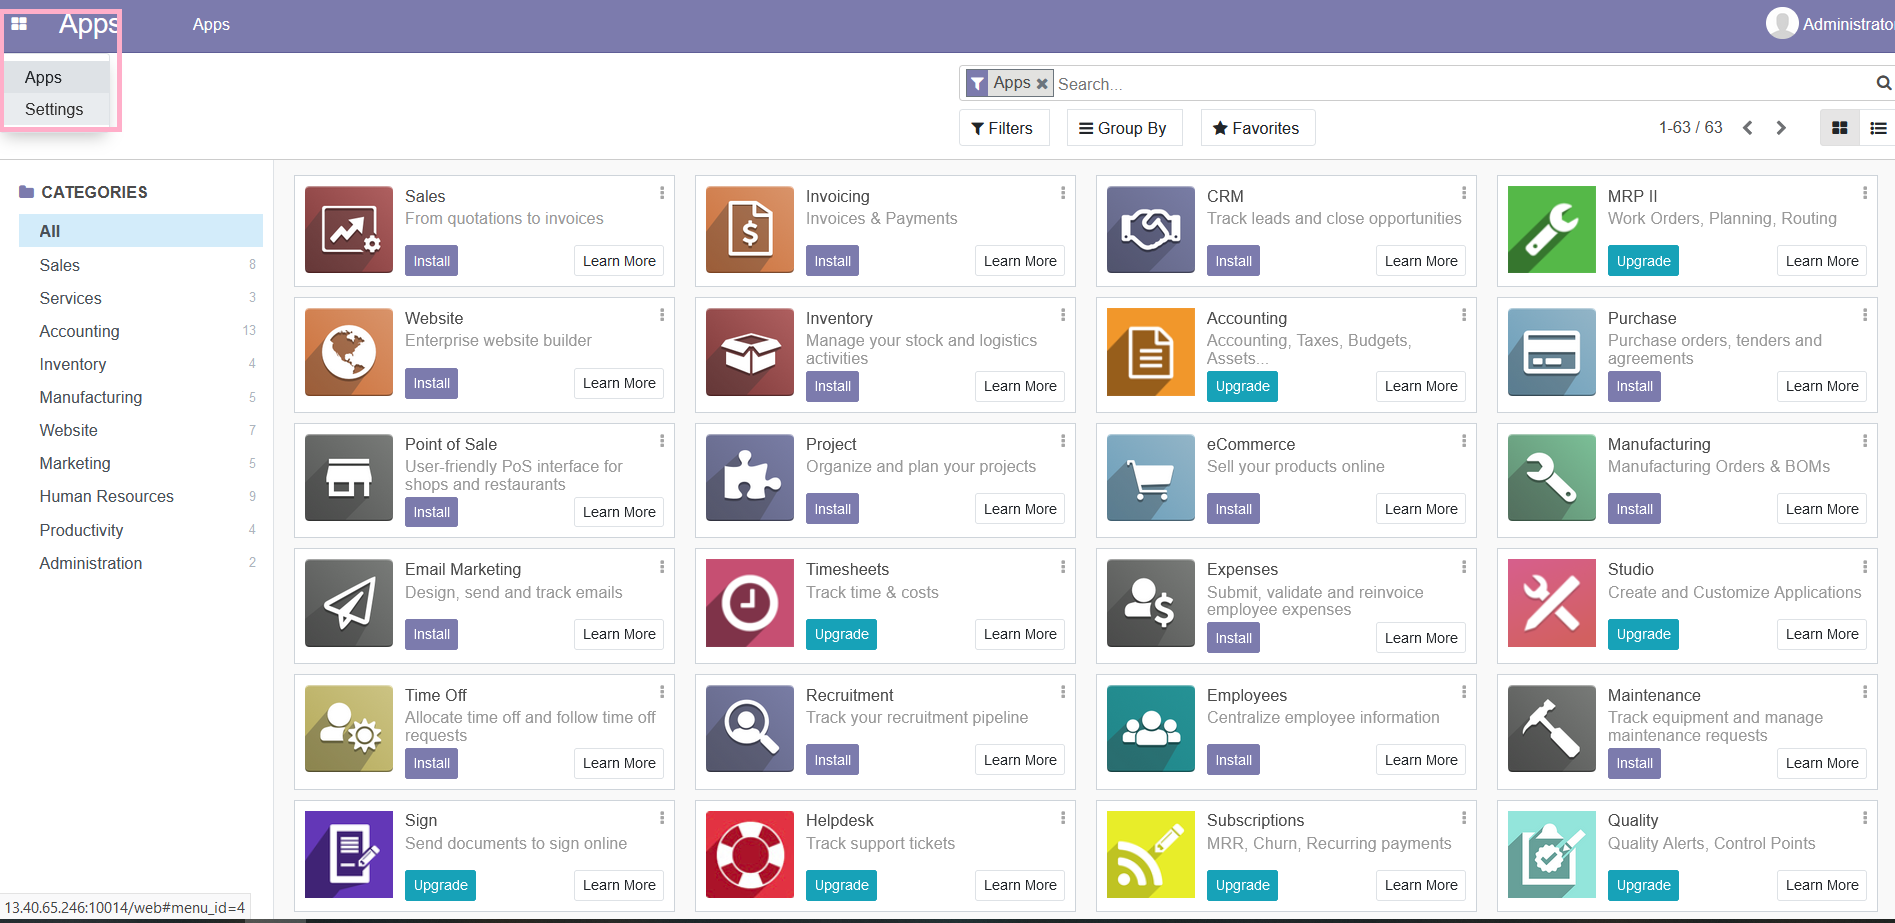
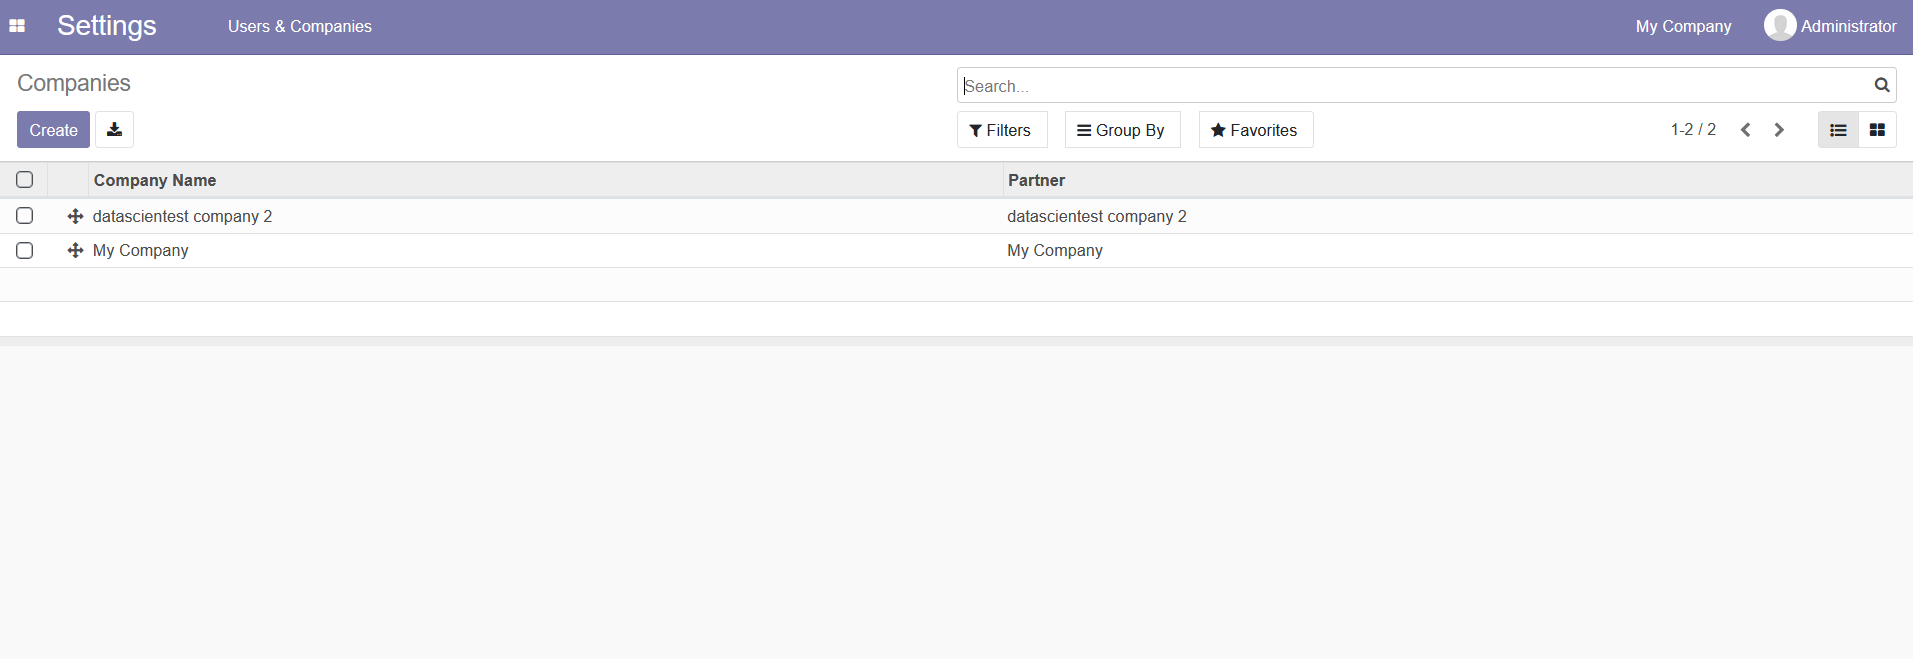
Let's click on the users & companies menu and select the companies sub-menu.
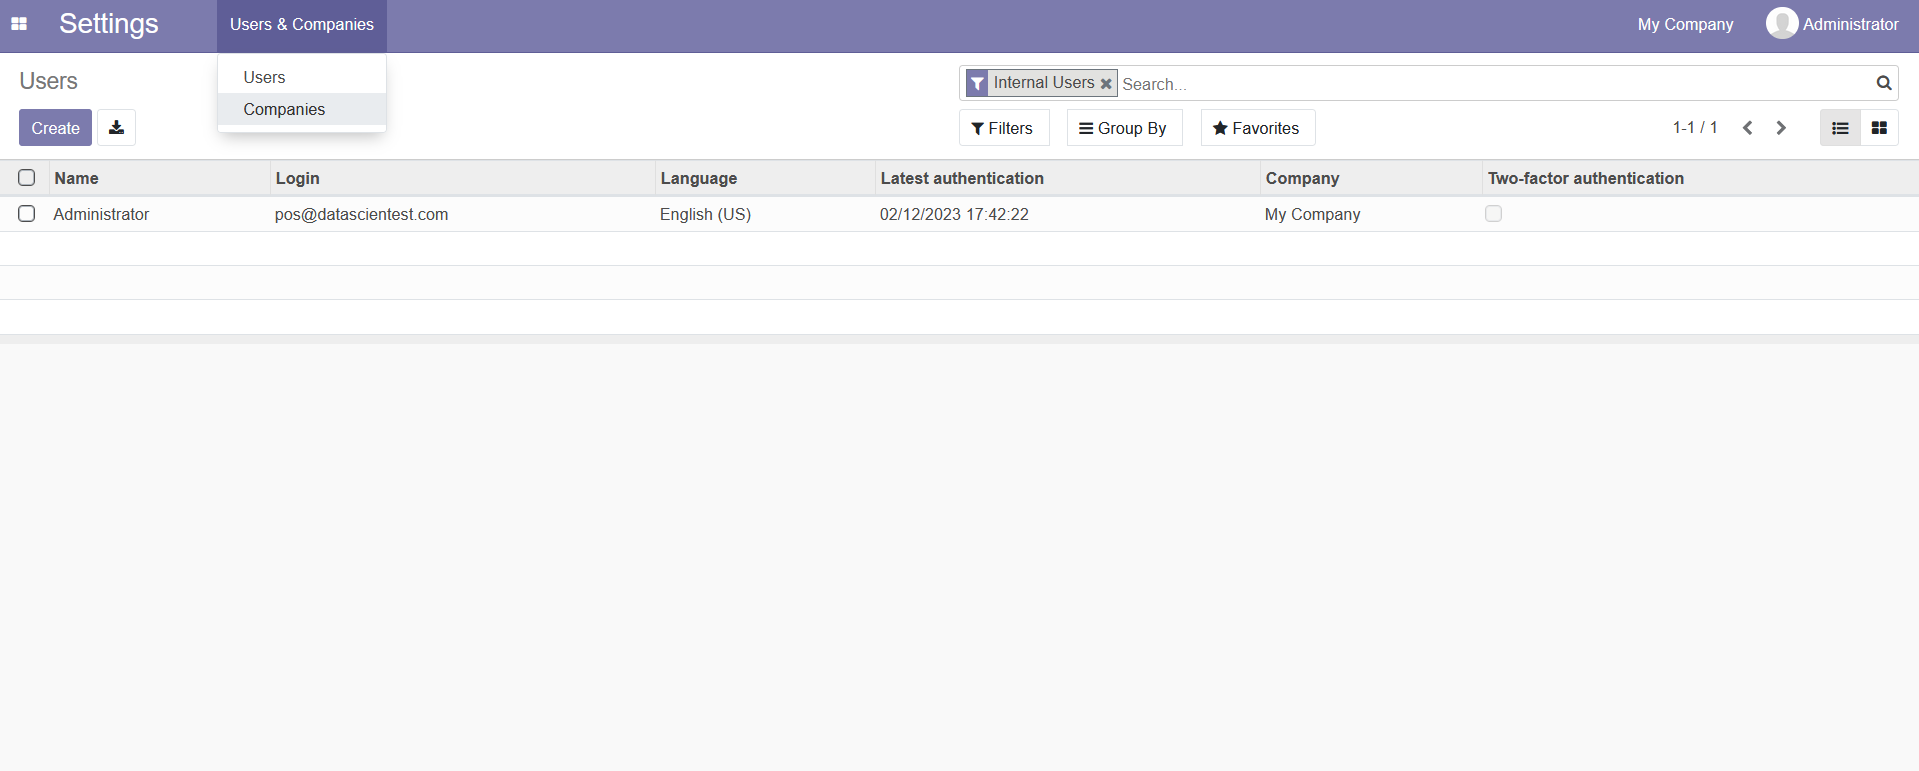
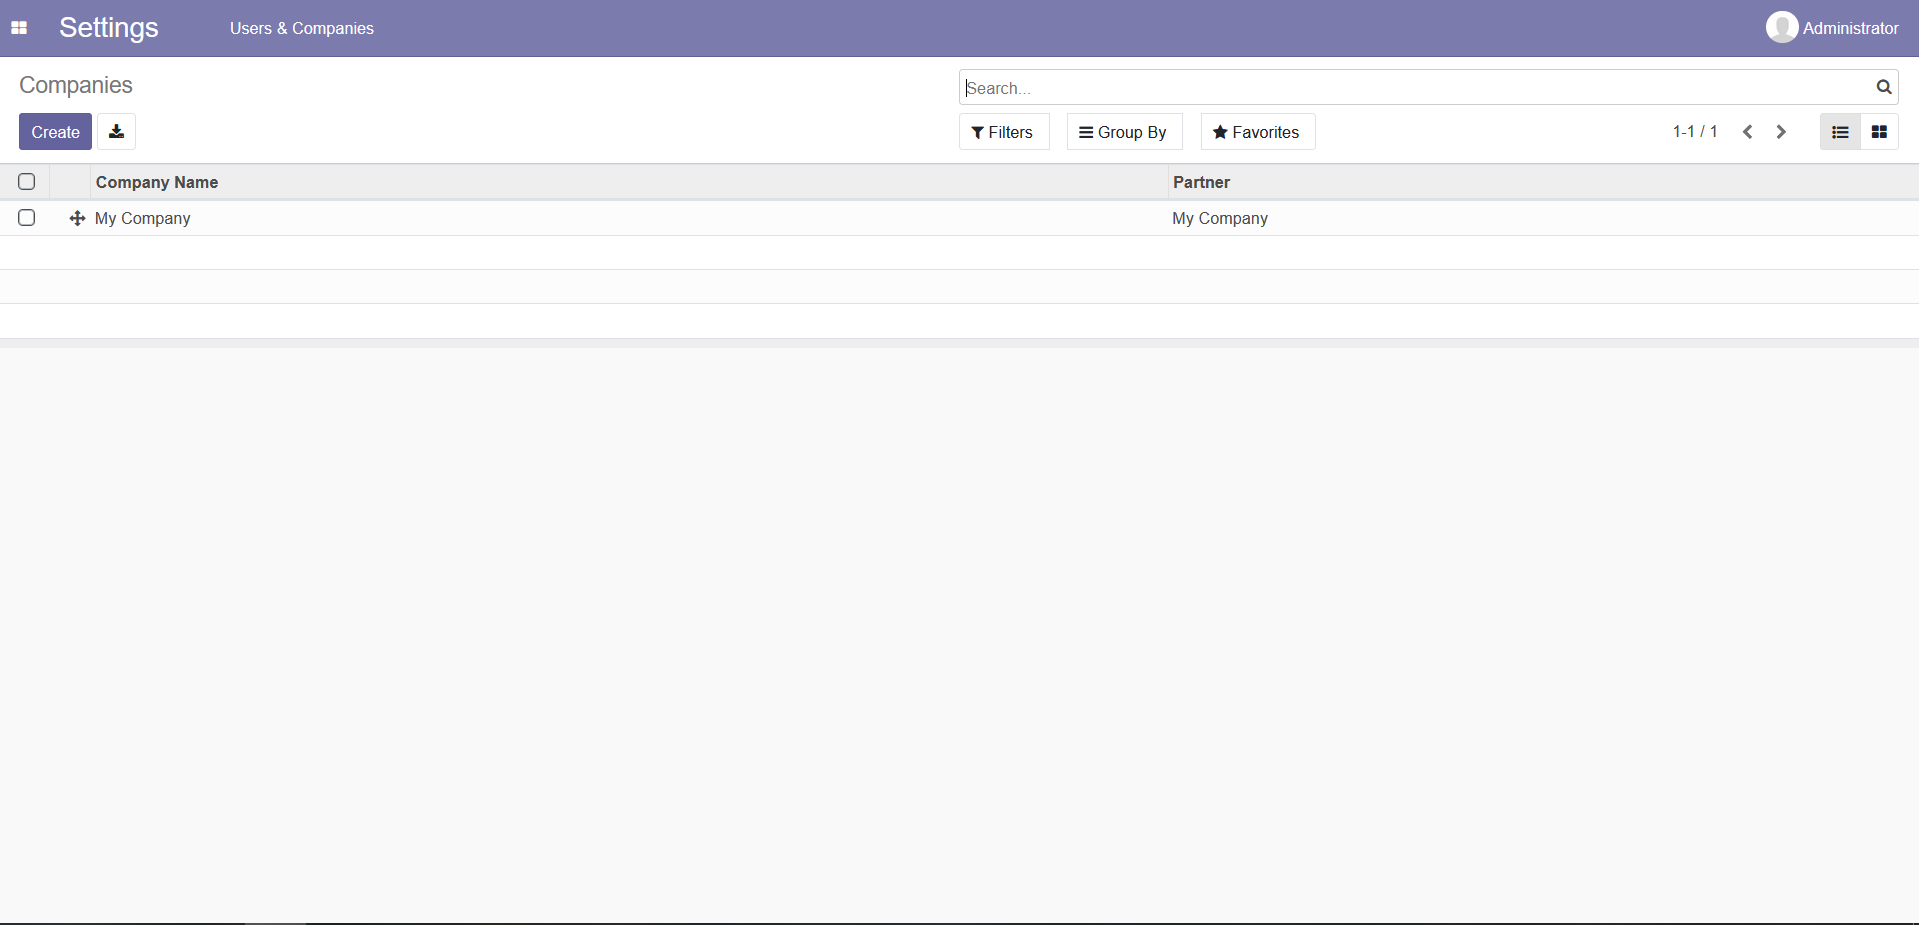
We have in front of us the list of companies , we can see that we have only one company present on the application. Let's click on the create button to create a new company.
Let's fill in the blanks:
- Company Name:
Datascientest company 2 - Email:
company2@datascientest.com
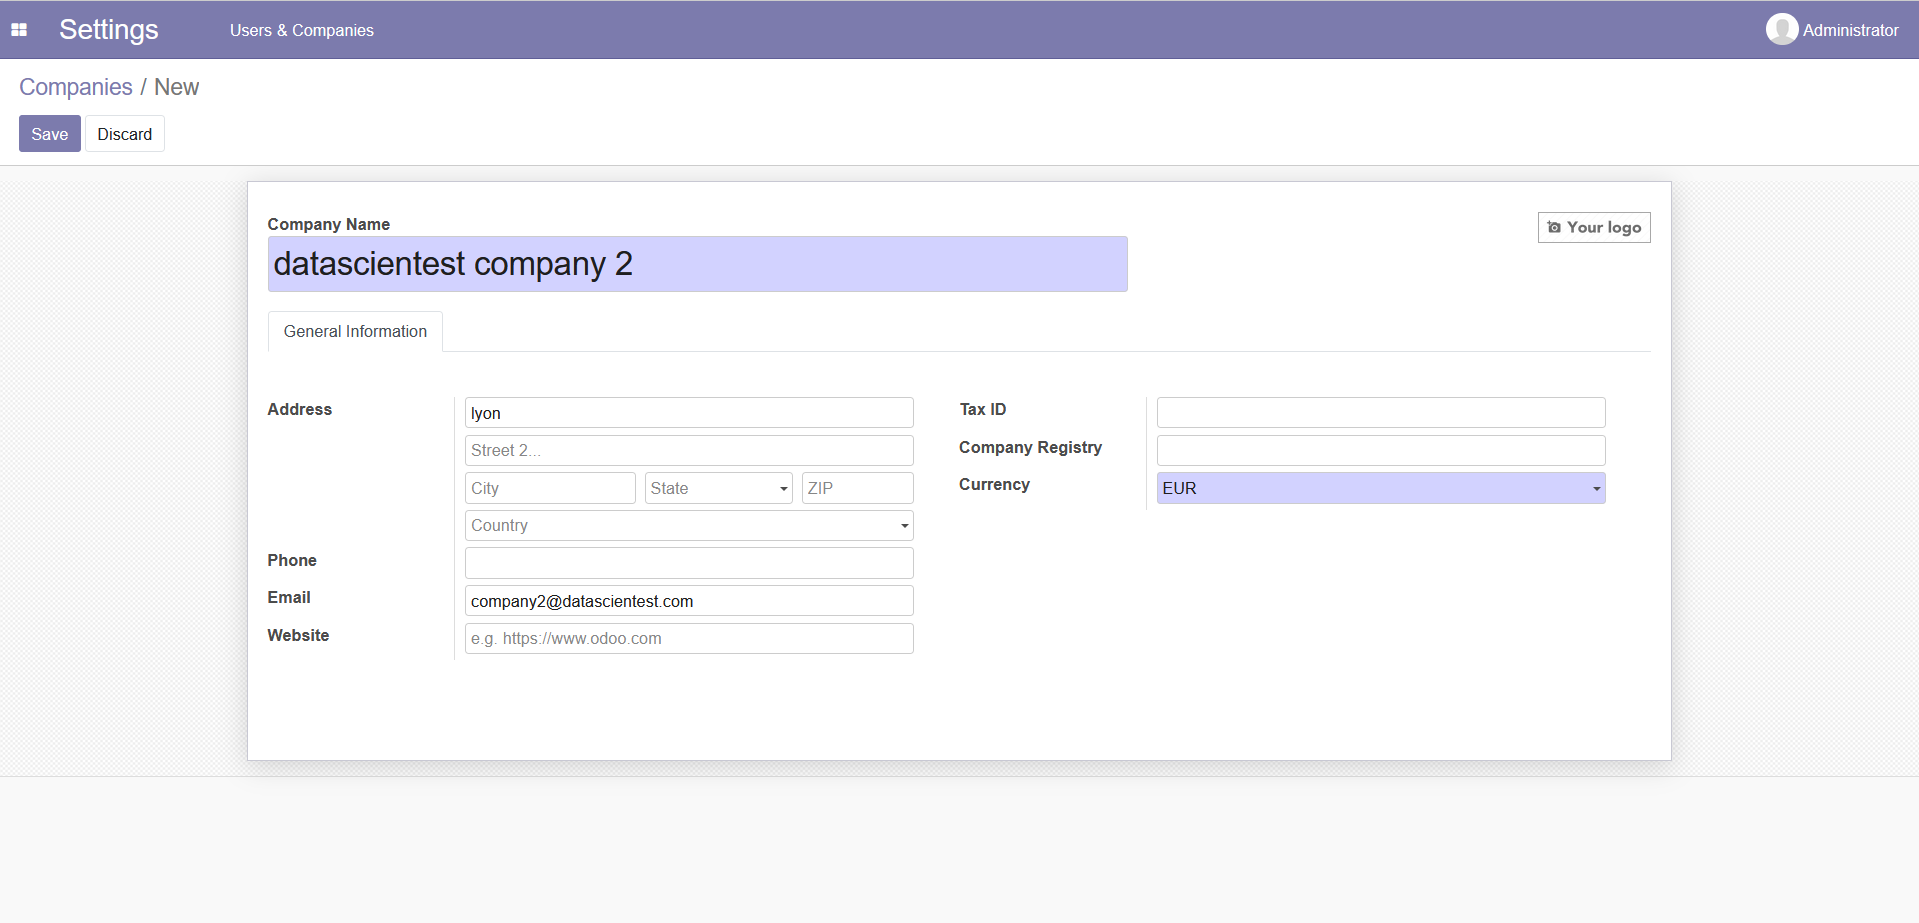
once done, let's press the save button.
We now have 02 companies present:
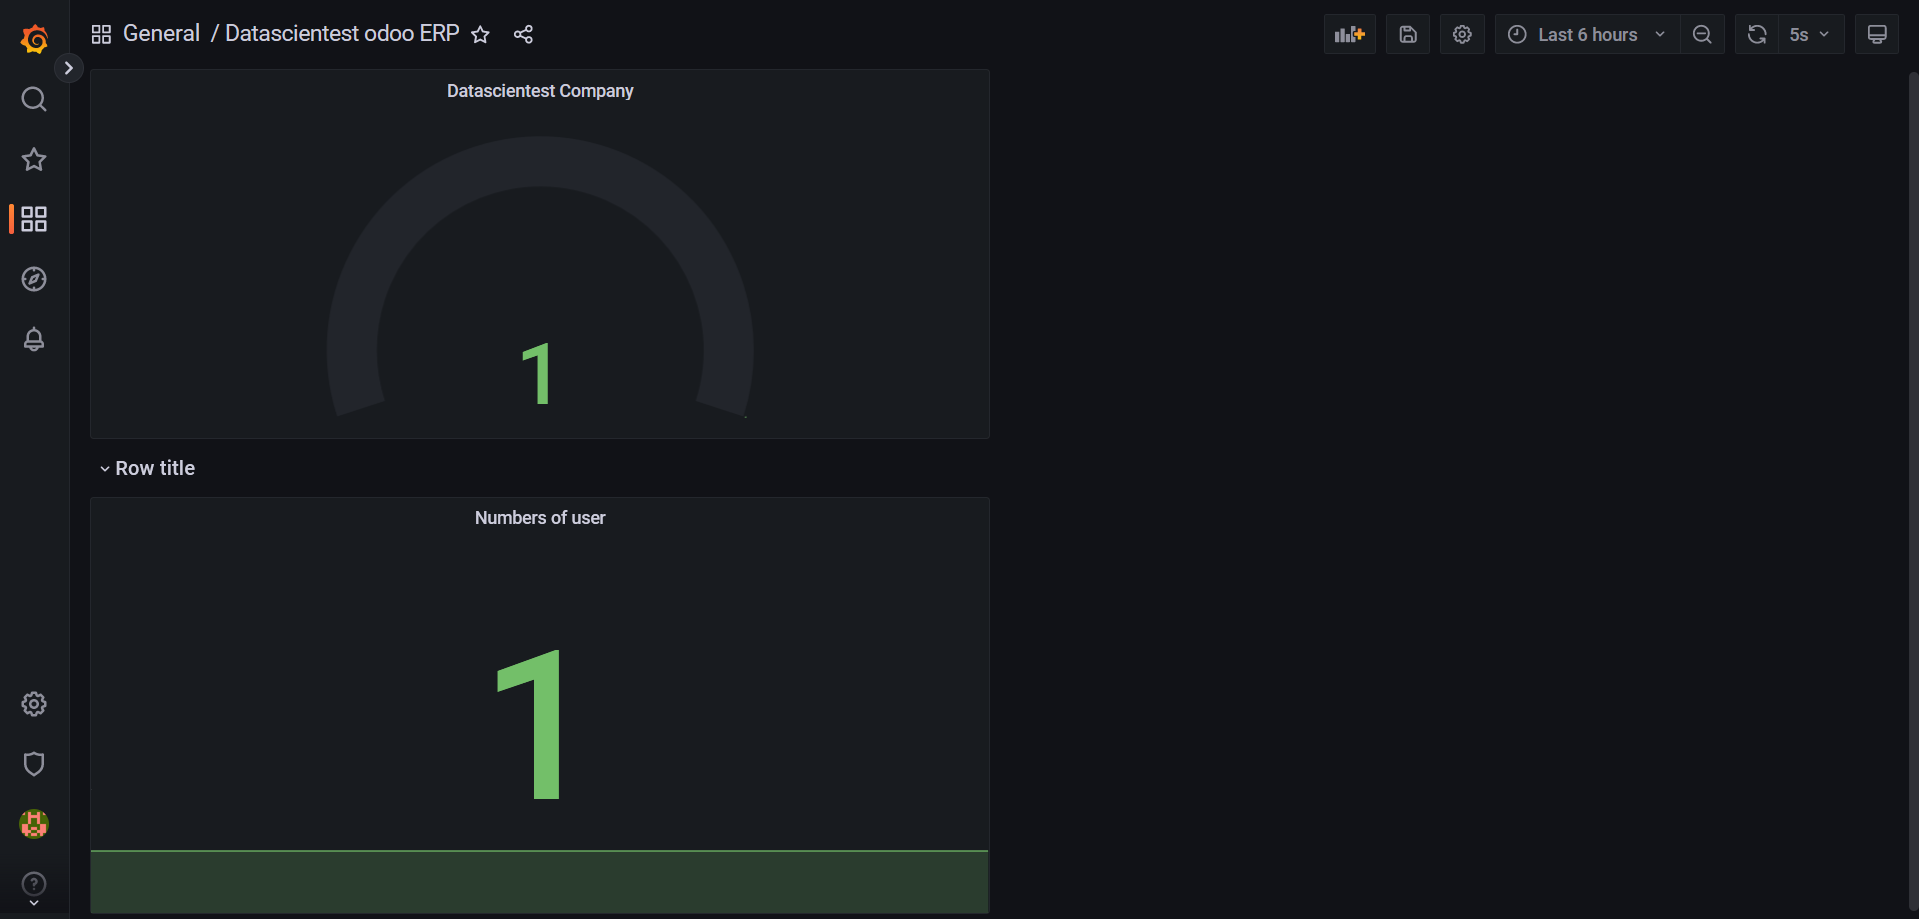
Let's now connect to our Grafana instance to check how many companies we now have:
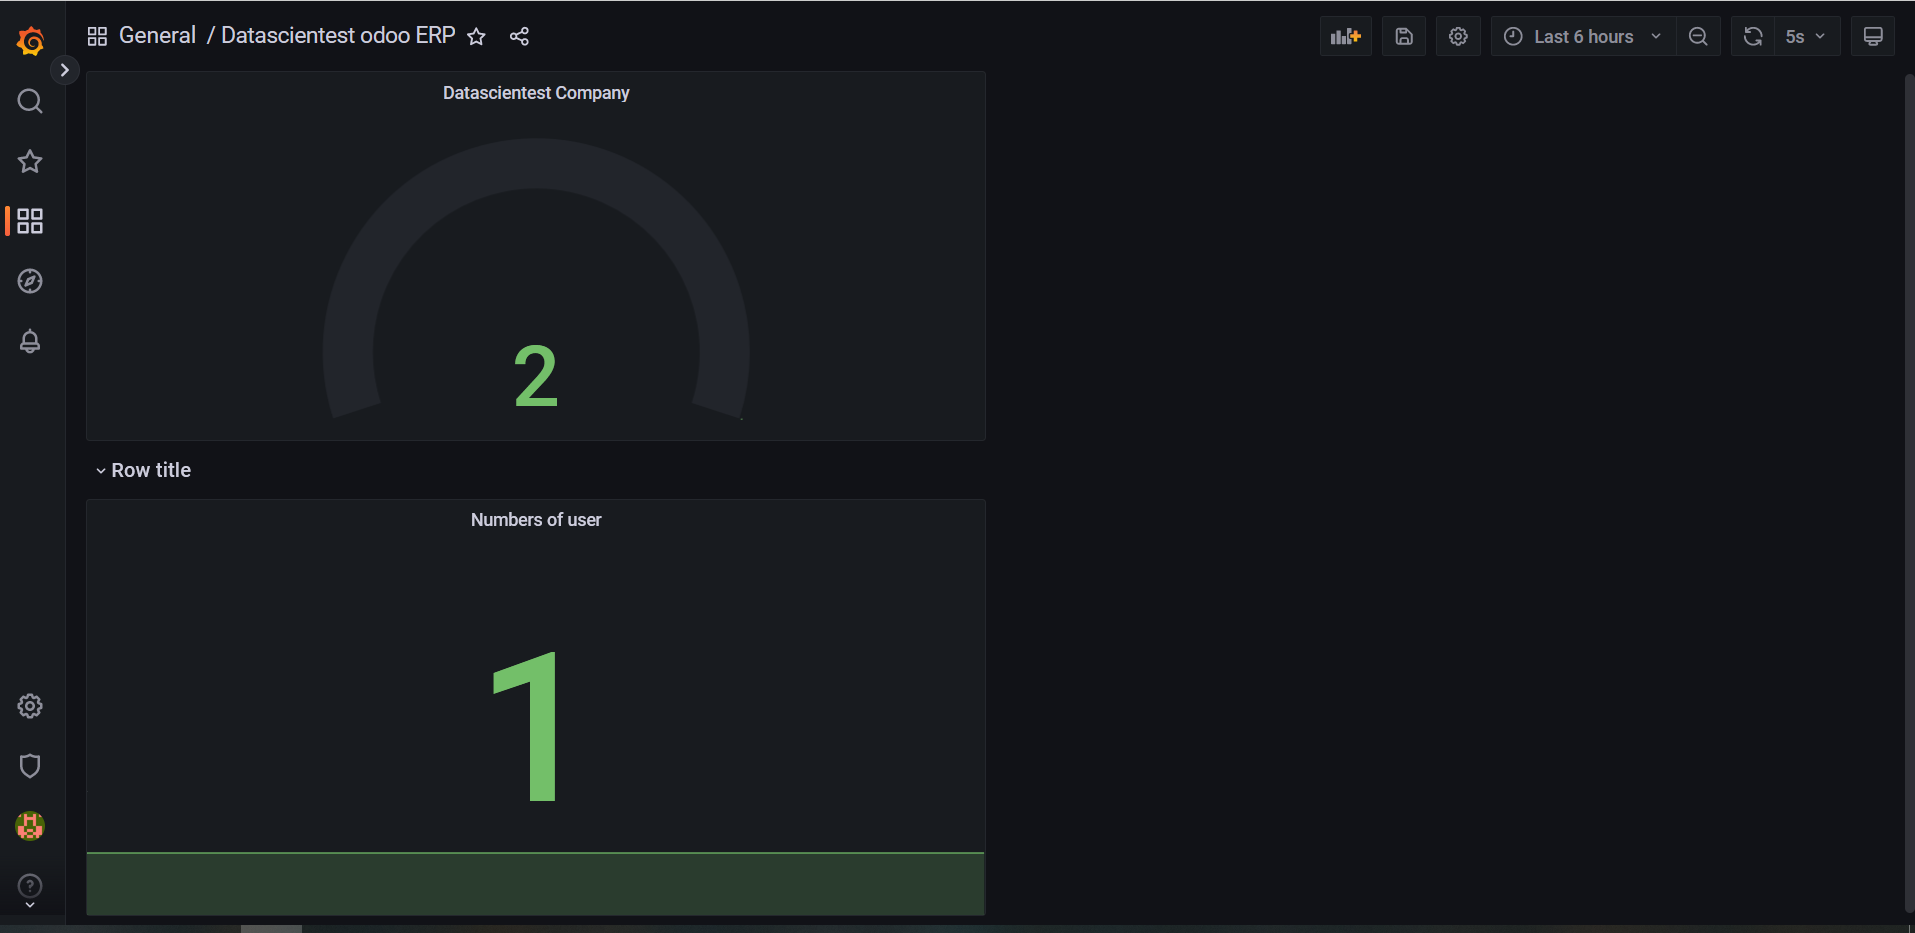
We do have the update performed on our interface. We can also change the frequency at which Grafana will fetch data from the data source
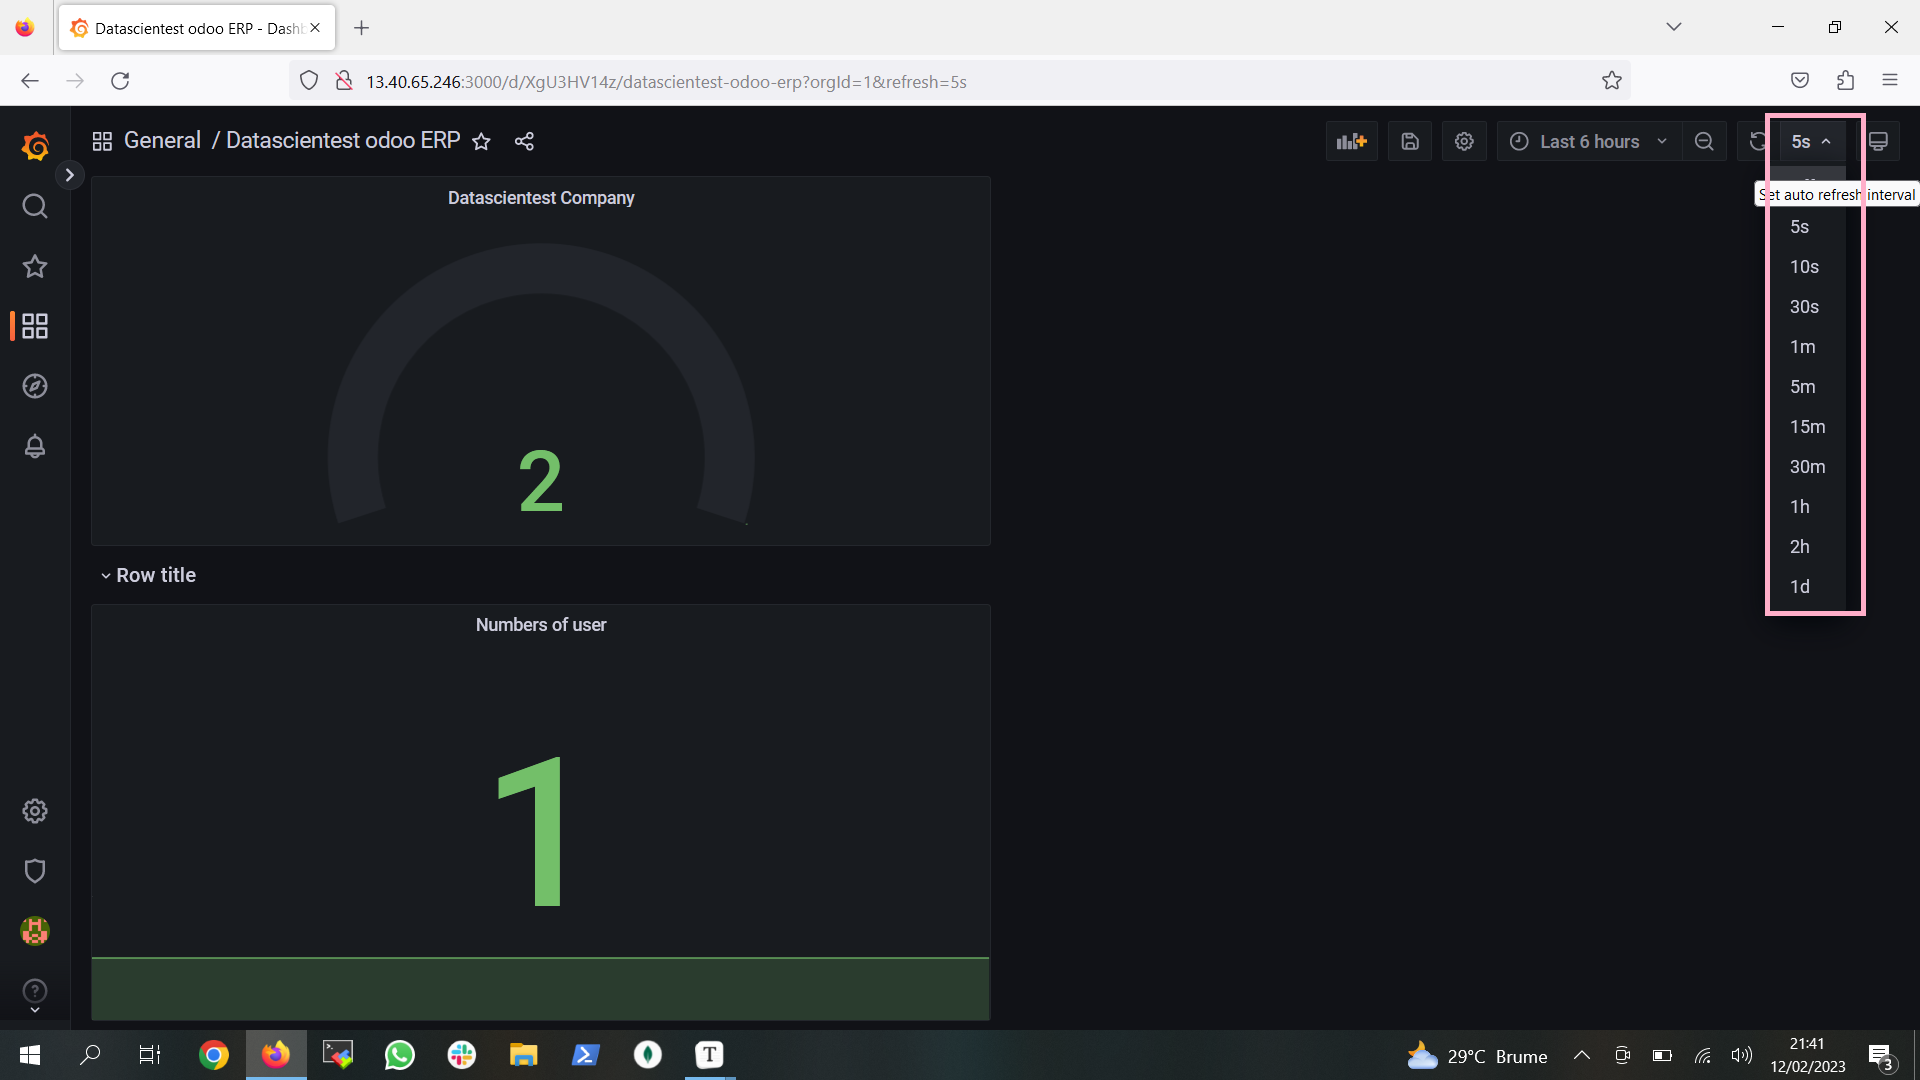
We can choose 5s so that our dashboard is fed every 5s.We can also ask Grafana to retrieve metrics at a given period or by defining the interval during which we want to retrieve our metrics.