Linux — Tools to Analyze Network Performance
Linux - 分析網路效能的工具

In my last article I introduced tools such as ping , ip , ss and sar to measure network performance. Using these tools/commands, you can quickly check network performance indicators such as bandwidth, throughput, and latency.
在上一篇文章中,我介紹了測量網路效能的工具,例如 ping 、ip 、sar 。使用這些工具/指令,您可以快速檢查網路效能指標,例如頻寬、吞吐量和延遲。
But none of these tools are suitable for network packet capture and analysis, therefore even you notice that the network performance is having issue, it is hard to find the root cause.
但這些工具都不適用於網路封包擷取與分析,因此即使您發現網路效能出現問題,也很難找到根本原因。
tcpdump and wireshark tcpdump 和 wireshark
tcpdump and wireshark are the most commonly used network packet capture and analysis tools, and they are also indispensable tools for analyzing network performance.wireshark 是最常用的網路封包擷取與分析工具,也是分析網路效能不可或缺的工具。
tcpdumponly supports the command line format, and is often used to capture and analyze network packets in the server.tcpdump僅支援命令列格式,常用於擷取和分析伺服器中的網路封包。- In addition to capturing packets,
wiresharkalso provides a powerful graphical interface and summary analysis tools, which are particularly simple and practical when analyzing complex network scenarios.
除了擷取封包之外,wireshark還提供強大的圖形介面和摘要分析工具,在分析複雜的網路情境時特別簡單實用。
Therefore, in the actual analysis of network performance, it is also a common method to use tcpdump to capture packets first, and then use wireshark to analyze.
因此,在實際分析網路效能時,先使用 wireshark 進行分析,也是常用的方法。
Due to wireshark’s graphical interface, it cannot be used over SSH, so I recommend you install it on a local machine (eg Windows). You can go to https://www.wireshark.org/ to download and install wireshark.
由於wireshark的圖形化介面,它無法透過 SSH 使用,所以我建議您將它安裝在本機 (例如 Windows)。您可以到 wireshark 。
Case analysis 案例分析
Let’s use ping command to check the “google.com.hk” domain and examine the output:
讓我們使用 ping 指令檢查「google.com.hk」網域,並檢查輸出:
$ ping -c3 google.com.hk
PING google.com.hk (172.217.14.227) 56(84) bytes of data.
64 bytes from sea30s02-in-f3.1e100.net (172.217.14.227): icmp_seq=1 ttl=102 time=71.6 ms
64 bytes from sea30s02-in-f3.1e100.net (172.217.14.227): icmp_seq=2 ttl=102 time=72.4 ms
64 bytes from sea30s02-in-f3.1e100.net (172.217.14.227): icmp_seq=3 ttl=102 time=70.4 ms--- google.com.hk ping statistics ---
3 packets transmitted, 3 received, 0% packet loss, time 11003ms
rtt min/avg/max/mdev = 70.466/71.497/72.420/0.830 ms
According to the ping output, you can find that the IP address resolved by google.com.hk is 172.217.14.227, and the last three ping requests are all responded with a delay (RTT) of a little more than 70ms.
根據 ping 輸出,您可以發現 google.com.hk 解析的 IP 位址是 172.217.14.227,而最近三次的 ping 請求都以超過 70 毫秒的延遲 (RTT) 回應。
But what’s interesting about the output is: 3 times of sending, 3 times of receiving, no packet loss, but the total time of sending and receiving three times is more than 11s (11003ms), which is a bit strange.
但是輸出結果有趣的地方在於傳送 3 次,接收 3 次,沒有丟包,但傳送和接收 3 次的總時間超過 11s (11003ms),有點奇怪。
Let’s use tcpdump to capture the ping command packets and see what’s going on:
讓我們使用 ping 指令封包,看看發生了什麼事:
$ tcpdump -nn udp port 53 or host google.com.hk
tcpdump: verbose output suppressed, use -v or -vv for full protocol decode
listening on eth0, link-type EN10MB (Ethernet), capture size 262144 bytes
Let me explain this command in detail.
讓我詳細解釋這個指令。
-nn, indicating that the no reverse domain resolution.-nn,表示沒有反向網域解析。udp port 53, means to display only the packets whose port number (including source port and destination port) of UDP protocol is 53.udp連接埠 53,表示只顯示 UDP 通訊協定連接埠號碼 (包括來源連接埠和目的地連接埠) 為 53 的封包。host google.com.hk, which means that only the packets whose destination domain name(including source address and destination address) is google.com.hk are displayed.hostgoogle.com.hk,即只顯示目的地網域名稱 (包括來源位址和目的地位址) 為 google.com.hk 的封包。- The “or” in the middle of these two filter conditions represents the relationship of or, that is to say, as long as either of the above two conditions is satisfied, it can be displayed.
這兩個篩選條件中間的 「或 」代表或的關係,也就是說,只要滿足上述兩個條件中的任何一個,就可以顯示。
Now let’s ping google.com.hk again:
現在讓我們再次 ping google.com.hk:
$ ping -c3 google.com.hk
PING google.com.hk (172.217.14.227) 56(84) bytes of data.
64 bytes from sea30s02-in-f3.1e100.net (172.217.14.227): icmp_seq=1 ttl=102 time=68.0 ms
64 bytes from sea30s02-in-f3.1e100.net (172.217.14.227): icmp_seq=2 ttl=102 time=67.6 ms
64 bytes from sea30s02-in-f3.1e100.net (172.217.14.227): icmp_seq=3 ttl=102 time=68.9 ms--- google.com.hk ping statistics ---
3 packets transmitted, 3 received, 0% packet loss, time 12001ms
rtt min/avg/max/mdev = 67.614/68.184/68.905/0.616 ms
Now the tcpdump command should captured the following:
現在 tcpdump 指令應該會捕捉到下列內容:
...
1. 23:19:54.915265 IP 172.31.82.28.50824 > 114.114.114.114.53: 50728+ A? google.com.hk. (31)
2. 23:19:54.934391 IP 114.114.114.114.53 > 172.31.82.28.50824: 50728 1/0/0 A 172.217.14.227 (47)
3. 23:19:54.934670 IP 172.31.82.28 > 172.217.14.227: ICMP echo request, id 19688, seq 1, length 64
4. 23:19:55.002680 IP 172.217.14.227 > 172.31.82.28: ICMP echo reply, id 19688, seq 1, length 64
5. 23:19:55.003016 IP 172.31.82.28.33805 > 114.114.114.114.53: 1446+ PTR? 227.14.217.172.in-addr.arpa. (45)
6. 23:20:00.022173 IP 114.114.114.114.53 > 172.31.82.28.33805: 1446 1/0/0 PTR sea30s02-in-f3.1e100.net. (83)
7. 23:20:05.545101 IP 172.31.82.28 > 172.217.14.227: ICMP echo request, id 19688, seq 2, length 64
8. 23:20:05.551284 IP 172.217.14.227 > 172.31.82.28: ICMP echo reply, id 19688, seq 2, length 64
9. 23:20:05.582363 IP 172.31.82.28 > 172.217.14.227: ICMP echo request, id 19688, seq 3, length 64
10. 23:20:05.552506 IP 172.217.14.227 > 172.31.82.28: ICMP echo reply, id 19688, seq 3, length 64
Let me explain the above output:
讓我解釋一下上述輸出:
50728+indicates the query ID value, which also appears in the response, and the plus sign indicates that recursive queries are enabled.50728+表示查詢 ID 值,它也會出現在回應中,加號表示已啟用遞迴查詢。A?means query A records.A?表示查詢 A 記錄。google.com.hkindicates the domain name to be queriedgoogle.com.hk表示要查詢的網域名稱31indicates the packet length.31表示封包長度。- The next one is the DNS response sent back from 114.114.114.114 — the A record value for the domain name google.com.hk. is 172.217.14.227.
下一個是從 114.114.114.114 傳回的 DNS 回應 - 網域名稱 google.com.hk 的 A 記錄值是 172.217.14.227。 - The third and fourth items are ICMP echo request and ICMP echo reply. The timestamp doesn’t seem to be a problem.
第三和第四項是 ICMP echo request 和 ICMP echo reply。時間戳似乎沒有問題。 - But the next two reverse address resolution PTR requests are more suspicious. Because we only see the request packet, but no response packet. If you look closely at their time, you will find that the next network packet does not appear until 5s after the two records are sent, and the two PTR records consume almost 10s.
但是接下來的兩個反向位址解析 PTR 請求就比較可疑了。因為我們只看到請求封包,卻沒看到回應封包。如果仔細觀察它們的時間,就會發現下一個網路封包是在這兩個記錄傳送完後 5s 才出現的,而這兩個 PTR 記錄就消耗了差不多 10s。 - Looking further down, the last four packets are two normal ICMP requests and responses, they look normal.
再往下看,最後四個封包是兩個正常的 ICMP 請求與回應,它們看起來很正常。
At this point, in fact, we have found the root cause of the slow ping, which is caused by the timeout of the two PTR requests that were not responded. The purpose of PTR reverse address resolution is to find out the domain name from the IP address, but in fact, not all IP addresses have PTR records defined, so the PTR query is likely to fail.
至此,其實我們已經找到 ping 緩慢的根本原因,這是由於兩個 PTR 請求超時沒有回應所造成的。PTR 反向位址解析的目的是從 IP 位址找出網域名稱,但事實上,並非所有 IP 位址都定義了 PTR 記錄,因此 PTR 查詢很可能失敗。
To prove our concept, let’s prohibit the PTR from ping command and try again:
為了證明我們的概念,讓我們禁止 PTR ping 指令,然後再試一次:
$ ping -n -c3 google.com.hk
PING google.com.hk (172.217.14.227) 56(84) bytes of data.
64 bytes from 172.217.14.227: icmp_seq=1 ttl=102 time=67.5 ms
64 bytes from 172.217.14.227: icmp_seq=2 ttl=102 time=67.5 ms
64 bytes from 172.217.14.227: icmp_seq=3 ttl=102 time=67.5 ms--- google.com.hk ping statistics ---
3 packets transmitted, 3 received, 0% packet loss, time 2003ms
rtt min/avg/max/mdev = 67.547/67.572/67.593/0.213 ms
The new packet capture of tcpdump :tcpdump 的新封包擷取:
23:36:26.704748 IP 172.31.82.28.55912 > 114.114.114.114.53: 32013+ A? google.com.hk. (31)
23:36:26.725931 IP 114.114.114.114.53 > 172.31.82.28.55912: 32013 1/0/0 A 172.217.14.227 (47)
23:36:26.726153 IP 172.31.82.28 > 172.217.14.227: ICMP echo request, id 21735, seq 1, length 64
23:36:26.793678 IP 172.217.14.227 > 172.31.82.28: ICMP echo reply, id 21735, seq 1, length 64
23:36:27.727869 IP 172.31.82.28 > 172.217.14.227: ICMP echo request, id 21735, seq 2, length 64
23:36:27.795426 IP 172.217.14.227 > 172.31.82.28: ICMP echo reply, id 21735, seq 2, length 64
23:36:28.729637 IP 172.31.82.28 > 172.217.14.227: ICMP echo request, id 21735, seq 3, length 64
23:36:28.797177 IP 172.217.14.227 > 172.31.82.28: ICMP echo reply, id 21735, seq 3, length 6
You can find that it only takes 2s to end now, which is much faster than the 11s previously.
您可以發現現在只需要 2 秒就可以結束,比之前的 11 秒快多了。
tcpdump
After the troubleshooting of the above use case, you now know that tcpdump is one of the most commonly used network analysis tools. It is based on libpcap and uses the AF_PACKET socket in the kernel to capture the network packets transmitted in the network interface; and provides powerful filtering rules to help you pick out the most important information from a large number of network packets.
在上述使用個案的疑難排解之後,您現在知道 tcpdump 是最常用的網路分析工具之一。它基於 AF_PACKET 套接字來擷取在網路介面傳輸的網路封包;並提供強大的過濾規則,協助您從大量的網路封包中挑出最重要的資訊。
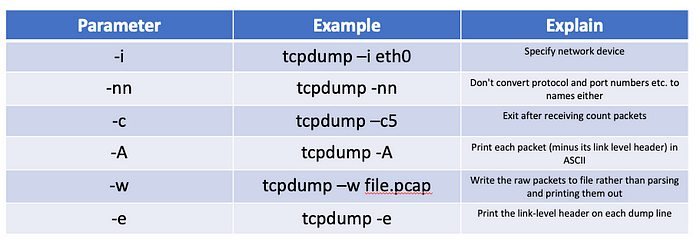
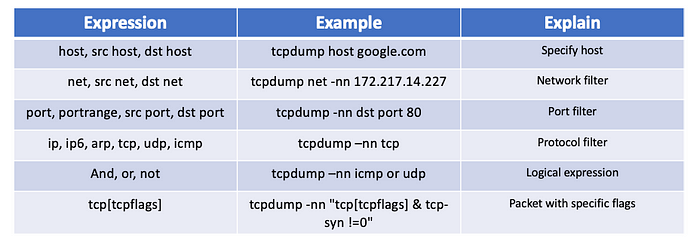
In order to help you get started with the use of tcpdump faster, I have summarized some of the most common usages for you below:
為了幫助您更快地開始使用 tcpdump,我在下面為您總結了一些最常見的用法:

Commonly used filters for tcpdump :tcpdump 的常用篩選器:

Although tcpdump is powerful, the output format is not intuitive. Especially, when the number of network packets in the system is relatively large (for example, the PPS exceeds several thousand), it is not easy to analyze the problem from the network packets captured by tcpdump.tcpdump雖然功能強大,但輸出格式並不直觀。特別是當系統中的網路封包數量較多(例如 PPS 超過幾千個)時,要從 tcpdump 擷取的網路封包中分析出問題並不容易。
wireshark
Wireshark is also one of the most popular network analysis tools, and its biggest advantage is that it provides a cross-platform graphical interface. Similar to tcpdump, wireshark also provides powerful filtering rule expressions, as well as a series of built-in summary analysis tools.
Wireshark 也是最受歡迎的網路分析工具之一,它最大的優勢在於提供跨平台的圖形介面。與 wireshark 也提供強大的過濾規則表達式,以及一系列內建的摘要分析工具。
For example, taking the ping case just now, you can execute the following command to save the captured network packets to the ping.pcap file:
例如,以剛才的 ping 為例,您可以執行下列指令,將擷取到的網路封包儲存到 ping.pcap 檔案:
$ tcpdump -nn udp port 53 or host google.com.hk -w ping.pcapNext, copy it to the machine where you have wireshark installed, and load the file, you should see something like this:
接下來,將它複製到安裝了 wireshark 的機器上,載入檔案,您應該會看到類似這樣的內容:
From the interface of wireshark, you can find that it not only displays the header information of each network packet in a more regular format; it also displays two different protocols, DNS and ICMP, in different colors. You can also see at a glance that there are no response packets for the two PTR queries in the middle.
從 wireshark 的介面,您可以發現它不僅以較規範的格式顯示每個網路封包的標頭資訊;還以不同的顏色顯示 DNS 和 ICMP 這兩種不同的通訊協定。您也可以一眼看出中間的兩個 PTR 查詢沒有回應封包。
Next, after selecting a network package in the network package list, you can also see the detailed information of the package at each layer of the protocol stack in the network package details below it. For example, take the PTR packet numbered 5 as an example:
接下來,在網路封包清單中選擇網路封包後,還可以在其下方的網路封包詳細資訊中看到該封包在通訊協定堆疊各層的詳細資訊。例如,以編號為 5 的 PTR 封包為例:
You can see the general information of the source address and destination address of the IP layer (Internet Protocol), the UDP protocol (User Datagram Protocol) of the transport layer, and the DNS protocol (Domain Name System) of the application layer.
您可以看到 IP 層(網際網路協定)的來源位址和目的地位址、傳輸層的 UDP 通訊協定(使用者資料報通訊協定)和應用層的 DNS 通訊協定(網域名稱系統)等一般資訊。
From the menu bar, if you click Statistics -> Flow Graph , and then select TCP Flows in the Flow type in the pop-up interface. You can see more clearly the execution process of the TCP flow in the whole process:
從功能表列中,如果您點選 Statistics -> Flow Graph ,然後在彈出的介面中選擇流量類型中的 TCP Flows。您可以更清楚地看到 TCP 流量在整個流程中的執行過程:
Of course, there are more ways to use wireshark than just these. For more ways to use it, you can also refer to the official documentation.
當然,使用 wireshark 的方法不只這些。如需更多使用方法,您也可以參考 官方說明文件。
Conclusion 總結
In this article, I introduced how to use tcpdump and wireshark together, and through several cases, I showed you how to use these two tools to analyze the transmission and reception process of the network and find out potential performance problems. I hope you enjoyed this sharing and will see you in my next article!
在這篇文章中,我介紹了如何搭配使用 wireshark 兩個工具,並透過幾個案例,讓大家了解如何使用這兩個工具來分析網路的傳送和接收過程,並找出潛在的效能問題。希望您喜歡這篇分享,我們下篇文章見!


