Prometheus and Grafana - Kubernetes Monitoring
 Stopped
VII - Monitoring Kubernetes
VII - Monitoring Kubernetes
a - Overview
Monitoring is a key pillar of DevOps best practice. It provides vital information on the performance and health of a platform. In a distributed environment such as Kubernetes and microservices, it's vital to have a monitoring solution such as Prometheus and Grafana available.
One of the great strengths of Kubernetes is its ability to scale your services and applications. When we reach thousands of applications, monitoring them manually or using scripts is not viable. We need to adopt a monitoring system that evolves too! That's where Prometheus and Grafana come in.
Prometheus will collect, store and enable us to exploit our platform metrics. On the other hand, Grafana will connect to Prometheus and allow us to create beautiful dashboards and graphs.
b - Architecture
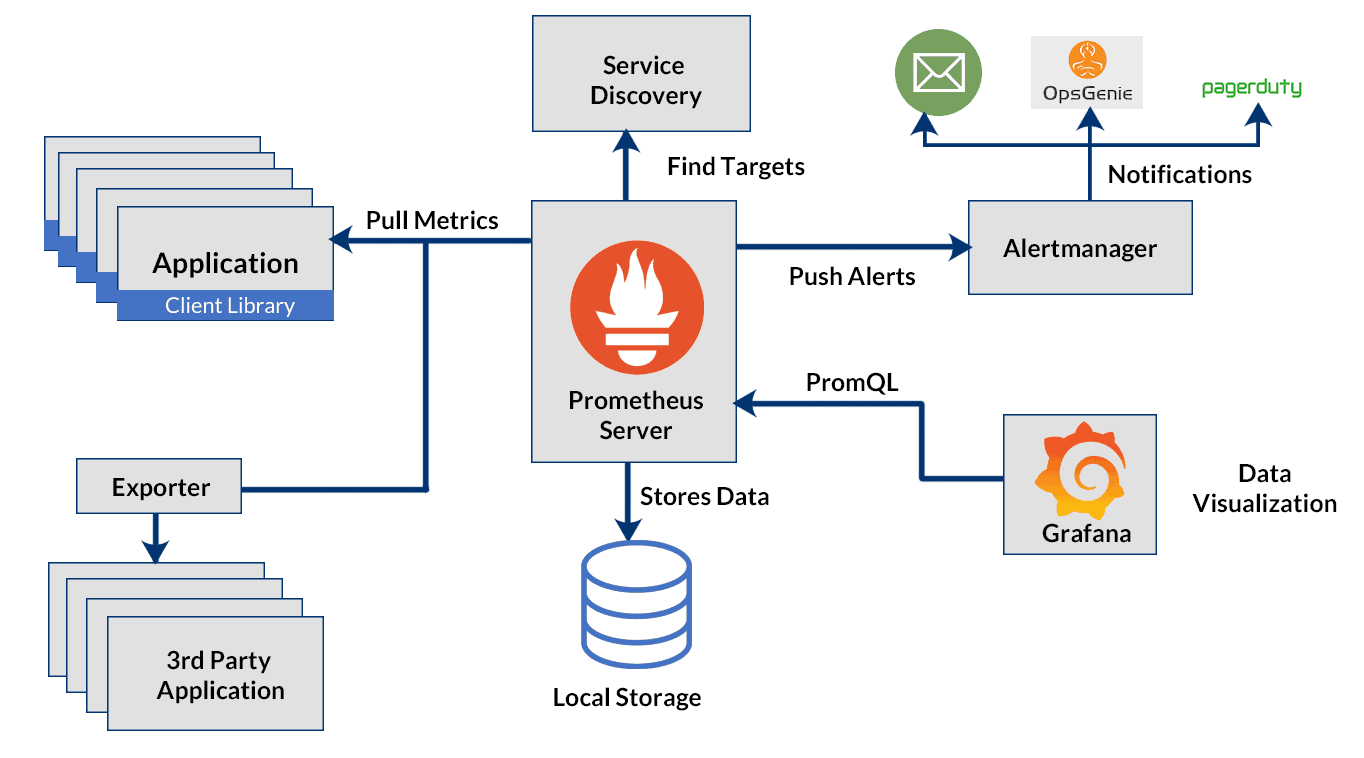
The architecture diagram to be implemented with Kubernetes shows that Prometheus is a multi-component monitoring system. The following elements are integrated into the Prometheus deployment:
The Prometheus server retrieves and stores time series data. It also provides a user interface for querying metrics.
Client libraries for instrumentation of application code.
Pushgateway supports the collection of metrics from short-run jobs
Exporters services that do not directly instrument Prometheus metrics.
Alertmanager manages real-time alerts based on triggers
c- Prometheus Operator

The Prometheus operator provides native Kubernetes deployment and management of Prometheus and associated monitoring components. The aim of this project is to simplify and automate the configuration of a Prometheus-based monitoring stack for Kubernetes clusters.
c.1 - Operators
An operator is an application-specific controller. It extends a Kubernetes API to create, configure and manage complex applications on behalf of humans (operations engineers or site reliability engineers). Operators are a kind of software extension of Kubernetes.
They provide a consistent approach to automatically managing all the application's operational processes, without any human intervention, which they achieve through close cooperation with the Kubernetes API.
The operators are built on two key Kubernetes principles: custom resources (CR for Customs Resources ), implemented here by means of custom resource definitions (CRD for Customs Resources Definition) and custom controllers.
A CR is an extension to the Kubernetes API that provides a location where we can store and retrieve structured data, the desired state of our application.
Custom controllers are used to observe this CR and, with the information received, take action to adjust the Kubernetes cluster to the desired state.
c.2 - The Prometheus operator
The main purpose of this operator is to simplify and automate the configuration and management of the Prometheus monitoring stack running on a Kubernetes cluster. Essentially, it's a custom controller that monitors new object types introduced via the following CRDs:
Prometheus: defines desired Prometheus deployments as StatefulSet
Alertmanager: defines a desired Alertmanager deployment
ServiceMonitor: declaratively specifies how Kubernetes service groups are to be monitored
PodMonitor: declaratively specifies how pod groups should be monitored
Probe: declaratively specifies how input groups or static targets are to be monitored
PrometheusRule: defines a desired set of Prometheus alert and/or registration rules
AlertmanagerConfig: declaratively specifies subsections of the Alertmanager configuration
C.3 - Why the Prometheus operator?
Using the operator can significantly reduce the effort involved in configuring, implementing and managing all the components of a Prometheus monitoring stack. It also provides dynamic updates of resources, such as alert rules and/or Prometheus, without downtime.
Using the CRDs introduced is relatively straightforward and provides a turnkey solution for adopting operational best practices for this stack. What's more, this approach enables multiple instances to be run, even with different versions of Prometheus.
In the classic Prometheus installation, adding new metric endpoints requires a server configuration update. This registers a new endpoint as a target for collecting metrics. The Prometheus operator uses Monitor objects ( PodMonitor, ServiceMonitor ) to dynamically discover endpoints and extract metrics.
Using the Prometheus operator saves us time on Prometheus installation and maintainability. It provides us with Monitor objects to dynamically collect metrics without updating the Prometheus configuration
d - Deploy Prometheus with the operator
kube-prometheus-stack is a collection of Kubernetes manifests, Grafana dashboards and Prometheus rules. It provides easy-to-use end-to-end Kubernetes cluster monitoring with Prometheus using the operator.
d.1 - Installing Kubernetes
We can install our Kubernetes cluster thanks to K3s:
curl -sfL https://get.k3s.io | sh -s - --write-kubeconfig-mode 644
Output display:
[INFO] Finding release for channel stable
[INFO] Using v1.25.6+k3s1 as release
[INFO] Downloading hash https://github.com/k3s-io/k3s/releases/download/v1.25.6+k3s1/sha256sum-amd64.txt
[INFO] Downloading binary https://github.com/k3s-io/k3s/releases/download/v1.25.6+k3s1/k3s
[INFO] Verifying binary download
[INFO] Installing k3s to /usr/local/bin/k3s
[INFO] Skipping installation of SELinux RPM
[INFO] Creating /usr/local/bin/kubectl symlink to k3s
[INFO] Creating /usr/local/bin/crictl symlink to k3s
[INFO] Creating /usr/local/bin/ctr symlink to k3s
[INFO] Creating killall script /usr/local/bin/k3s-killall.sh
[INFO] Creating uninstall script /usr/local/bin/k3s-uninstall.sh
[INFO] env: Creating environment file /etc/systemd/system/k3s.service.env
[INFO] systemd: Creating service file /etc/systemd/system/k3s.service
[INFO] systemd: Enabling k3s unit
Created symlink /etc/systemd/system/multi-user.target.wants/k3s.service → /etc/systemd/system/k3s.service.
[INFO] systemd: Starting k3s
We can now check the Kubernetes installation:
kubectl version --short
Output display:
Flag --short has been deprecated, and will be removed in the future. The --short output will become the default.
Client Version: v1.25.4+k3s1
Kustomize Version: v4.5.7
Server Version: v1.25.4+k3s1
We can notice that we have the Kubernetes version: Server Version: v1.25.4+k3s1 , the Kubectl client version: Client Version: v1.25.4+k3s1. We will talk about Kustomize in the rest of this course.
k3s provides us with a node on which we have all the components of a cluster, it's an "all-in-one" installation on which we have a master and worker in a single instance.
To perform this check, we can run the following command:
k3s kubectl get nodes
d.2 - Installing Helm
Prometheus Operator is available and deployable via Helm charts. We can deploy the monitoring stack in a single command line. We can install helm on our server with the following commands:
curl -fsSL -o get_helm.sh https://raw.githubusercontent.com/helm/helm/main/scripts/get-helm-3
chmod 700 get_helm.sh
./get_helm.sh
Output display:
Downloading https://get.helm.sh/helm-v3.11.1-linux-amd64.tar.gz
Verifying checksum... Done.
Preparing to install helm into /usr/local/bin
helm installed into /usr/local/bin/helm
d.3 - Installing kube-prometheus-stack with Helm
Let's add the Prometheus Charts repository and update the local cache using HELM:
mkdir.kube
kubectl config view --raw >.kube/config # export kubernetes config file so helm can talk to kubernetes api
chmod 600.kube/config
helm repo add prometheus-community https://prometheus-community.github.io/helm-charts
helm repo update
Deploy kube-stack-prometheus in the Namespace monitoring Helm:
helm install prometheus prometheus-community/kube-prometheus-stack --namespace monitoring --create-namespace --set grafana.service.type=NodePort --set promotheus.service.type=NodePort
Output display:
"prometheus-community" already exists with the same configuration, skipping
ubuntu@ip-172-31-26-97:~$ helm repo update
Hang tight while we grab the latest from your chart repositories...
...Successfully got an update from the "prometheus-community" chart repository
Update Complete. ⎈Happy Helming!⎈
ubuntu@ip-172-31-26-97:~$
helm install prometheus prometheus-community/kube-prometheus-stack --namespace monitoring --create-namespace --set grafana.service.type=NodePort --set promotheus.service.type=NodePort
NAME: prometheus
LAST DEPLOYED: Mon Feb 13 06:50:33 2023
NAMESPACE: monitoring
STATUS: deployed
REVISION: 1
NOTES:
kube-prometheus-stack has been installed. Check its status by running:
  kubectl --namespace monitoring get pods -l "release=prometheus"

Visit https://github.com/prometheus-operator/kube-prometheus for instructions on how to create & configure Alertmanager and Prometheus instances using the Operator.
The CRDs are now installed in Namespace. We can check with the following kubectl command:
kubectl get crds -n monitoring | grep monitoring
Output display:
alertmanagerconfigs.monitoring.coreos.com 2023-02-13T06:50:30Z
alertmanagers.monitoring.coreos.com 2023-02-13T06:50:30Z
podmonitors.monitoring.coreos.com 2023-02-13T06:50:31Z
probes.monitoring.coreos.com 2023-02-13T06:50:31Z
prometheuses.monitoring.coreos.com 2023-02-13T06:50:31Z
prometheusrules.monitoring.coreos.com 2023-02-13T06:50:31Z
servicemonitors.monitoring.coreos.com 2023-02-13T06:50:31Z
thanosrulers.monitoring.coreos.com 2023-02-13T06:50:31Z
Here's what we have running in Namespace:
kubectl get pods -n monitoring
Output display:
NAME READY STATUS RESTARTS AGE
alertmanager-kube-stack-prometheus-kube-alertmanager-0 2/2 Running 0 2m36s
kube-stack-prometheus-grafana-6994bd6c69-h6s9z 3/3 Running 0 13h
kube-stack-prometheus-kube-operator-86667b5cdf-cqndt 1/1 Running 0 13h
kube-stack-prometheus-kube-state-metrics-fc9878699-dpgh6 1/1 Running 0 13h
kube-stack-prometheus-prometheus-node-exporter-vrjsl 1/1 Running 0 13h
prometheus-kube-stack-prometheus-kube-prometheus-0 2/2 Running 0 13h
The Chart has installed the Prometheus components and the operator, Grafana. It has also installed the following exporters:
- prometheus-node-exporter exposes hardware and operating system metrics
- kube-state- metrics listens to the Kubernetes API server and generates object state metrics
Our monitoring stack with Prometheus and Grafana is ready
d.4 - Kubernetes metrics data with PromQL
We can run various PromQL queries to extract interesting and actionable metrics from our Kubernetes cluster. These queries will give us information on node health, pod health, cluster resource utilization, etc.
Of course, there are many types of queries we can write, and other useful queries are freely available. However, the queries we'll see here are a basic audit. These will give us an overall idea of a cluster's health.
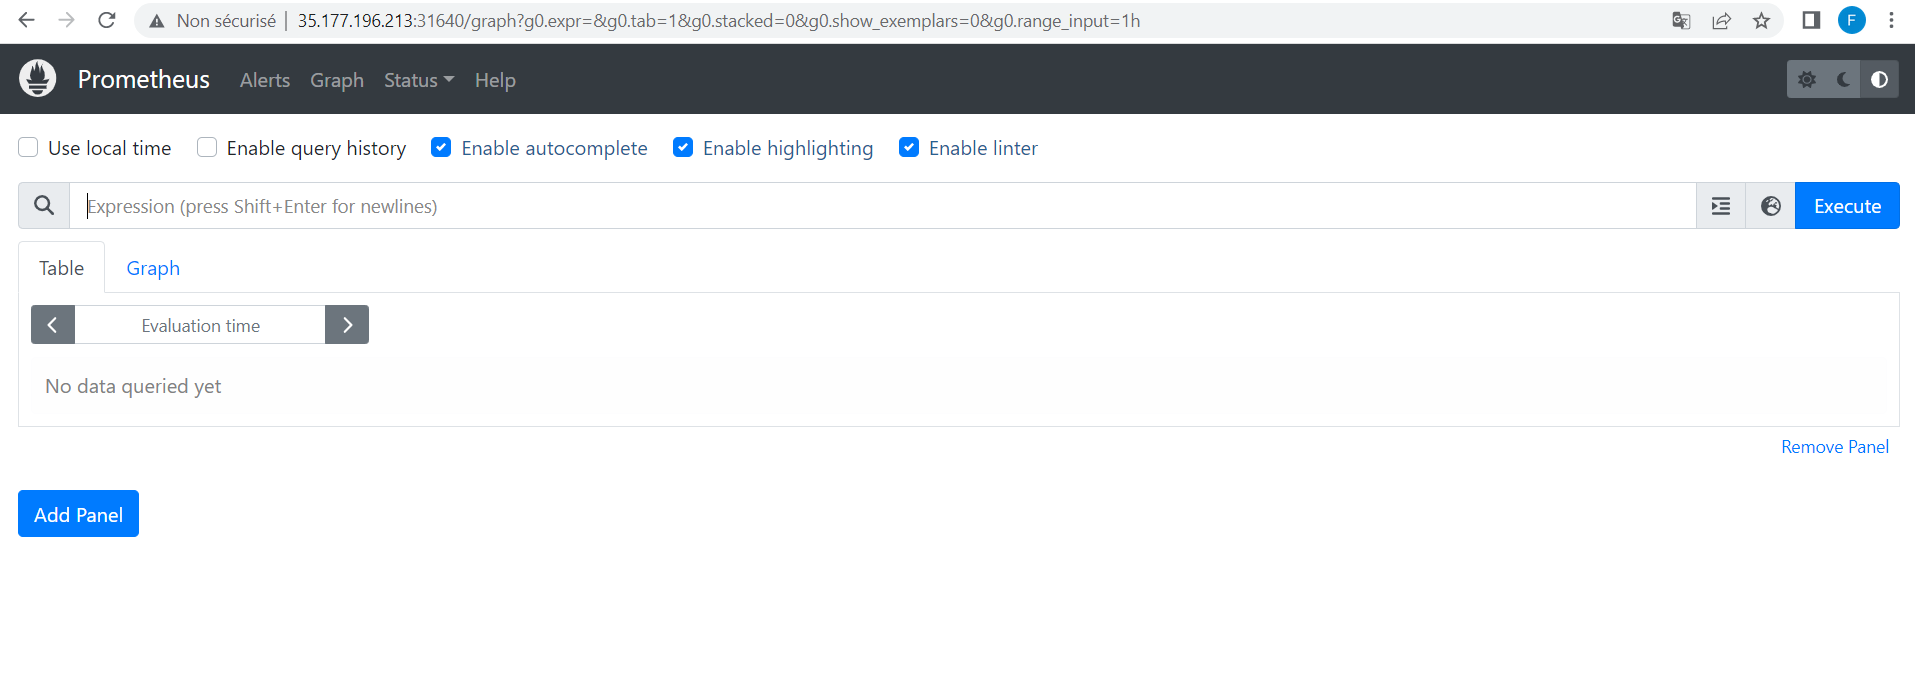
We'll be running all these queries in the Prometheus expression browser, so let's start by connecting to our Prometheus pod. To do this , we need to change the prometheus service type , which is currently ClusterIP , so not accessible from the outside . We'll run the following command:
kubectl edit svc prometheus-kube-prometheus-prometheus -n monitoring
vi will open the service configuration file prometheus-kube-prometheus-prometheus interactively. We'll need to press the i key on our keyboard in order to make changes to the YAML file . We need to delete 2 lines and monify the service type as follows:
- we need to replace the line
type: ClusterIPwithType: NodePort. - We need to delete the lines that start with
Clusterip: ......andClusterIPs :and press theECHAPkey on our keyboard , and we can write:wq!in order to save the modification on our file and quit the modification.In output we will have this:
service/prometheus-kube-prometheus-prometheus edited
We can then check the NodePort provided by our service:
kubectl get svc -n monitoring
Output display:
prometheus-kube-state-metrics ClusterIP 10.43.233.199 <none> 8080/TCP 4d9h
prometheus-grafana NodePort 10.43.57.217 <none> 80:31839/TCP 4d9h
prometheus-prometheus-node-exporter ClusterIP 10.43.49.240 <none> 9100/TCP 4d9h
prometheus-kube-prometheus-operator ClusterIP 10.43.98.228 <none> 443/TCP 4d9h
prometheus-kube-prometheus-alertmanager ClusterIP 10.43.198.102 <none> 9093/TCP 4d9h
alertmanager-operated ClusterIP None <none> 9093/TCP,9094/TCP,9094/UDP 4d9h
prometheus-operated ClusterIP None <none> 9090/TCP 4d9h
prometheus-kube-prometheus-prometheus NodePort 10.43.168.180 <none> 9090:31640/TCP 4d9h
We have port 31640 externally accessible to reach our Prometheus instance .
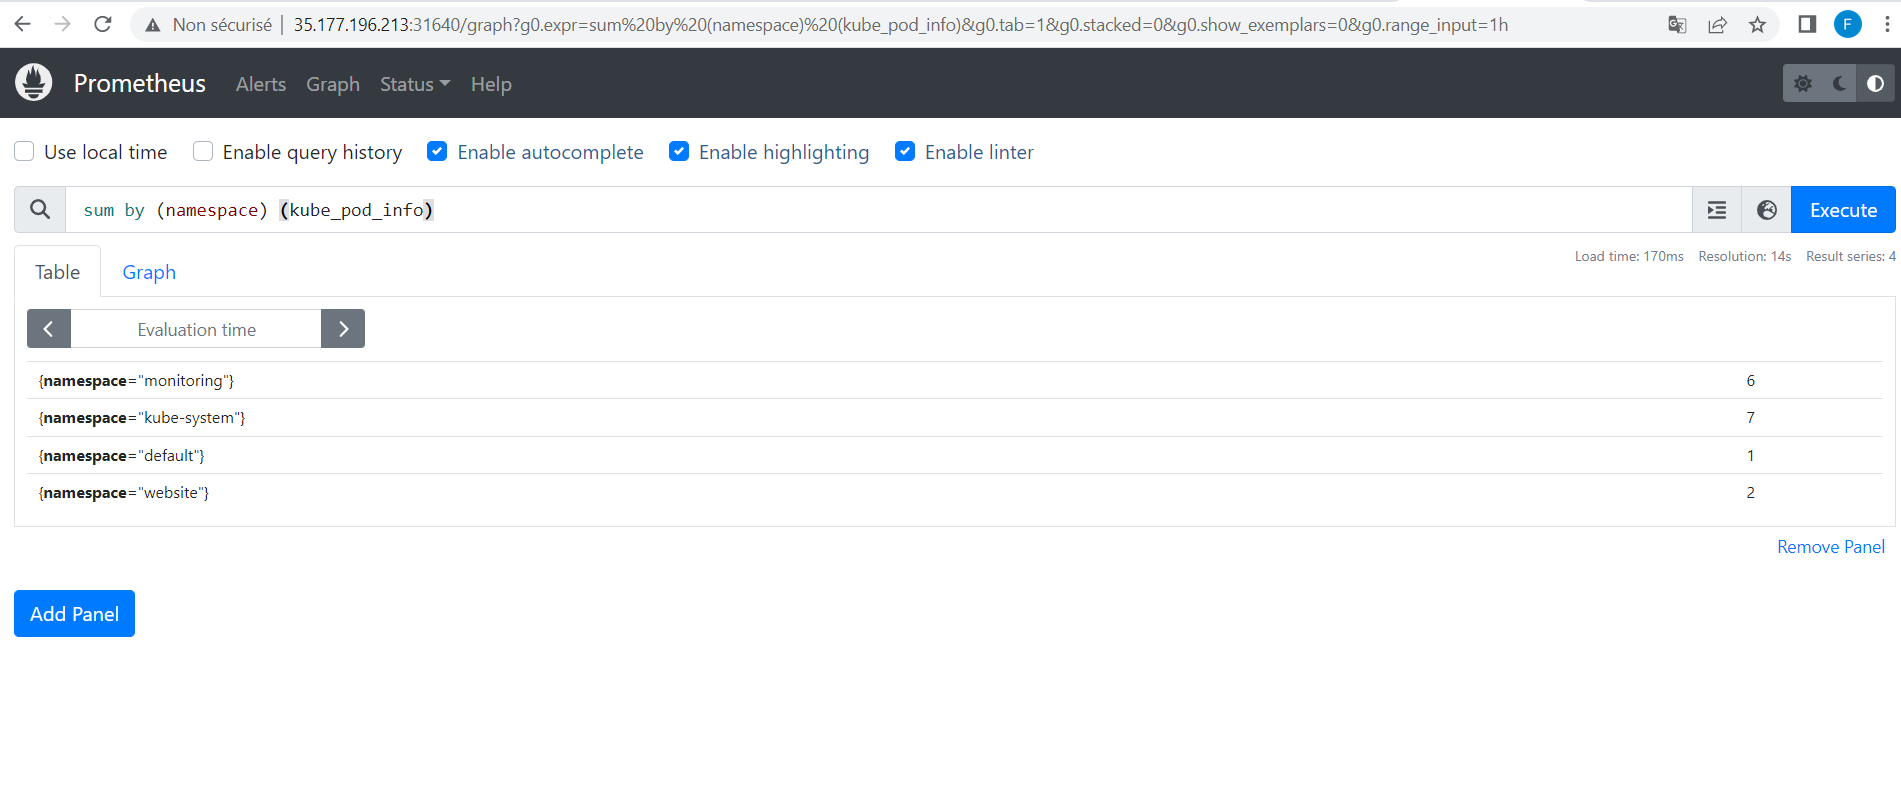
d.4.1: Find the number of pods per Namespace
To do this we can ask prometheus to provide us this number per Namespace on our cluster. We can run the following query:
sum by (namespace) (kube_pod_info)
d.4.2 - find the processor load for our object
Before executing a query, we'll create a Pod . Let's start by creating a charge-pod.yml file with the following contents:
apiVersion: v1
kind: Pod
metadata:
  labels:
    run: pod
  name: datascientest-charge-pod
spec:
  containers:
    - args:
        - cpu
      image: nginx
      name: charge-pod
      resources:
        requests:
          memory: "3000Mi"
          cpu: "2"
        limits:
          memory: "3000Mi"
          cpu: "2"
We can now create this object as follows:
kubectl apply -f charge-pod.yml
Output display:
pod/datascientest-charge-pod created
Now let's run the following query:
sum(kube_pod_container_resource_limits{resource="cpu"}) - sum(kube_node_status_capacity{resource="cpu"})
If this query returns a positive value, the cluster has overloaded the processor:
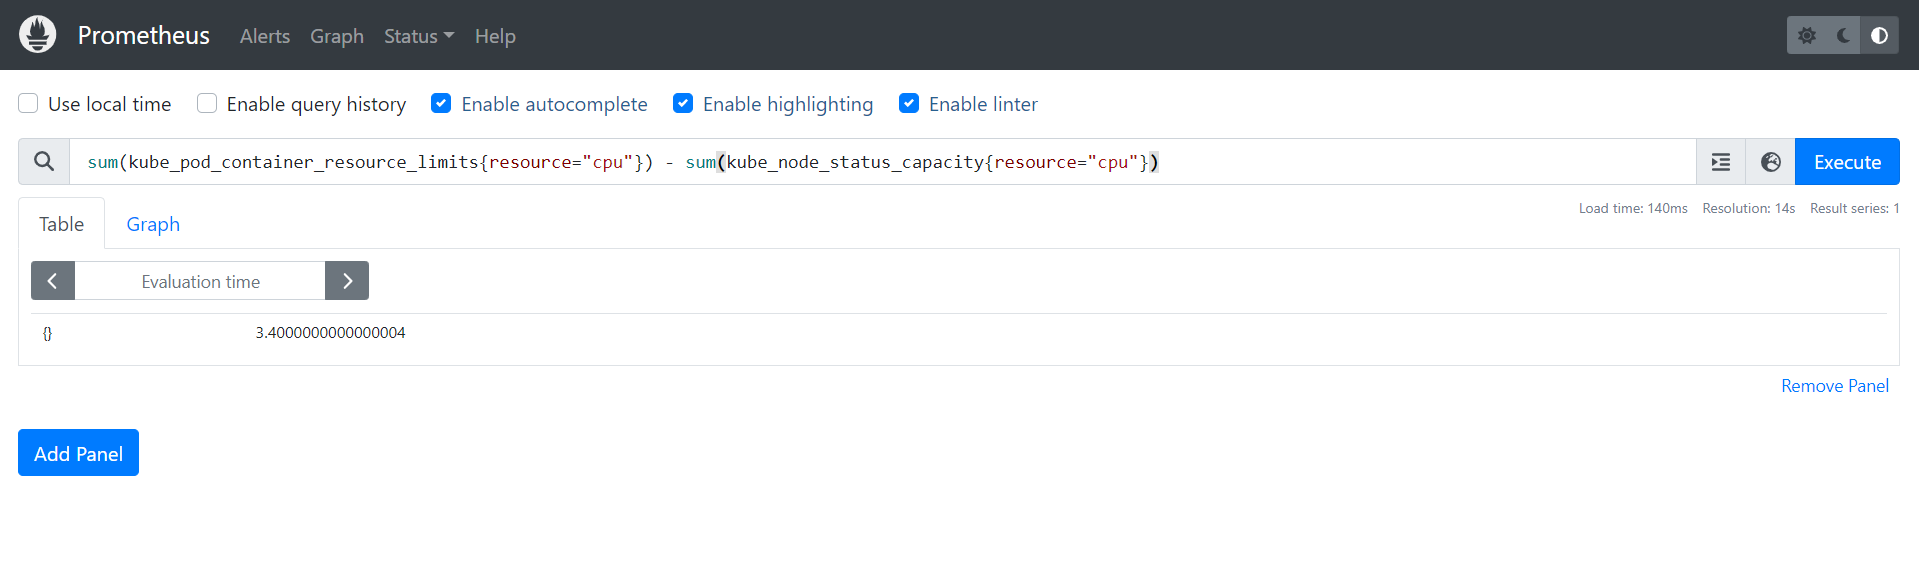
We do have a possible processor overload. We can sum up the limits of CPU resources that will be able to be consumed by the pods with the query sum(kube_pod_container_resource_limits{resource="cpu"}).
Similarly, we can retrieve the actual CPU consumption of all our Pods with the query sum(kube_node_status_capacity{resource="cpu"}). In the same vein we can simply replace cpu with memory to retrieve RAM-related information with the following entries:
sum(kube_pod_container_resource_limits{resource="memory"})- sum(kube_node_status_capacity{resource="memory"})
d.4.3 - searching for unhealthy Kubernetes pods
Before running a query, we'll create a Pod . Let's start by creating a datascientest-pod-nonsain.yml file with the following contents:
apiVersion: v1
kind: Pod
metadata:
  name: datascientest-pod-nonsain
spec:
  containers:
    - name: datascientest-pod-nonsain
      image: nginx
  restartPolicy: Always
  nodeSelector:
    disktype: ssd
We can now create this object as follows:
kubectl apply -f datascientest-pod-nonsain.yml
Output display:
pod/datascientest-pod-nonsain created
The pod datascientest-pod-nonsain won't be able to execute, as we don't have a node with the disktype label SSD.Let's now execute the following query:
min_over_time(sum by (namespace, pod) (kube_pod_status_phase{phase=~"Pending|Unknown|Failed"})[15m:1m]) > 0
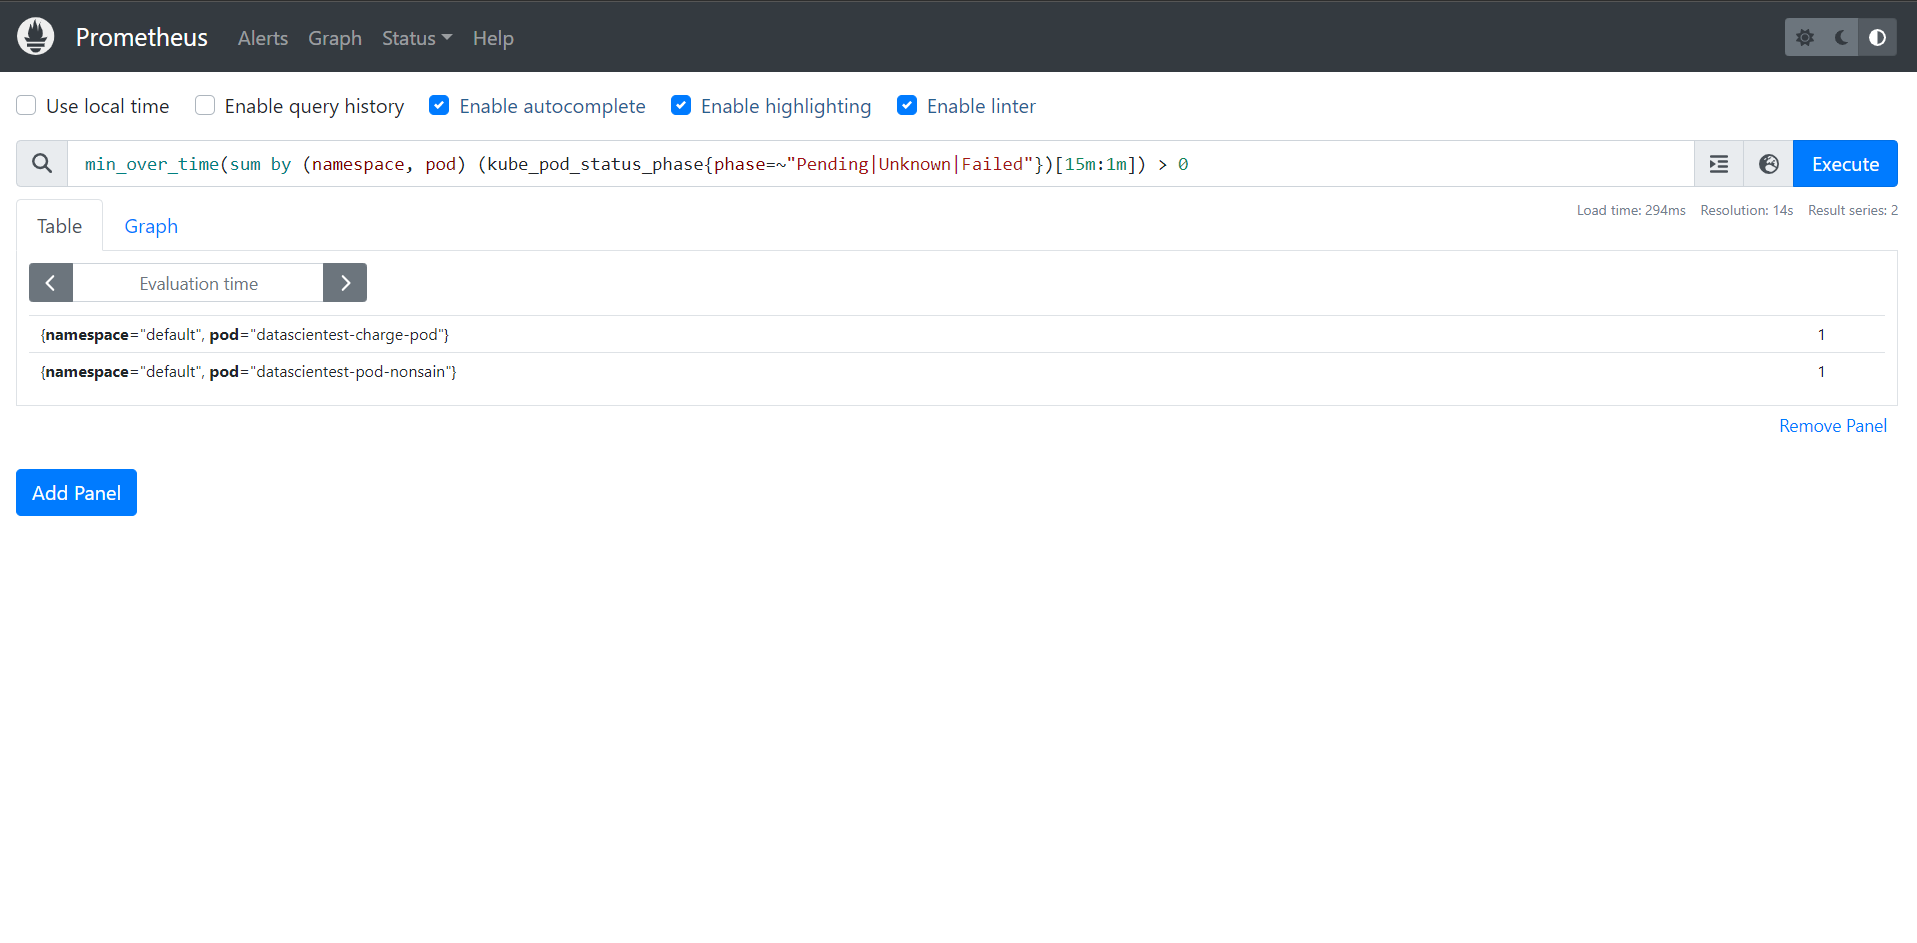
We have two Pods in one of the filtered statuses: Pending , Unknown , Failed. For Pod datascientest-charge-pod , this is a resource problem. That's why it's also in one of the states . We can check this by displaying the Pod list:
kubectl get all --all-namespaces | grep -i "pending"
Output display:
default pod/datascientest-charge-pod 0/1 Pending 0 72m
default pod/datascientest-pod-nonsain 0/1 Pending 0 11m
Let's try to find out why the pod datascientest-charge-pod is in the Pending state:
kubectl describe pod datascientest-charge-pod
Output display:
Name: datascientest-charge-pod
Namespace: default
Priority: 0
Service Account: default
Node: <none>
Labels: run=pod
Annotations: <none>
Status: Pending
IP:
IPs: <none>
Containers:
  charge-pod:
    Image: nginx
    Port: <none>
    Host Port: <none>
    Args:
      cpu
    Limits:
      cpu: 2
      memory: 3000Mi
    Requests:
      cpu: 2
      memory: 3000Mi
    Environment: <none>
    Mounts:
      /var/run/secrets/kubernetes.io/serviceaccount from kube-api-access-l7xv2 (ro)
Conditions:
  Type Status
  PodScheduled False
Volumes:
  kube-api-access-l7xv2:
    Type: Projected (a volume that contains injected data from multiple sources)
    TokenExpirationSeconds: 3607
    ConfigMapName: kube-root-ca.crt
    ConfigMapOptional: <nil>
    DownwardAPI: true
QoS Class: Guaranteed
Node-Selectors: <none>
Tolerations: node.kubernetes.io/not-ready:NoExecute op=Exists for 300s
                             node.kubernetes.io/unreachable:NoExecute op=Exists for 300s
Events:
  Type Reason Age From Message
  ---- ------ ---- ---- -------
  Warning FailedScheduling 5m33s (x13 over 70m) default-scheduler 0/1 nodes are available: 1 Insufficient cpu, 1 Insufficient memory. preemption: 0/1 nodes are available: 1 No preemption victims found for incoming pod.
We can clearly see that it could not be executed because an available node is unable to provide it with the resources it needs.
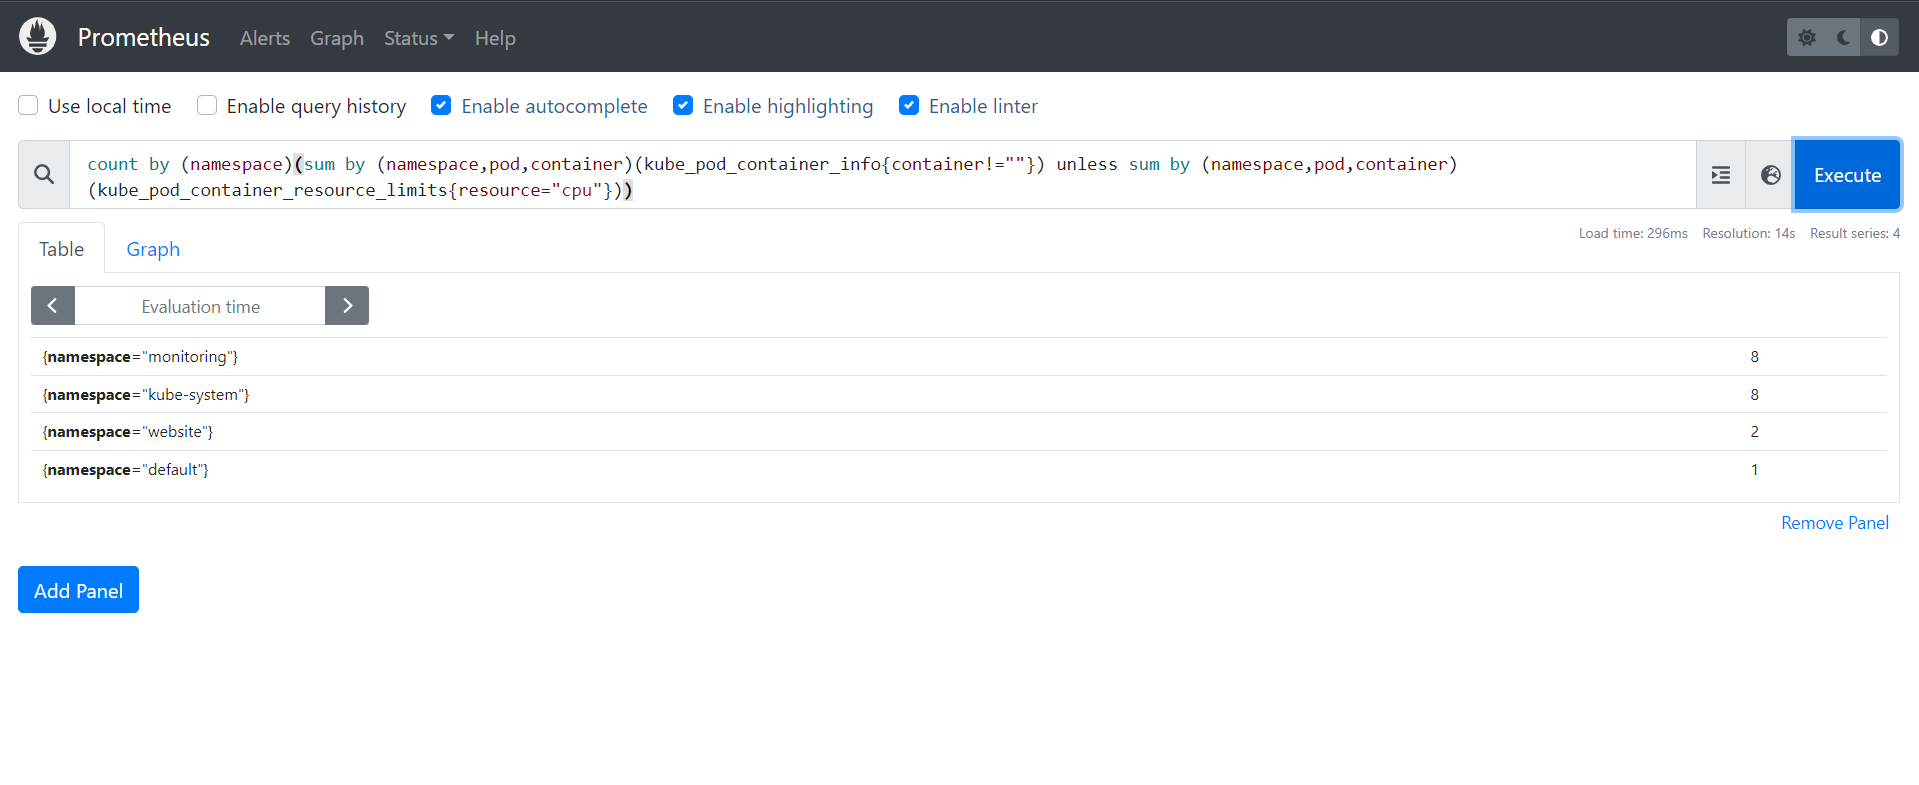
d.4.4 - find the number of containers without CPU limit in each Namespace
We can also display with the following query the list of Pod containers that have no CPU limit per Namespace:
count by (namespace)(sum by (namespace,pod,container)(kube_pod_container_info{container!=""}) unless sum by (namespace,pod,container)(kube_pod_container_resource_limits{resource="cpu"}))
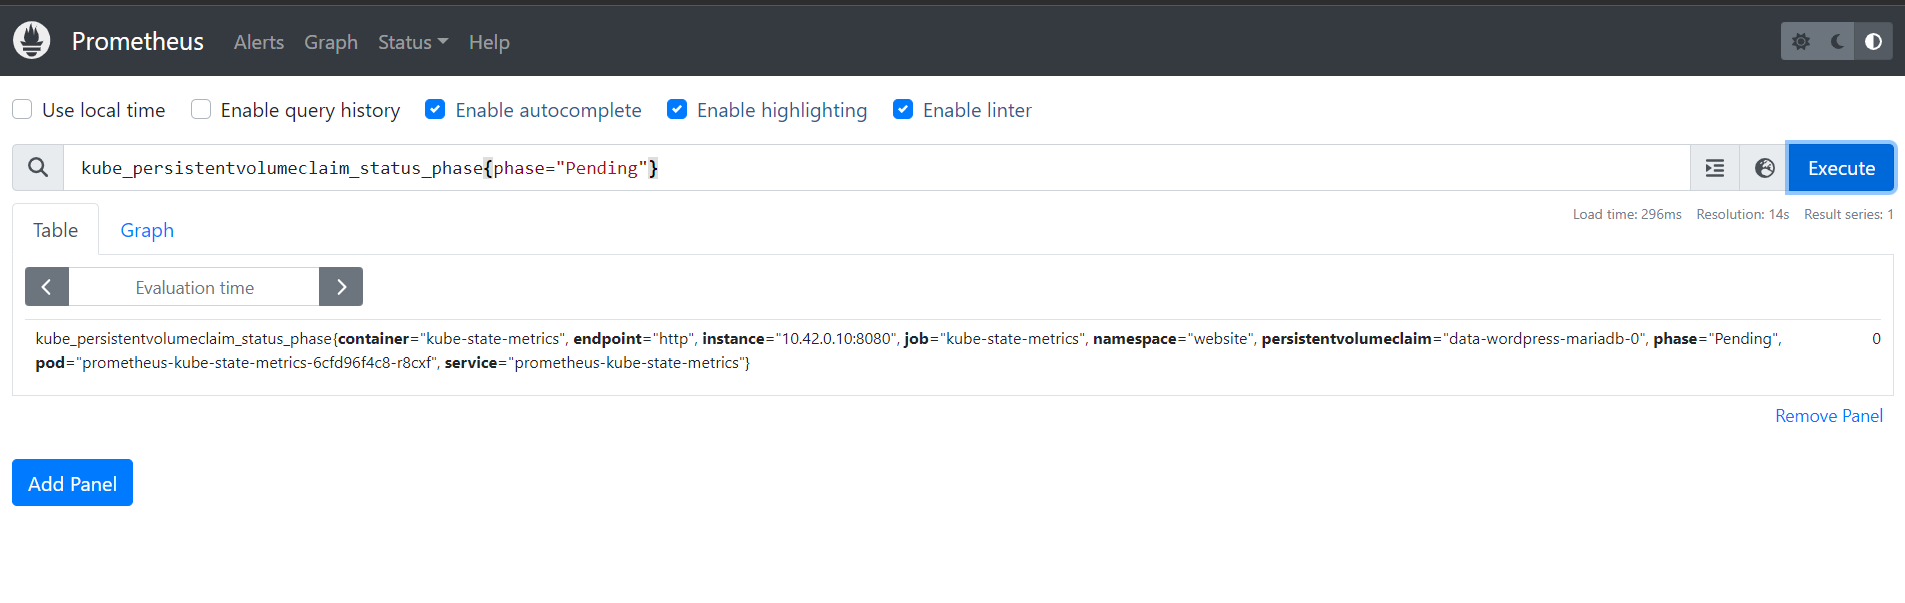
d.4.5 - search PersistentVolumeClaim in wait state
We can also search the list of PVCs in the Pending state with the following query:
kube_persistentvolumeclaim_status_phase{phase="Pending"}
d.4.6 - Finding unstable nodes
In this example query, we want to find nodes that intermittently switch between the Ready and NotReady states continuously:
sum(changes(kube_node_status_condition{status="true",condition="Ready"}[15m])) by (node) > 2
If both nodes are working correctly, we won't get any results for this query.
d.4.7 - Search for inactive processor cores
We can also retrieve inactive processor cores from our nodes in the following way:
sum((rate(container_cpu_usage_seconds_total{container!="POD",container!=""}[30m]) - on (namespace,pod,container) group_left avg by (namespace,pod,container)(kube_pod_container_resource_requests{resource="cpu"})) * -1 >0)
d.4.8 - Searching for inactive memory
Similarly, we can also retrieve unused RAM on our nodes as follows
sum((container_memory_usage_bytes{container!="POD",container!=""} - on (namespace,pod,container) avg by (namespace,pod,container)(kube_pod_container_resource_requests{resource="memory"})) * -1 >0 ) / (1024*1024*1024)
d.4.9 - search for node state
We also have queries that allow us to filter the states of our cluster nodes:
sum(kube_node_status_condition{condition="Ready",status="true"}) # status "Ready
sum(kube_node_status_condition{condition="NotReady",status="true"}) "NotReady" status
sum(kube_node_spec_unschedulable) by (node) # nodes on which we can't execute Pods
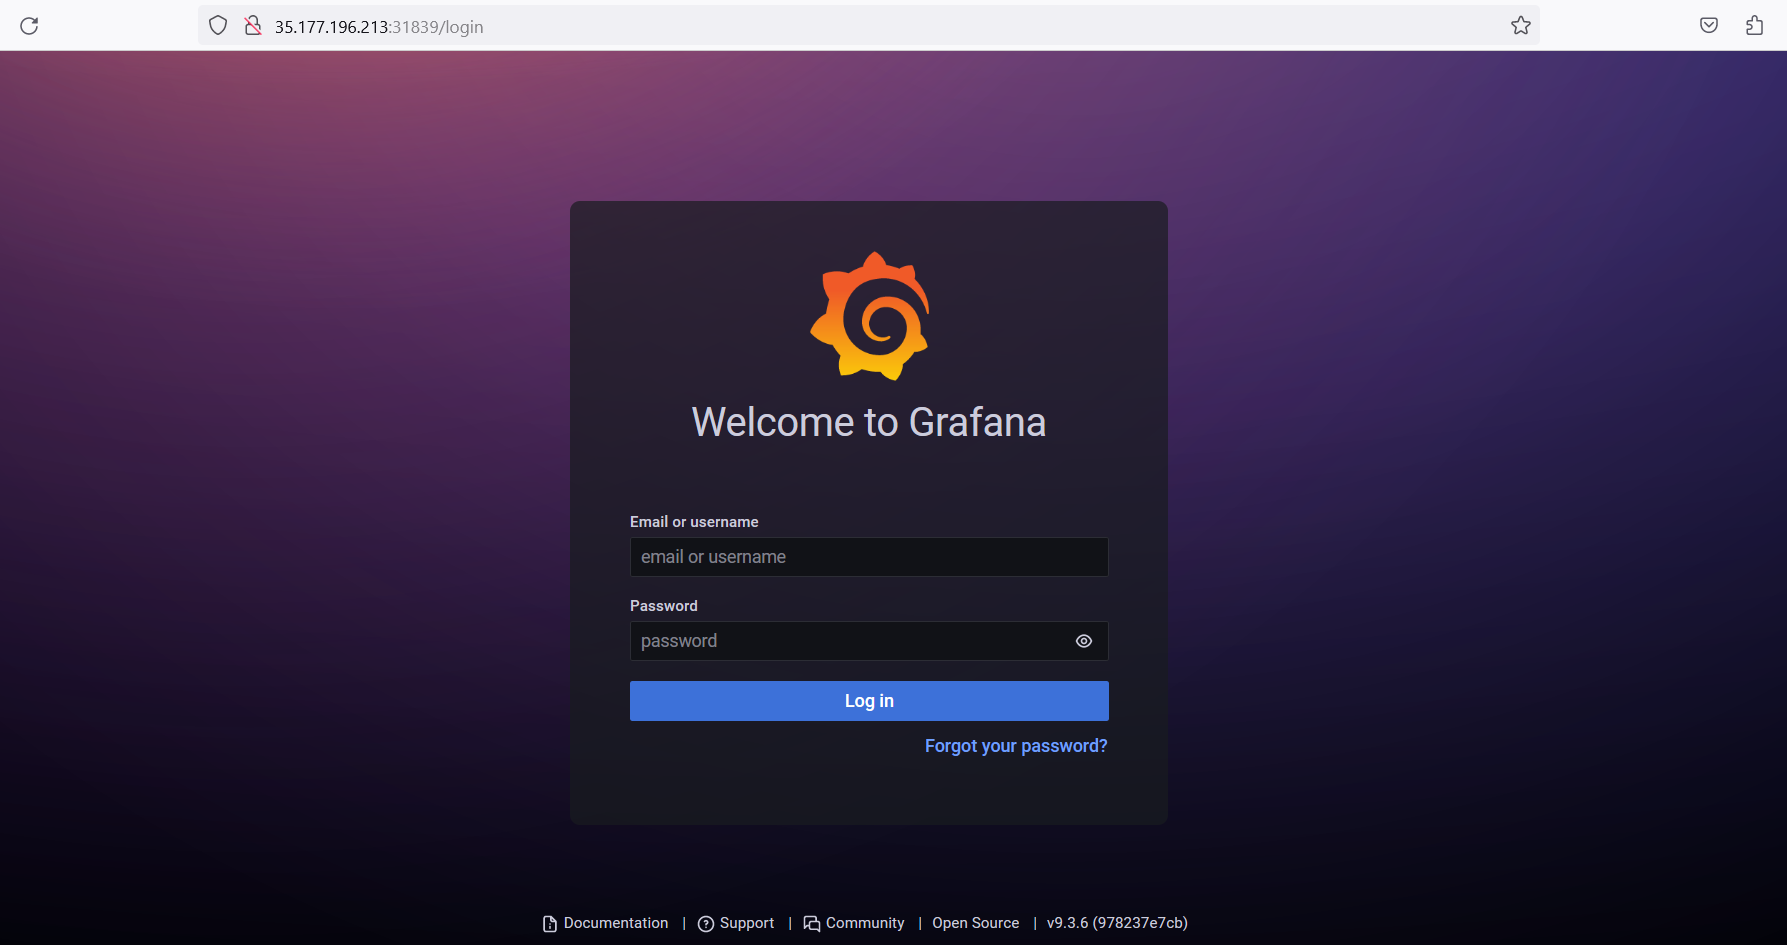
d.5 - Connecting to Grafana
The credentials to connect to the Grafana web interface are stored in a Kubernetes secret and base64 encoded. We retrieve the administrator username in the following way in order to connect to the Grafana interface:
kubectl get secret --namespace monitoring prometheus-grafana -o jsonpath='{.data.admin-user}' | base64 -d
Output display:
admin
We also retrieve the password as follows:
kubectl get secret --namespace monitoring prometheus-grafana -o jsonpath='{.data.admin-password}' | base64 -d
Output display:
prom-operator
We need to retrieve the port in order to access Grafana , let's do it as follows:
kubectl get svc -n monitoring | grep grafana
Output display:
prometheus-grafana NodePort 10.43.57.217 <none> 80:31839/TCP 13m
We can now connect to the Grafana interface , on port 31839 of our server ( _it could be different in your case_):
Once logged in, we can display the list of dashboards present:
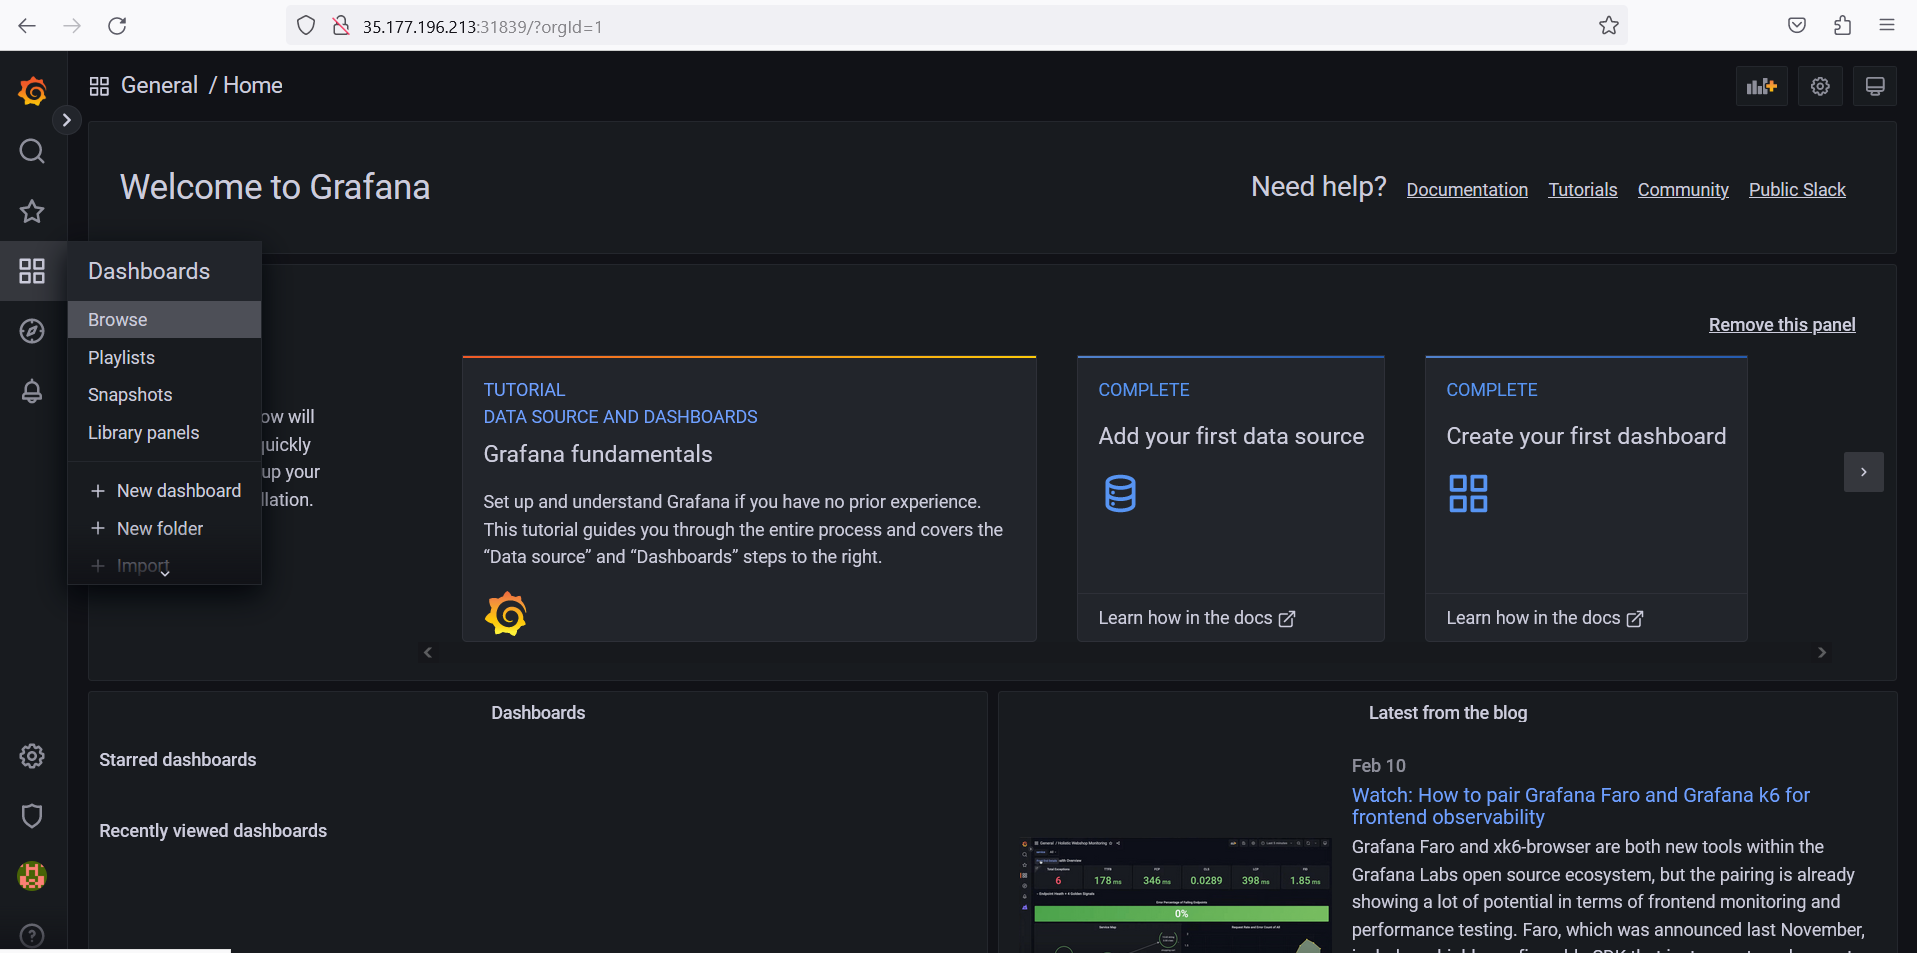
Let's click on the general directory to display the list of dashboards:
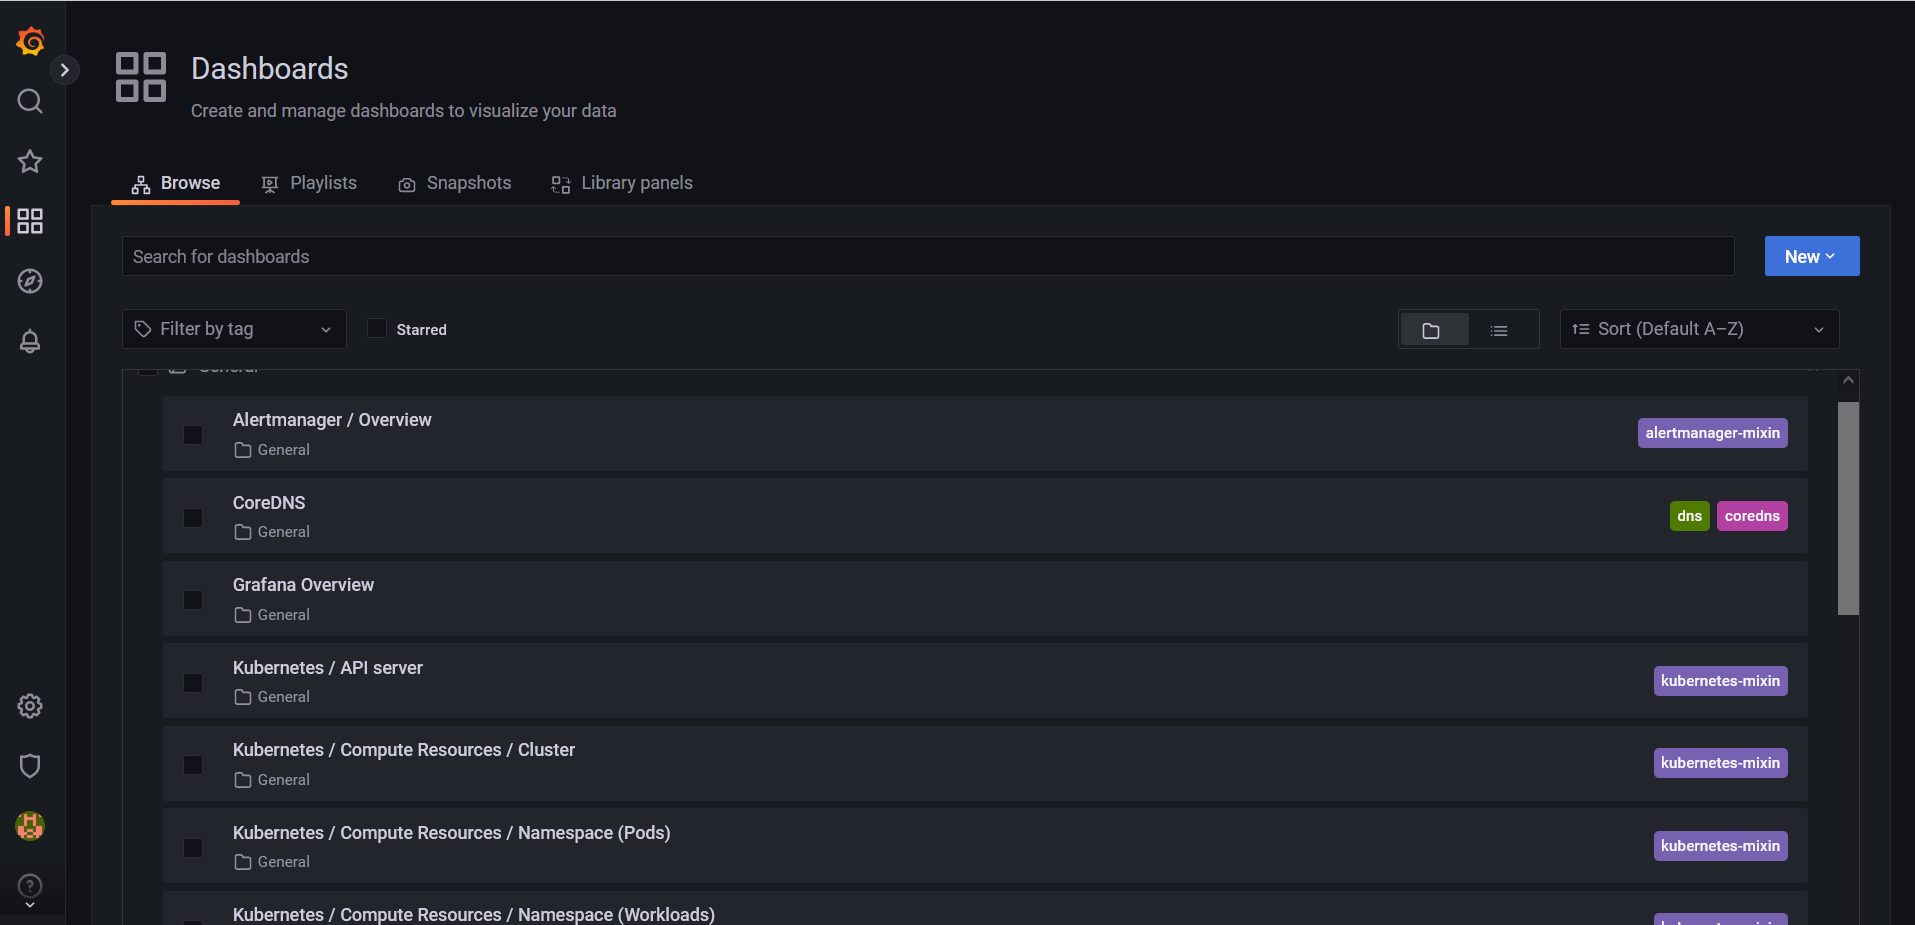
We have a list of dashboards present that allow us to fully monitor the objects in our Kubernetes cluster , the resources used and available as well as the metrics of our various applications. We have a list of dashboards:
Alertmanager/Overview
CoreDNS
Grafana Overview
Kubernetes/API server
Kubernetes/Compute Resources/Cluster
Kubernetes/Compute Resources/Namespace (Pods)
Kubernetes/Compute Resources/Namespace (Workloads)
Kubernetes/Compute Resources/Node (Pods)
Kubernetes/Compute Resources/Pod
Kubernetes/Compute Resources/Workload
Kubernetes/Controller Manager
Kubernetes/Kubelet
Kubernetes/Networking/Cluster
Kubernetes/Networking/Namespace (Pods)
Kubernetes/Networking/Namespace (Workload)
Kubernetes/Networking/Pod
Kubernetes/Networking/Workload
Kubernetes/Persistent Volumes
Kubernetes/Proxy
Kubernetes/Scheduler
Node Exporter/MacOS
Node Exporter/Nodes
Node Exporter/USE Method/Cluster
Node Exporter/USE Method/Node
Prometheus/Overview
etcd
These names are pretty indicative of the resources that will be monitored.
Situational setting:
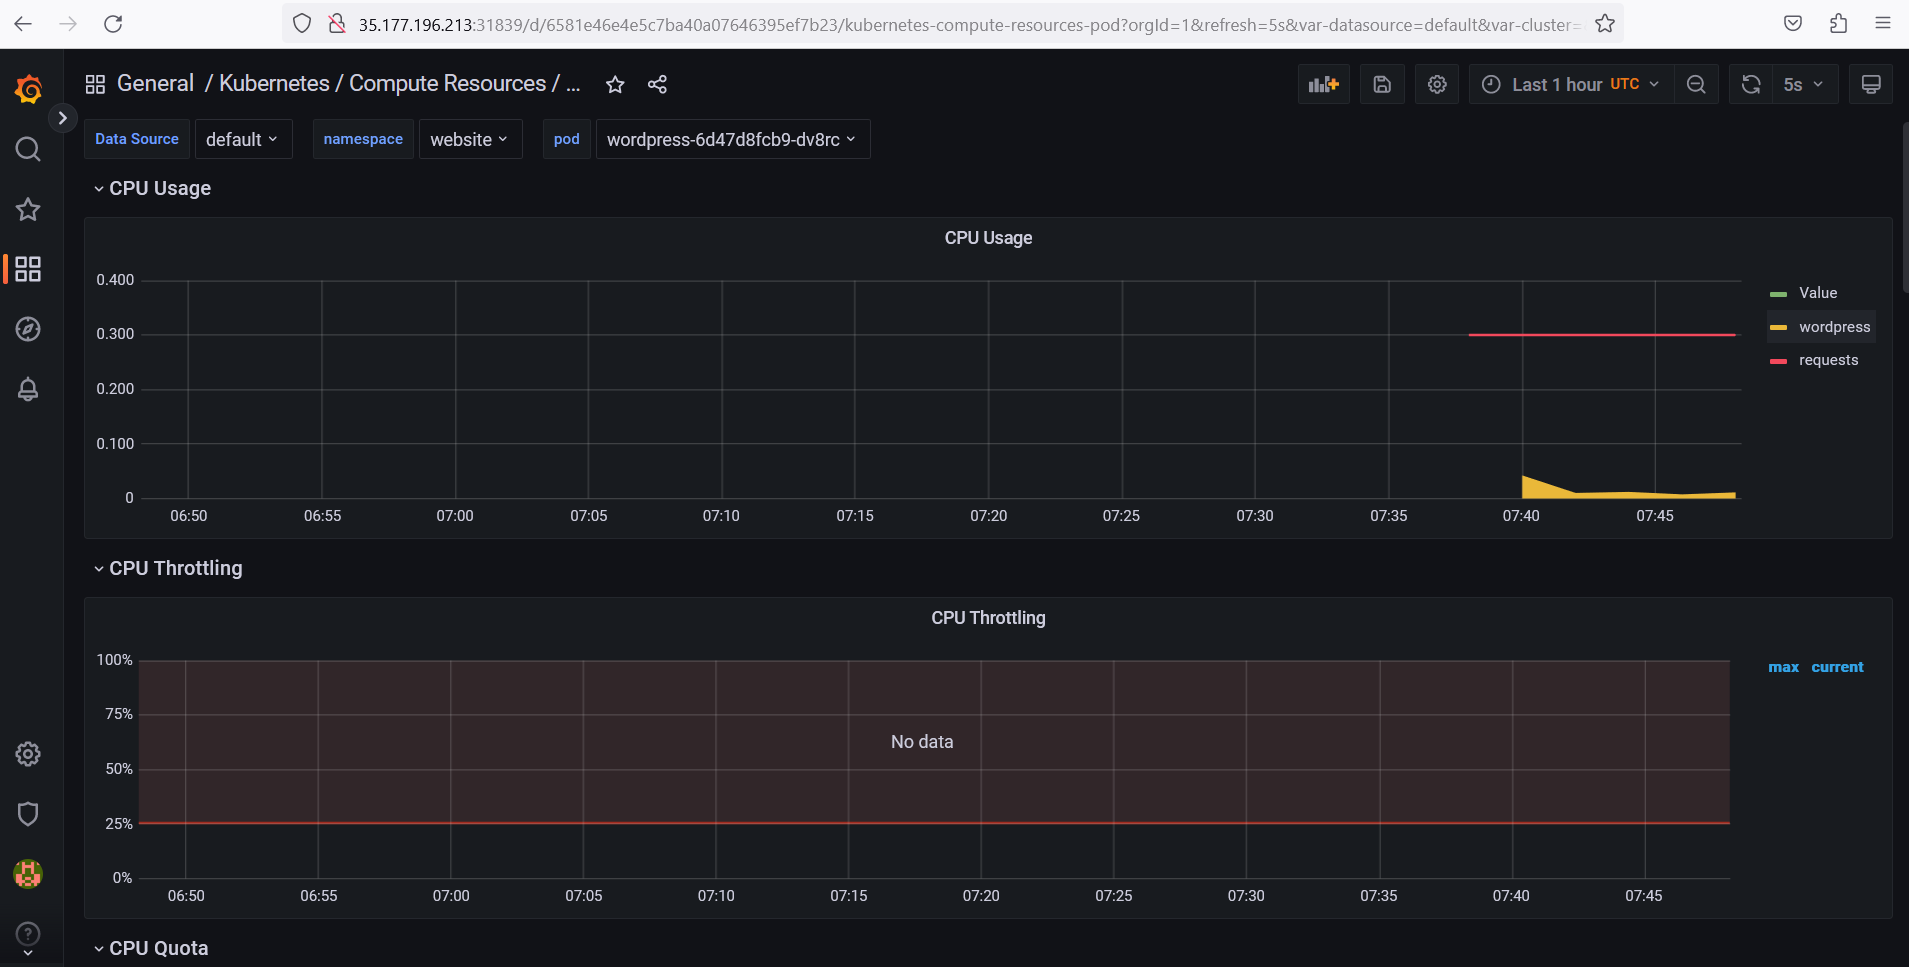
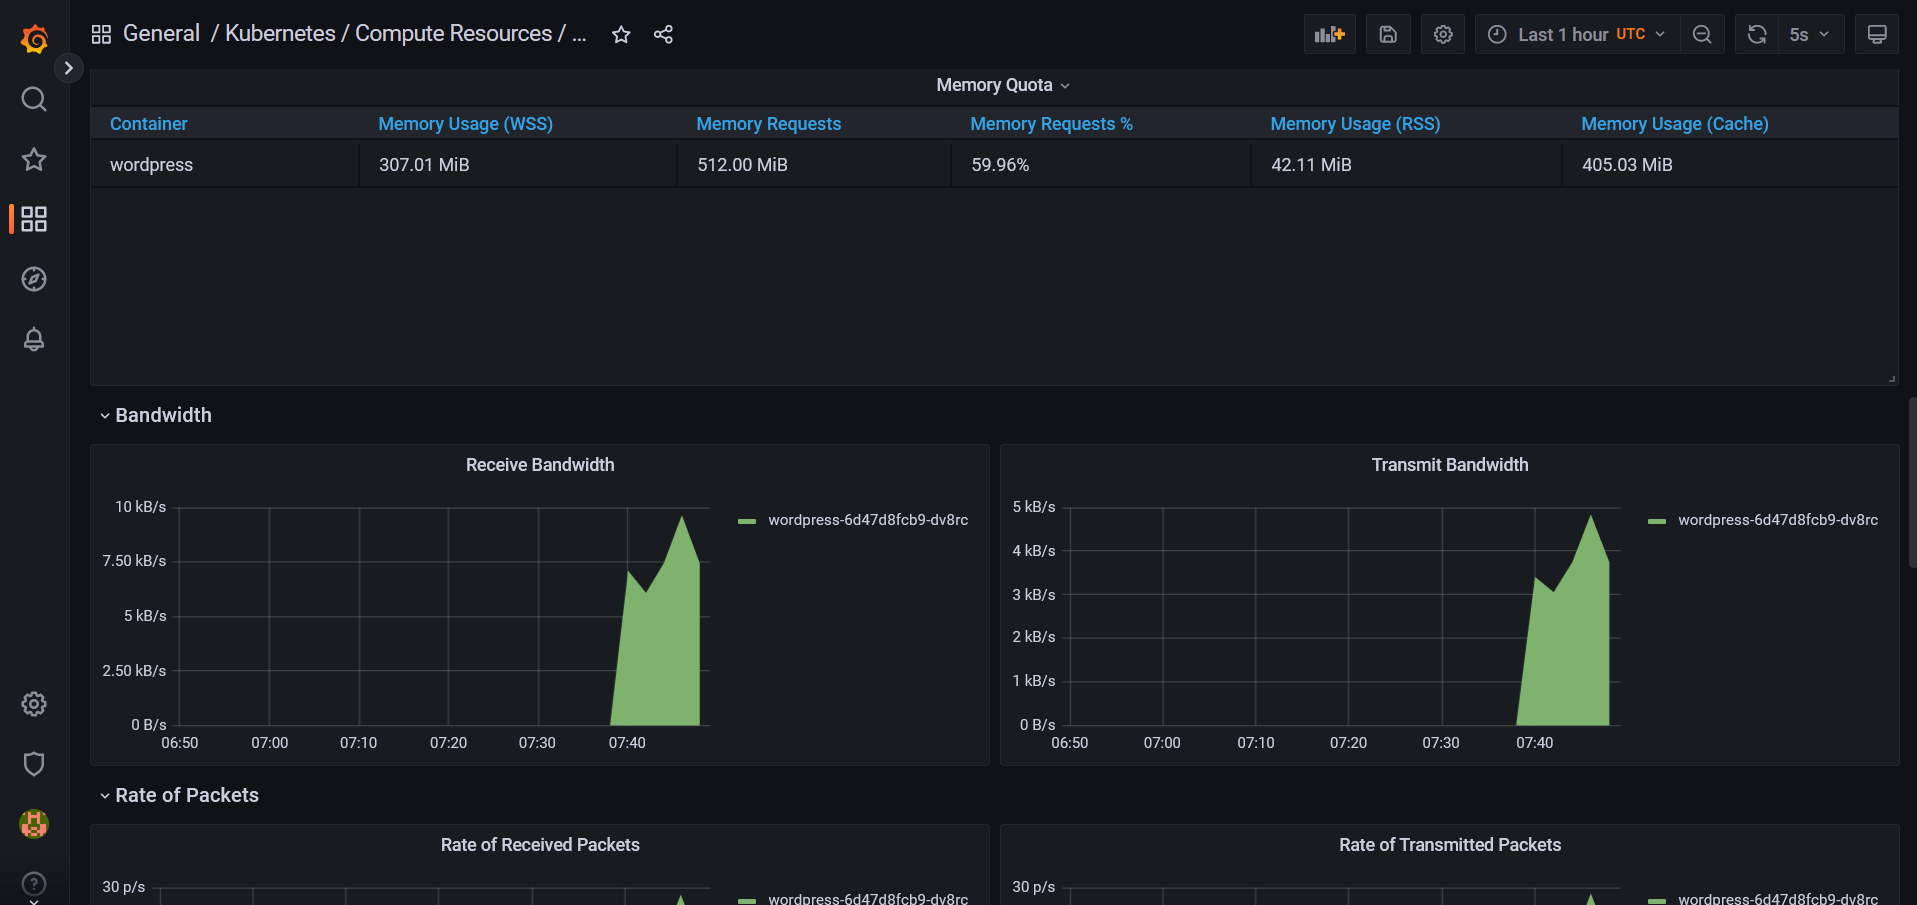
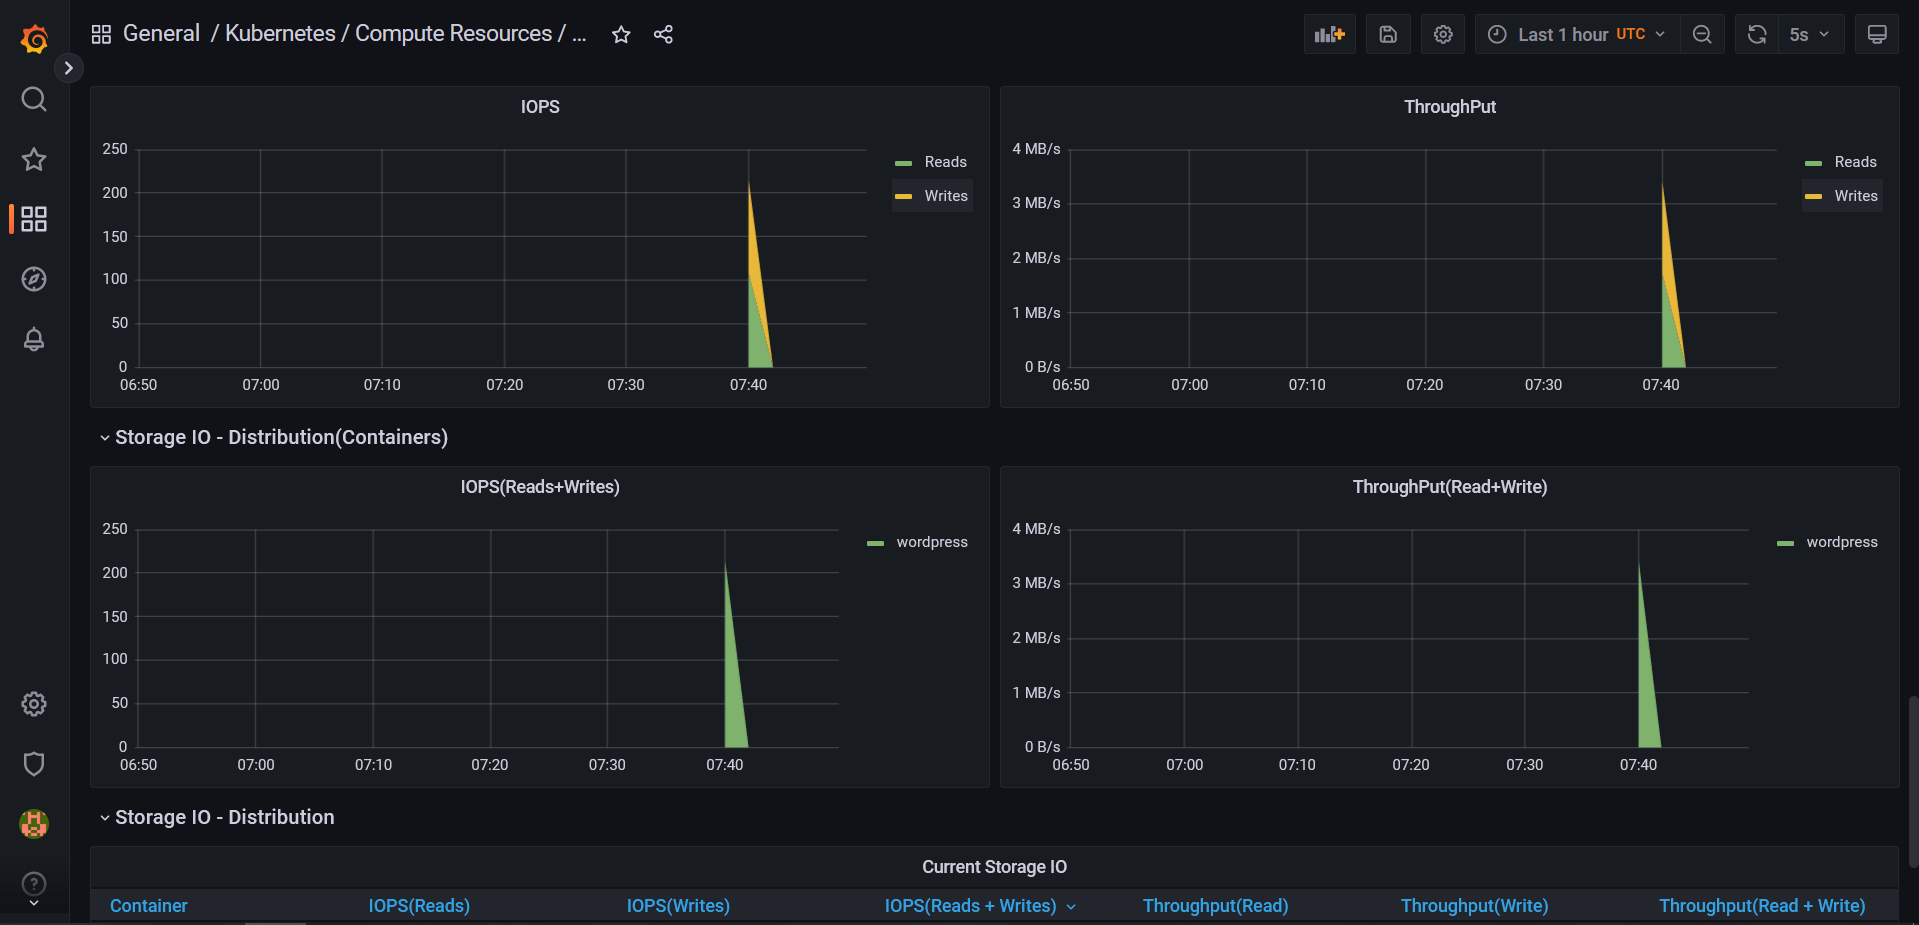
You'll need to deploy Wordpress thanks to Helm for your company in the Namespace
websiteof your Cluster.You'll need to define data persistence, use StorageClass
local-pathto provide persistent volumes of size20Gifor your database.Your Wordpress instance will need to be accessible via a
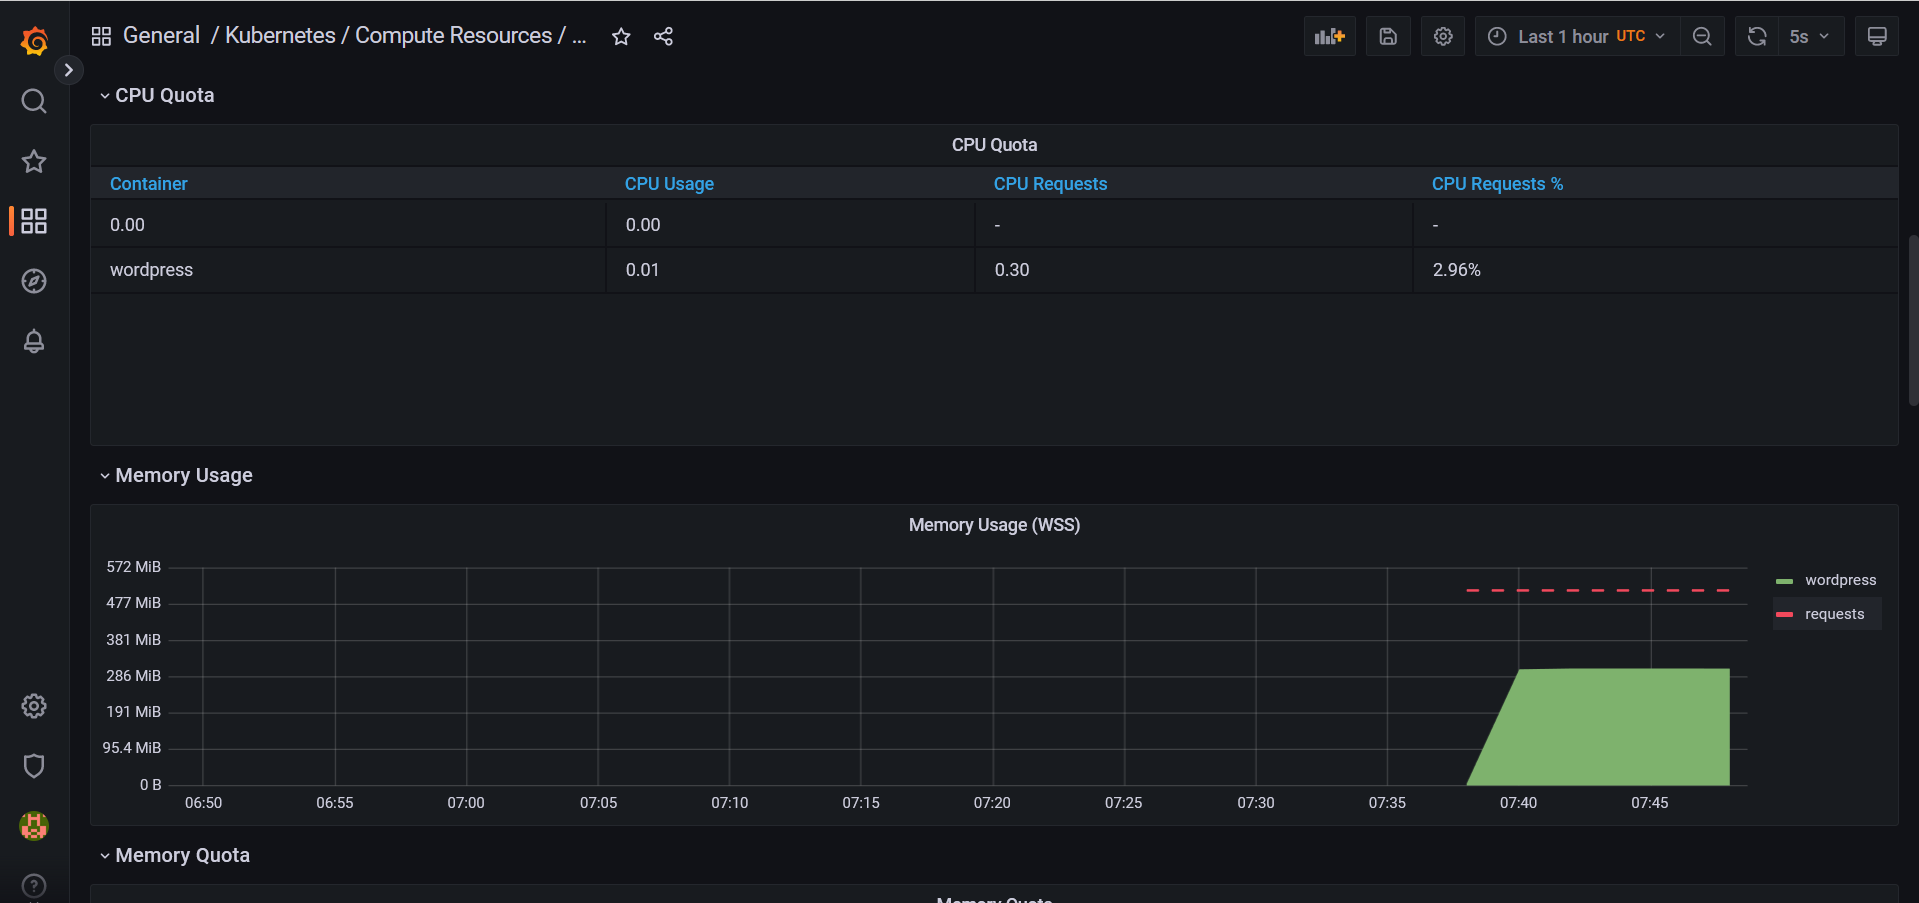
NodePortservice.Once your application has been deployed, you'll be responsible for viewing the consumption of Pods deployed by your application.
You should receive metrics from your Wordpress application every 5 seconds.
Conclusion
System unavailability has a tangible impact on the business. The loss of user confidence leads to a drop in the number of users, which ultimately results in a loss of revenue.
Since overall system readiness is critical, you need constant visibility into your system infrastructure to understand the current state of its health. Infrastructure monitoring provides you with the level of visibility you need.
Infrastructure monitoring enables administrative teams to see live information on the performance of their systems. Some of the measures available include:
- Disk IOP
- Network throughput
- Percentage of memory used
- Percentage of CPU used
- Current number of database connections
Gathering metrics provides business teams with an analysis of their system's trends for better system capacity planning. System metrics can enable infrastructure teams to drive automated system scaling.
For example, a system can be configured to automatically scale for additional compute resources once processor utilization exceeds a certain threshold. In modern infrastructures where we're talking about microservices , Prometheus and Grafana are undeniably among the most widely used tools on the market.
Prometheus and Grafana are among the most widely used tools on the market.
