
110+ Charts & Commentary on all major Markets — for your weekend reading.

KEY TOPICS COVERED
We came into the week making an urgent case for a lower low in Stocks, based on historical patterns.
We continue to hold elevated cash balances, looking for an opportunity to make a significant move.
Preparing for next week: this report will update my plan at this critical moment.
Always remember: experience to understand what’s happening, paired with the discipline to execute under extreme conditions, is what sets true winners apart — especially in rough times. Stay focused — and good luck to everyone next week.
*Actionable* & Comprehensive Analysis of Key Market Signals.
Complete list of Buy/Sell setups we’re watching.
Detailed Charts & Commentary: Core Models, Global Equities & Sectors, Volatility, Rates & Credit, Currencies, Commodities, Bitcoin.
WHAT MAJOR LOWS LOOK LIKE — MY CHECKLIST:
Down Friday / Down Monday capitulation sequence is *again* in play. Some of the biggest bottoms in history were formed this way. Data and Charts presented in detail throughout this report.
On watch for (1) news of a fund or strategy blow-up / closure, (2) breakages in market systems or functions: price limit locks, volatility halts, NAV breaks, ETF liquidations, trading platform restrictions, (3) capitulation language from fund managers / global policymakers & politicians / corporate leaders / media commentators.
On watch for price anomalies: (1) Volatility making lower highs even as Stocks keep falling, (2) a few select Indexes, Stocks, Currencies, Commodities, and Rates markets stop going down even as most Stocks keep falling (some initial evidence of this on Friday), (3) indiscriminate liquidation of all Stocks including defensives (happening), (4) record spikes in Volume, Flow, Sentiment or other metrics (happening).
More details covered extensively throughout this report.
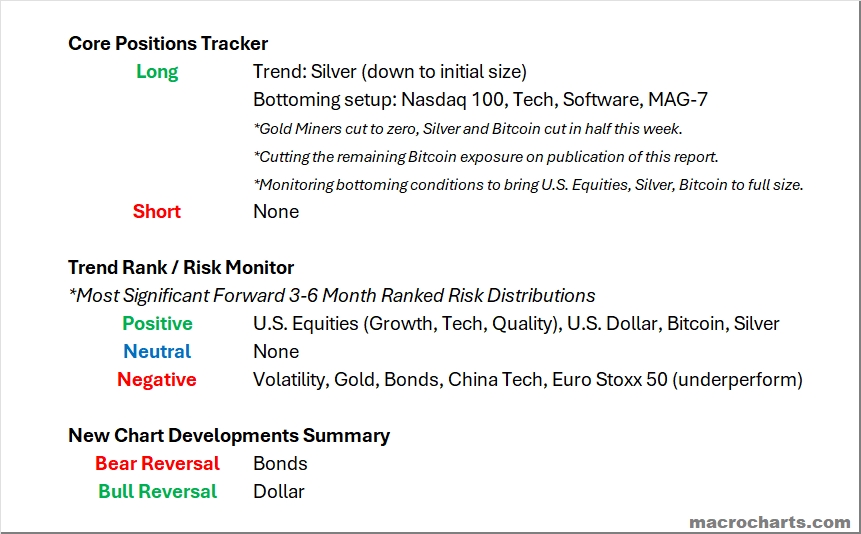
Market Dashboard
Core Positions Tracker: Planned ahead of market conditions, and include (1) reasoning, (2) chart context, (3) entry/stop levels, and (4) price projections.
Trend Rank / Risk Monitor: Model-driven system which includes Positioning, Sentiment, and Momentum to generate forward 3-6 month ranked risk distributions. These can become Core Positions if/when Trends are confirmed.
New Chart Developments Summary: Notable chart patterns of the week, developing potential key inflection or acceleration points.
A crisis of historic magnitude — and lasting significance.
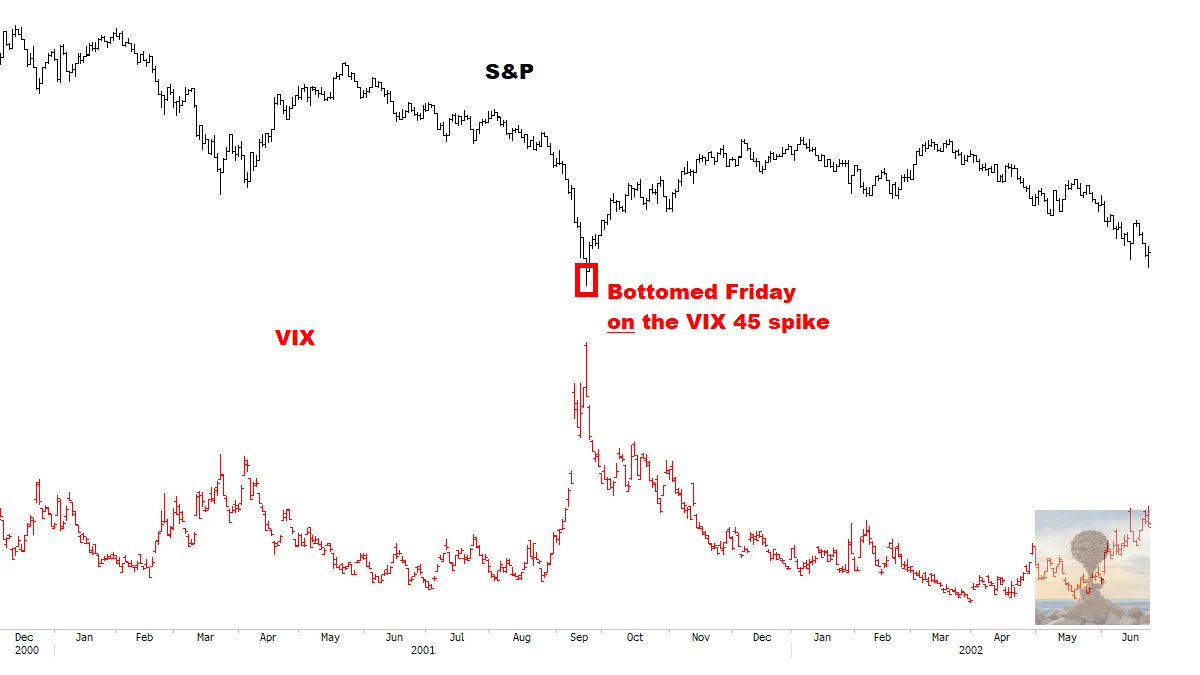
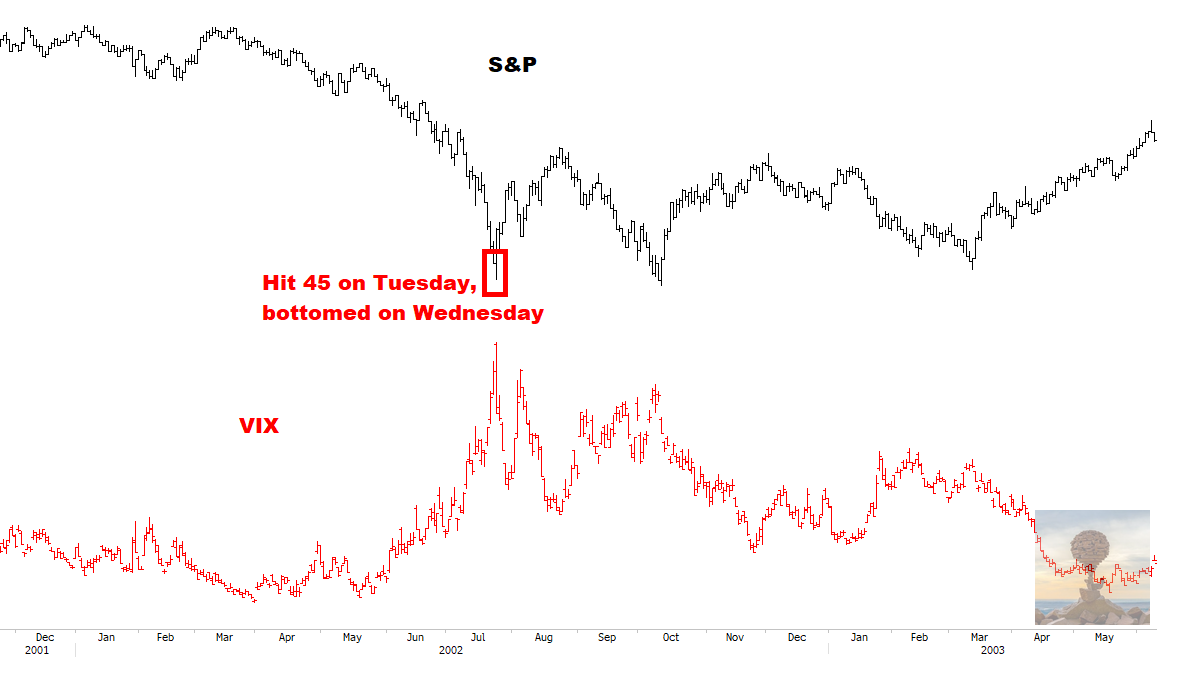
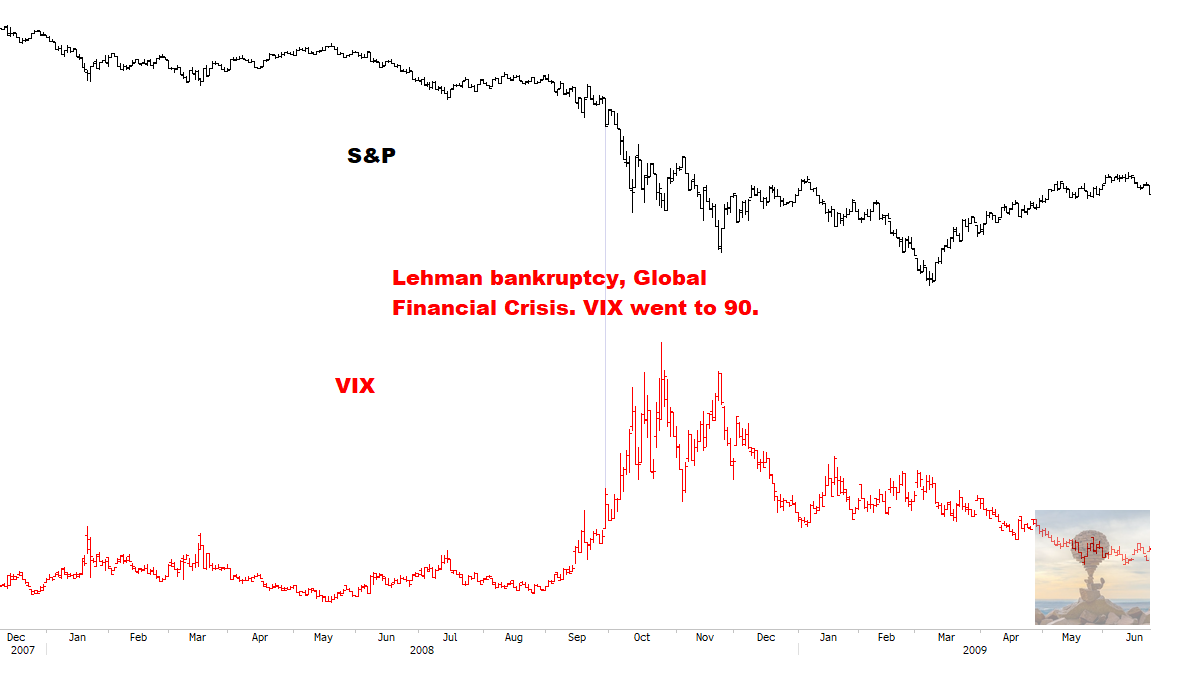
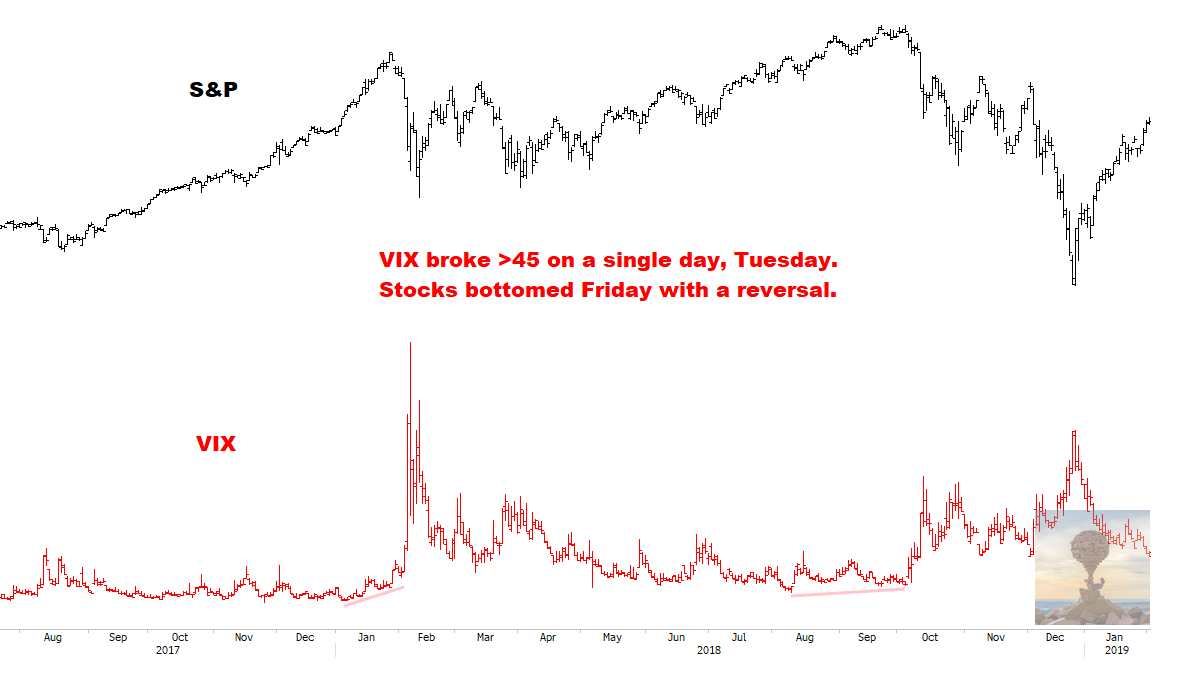
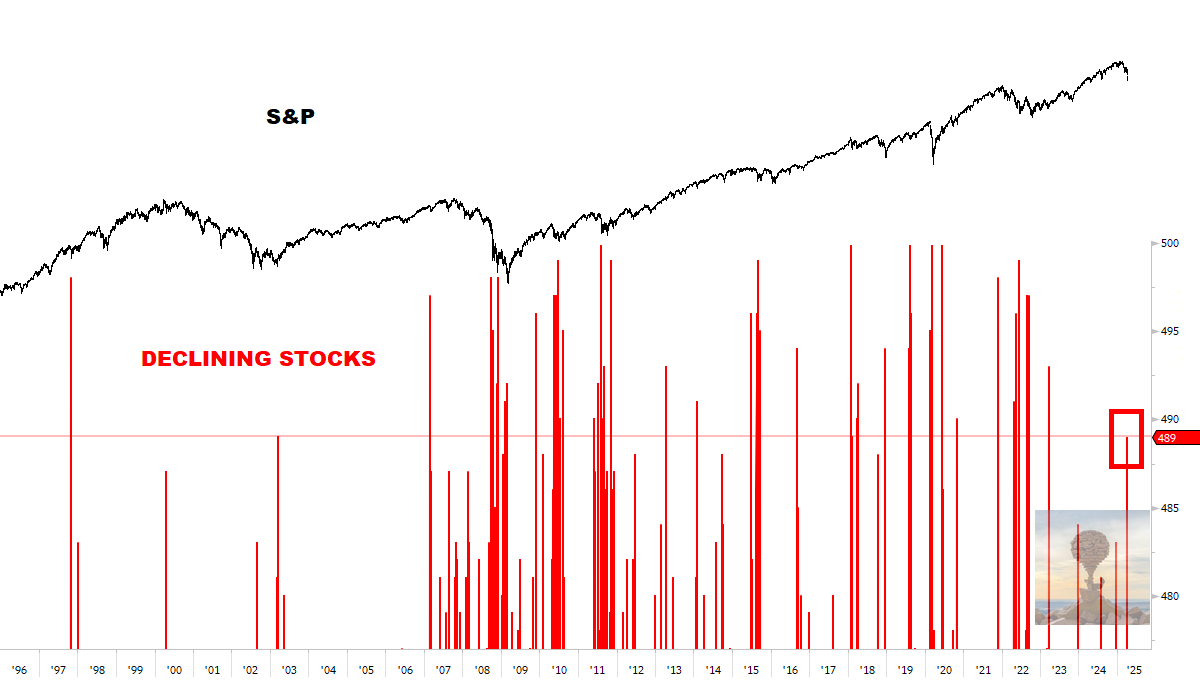
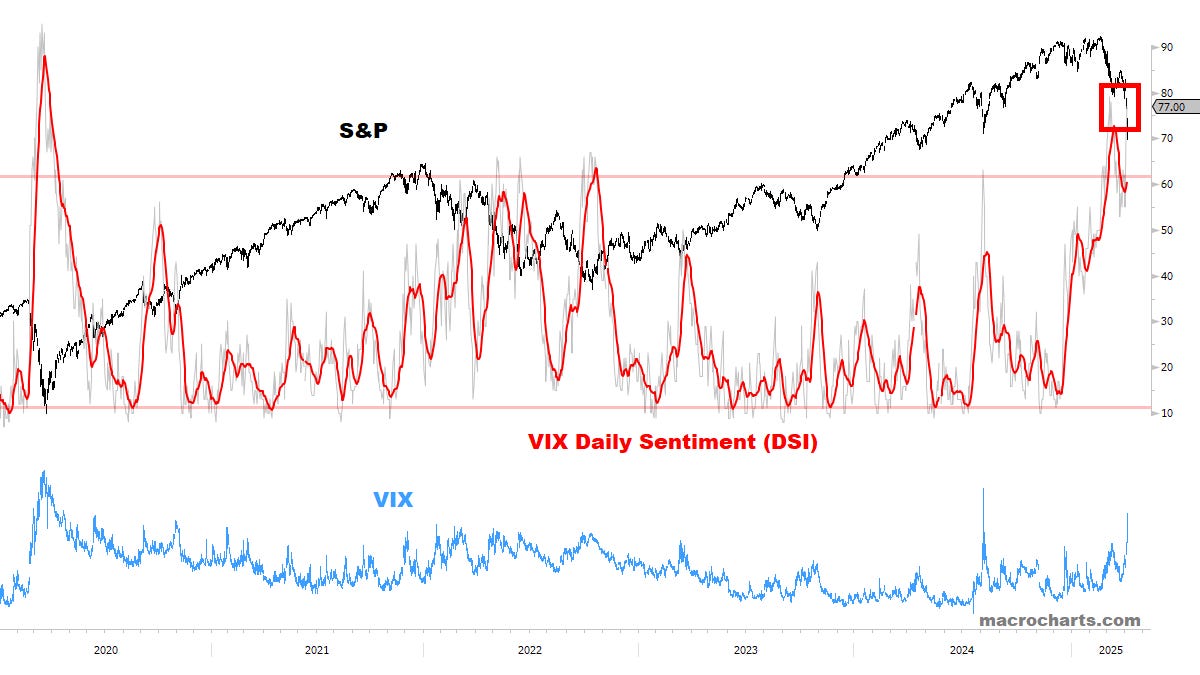
VIX broke 45 on Friday — among the biggest spikes in history.
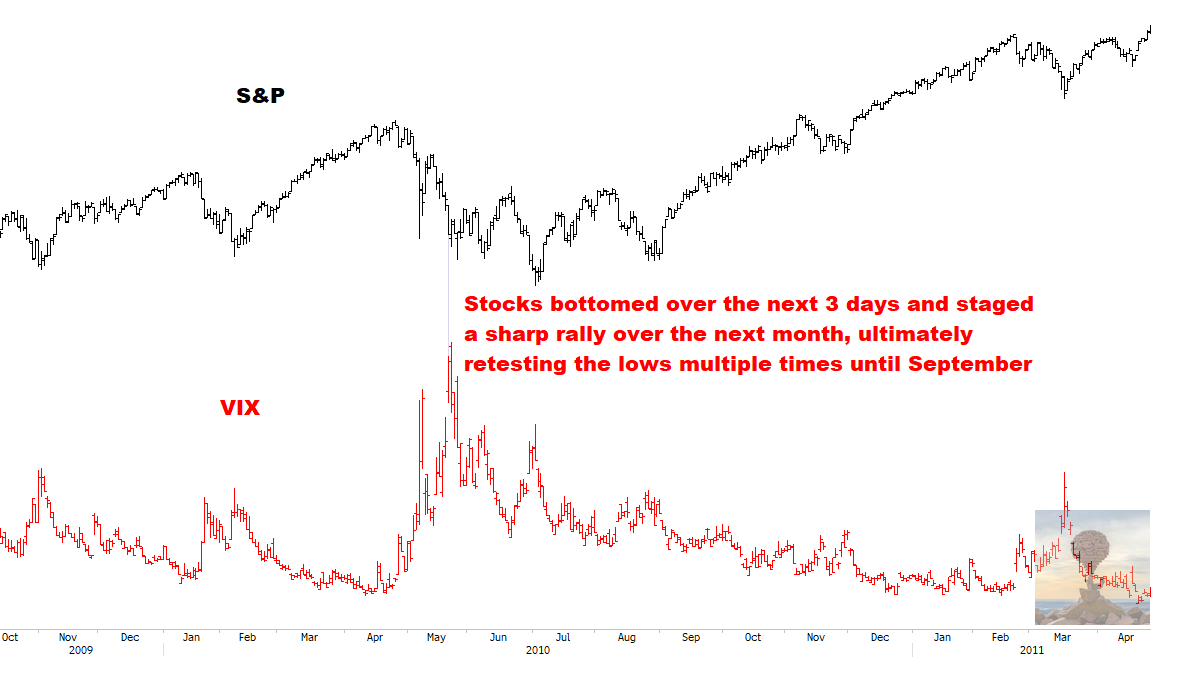
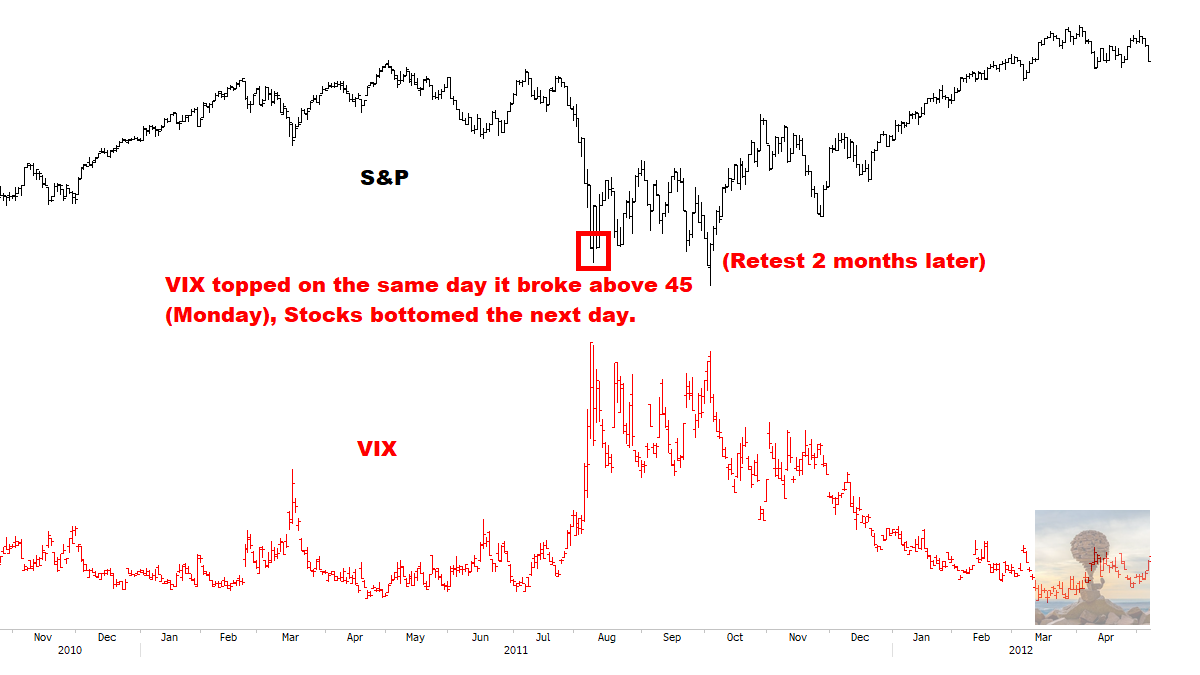
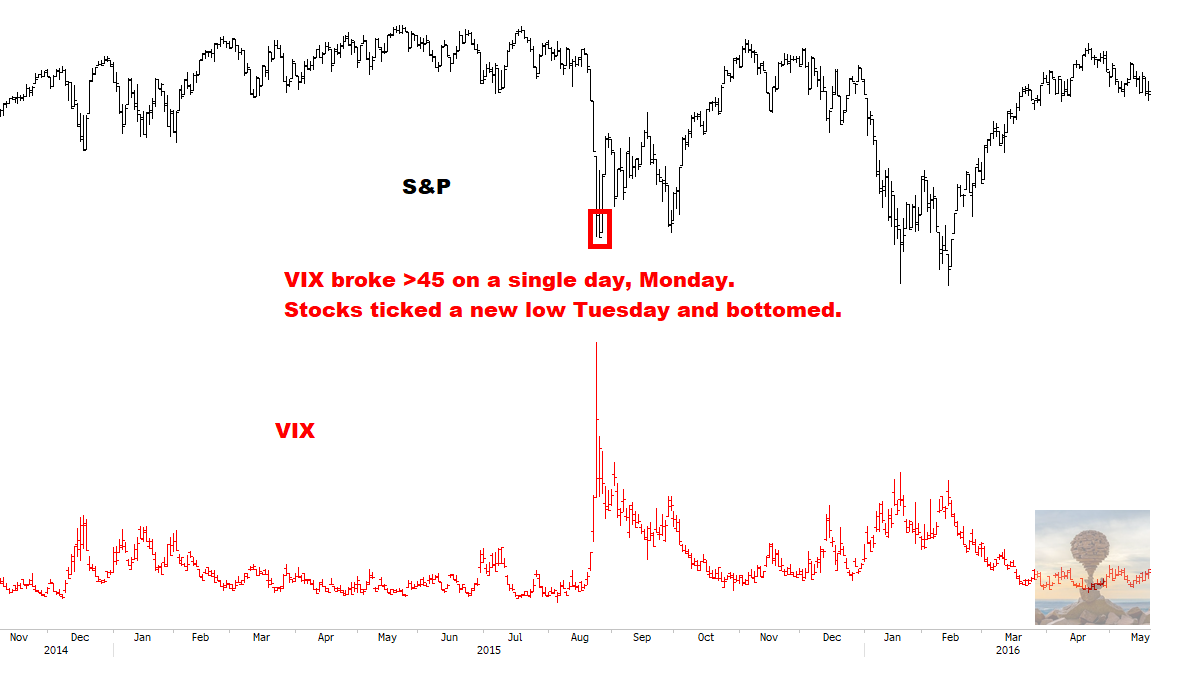
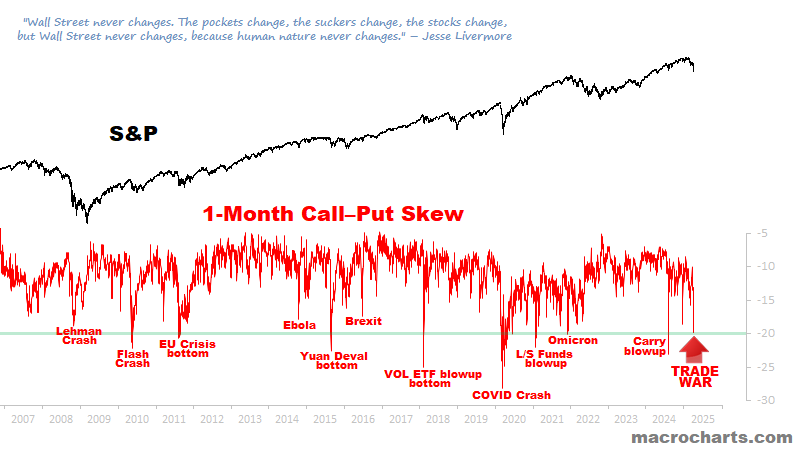
Note the historical patterns:
1997 and 1998 — contagion from Asia and Russia/LTCM, respectively
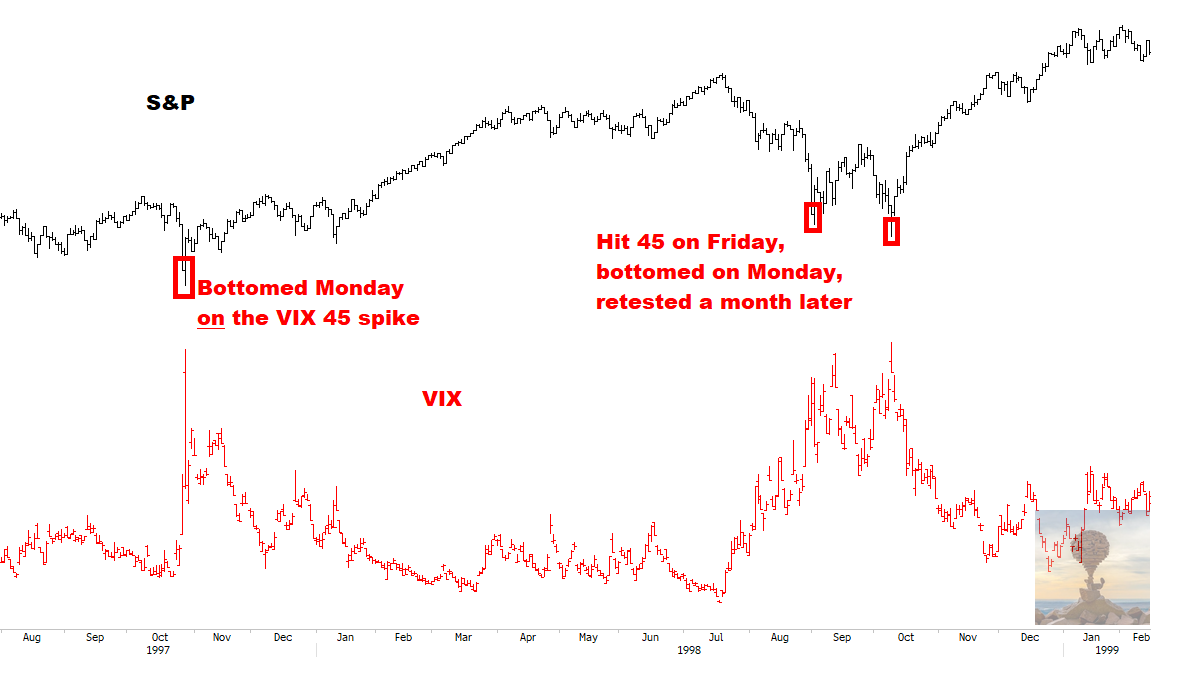
2001 Bear Market and 9/11 Attack
2002 Bear Market Bottom (later retested)
2008
2010
2011 — EU Crisis
2015 — Yuan devaluation
2018 — VIX ETF Blowup
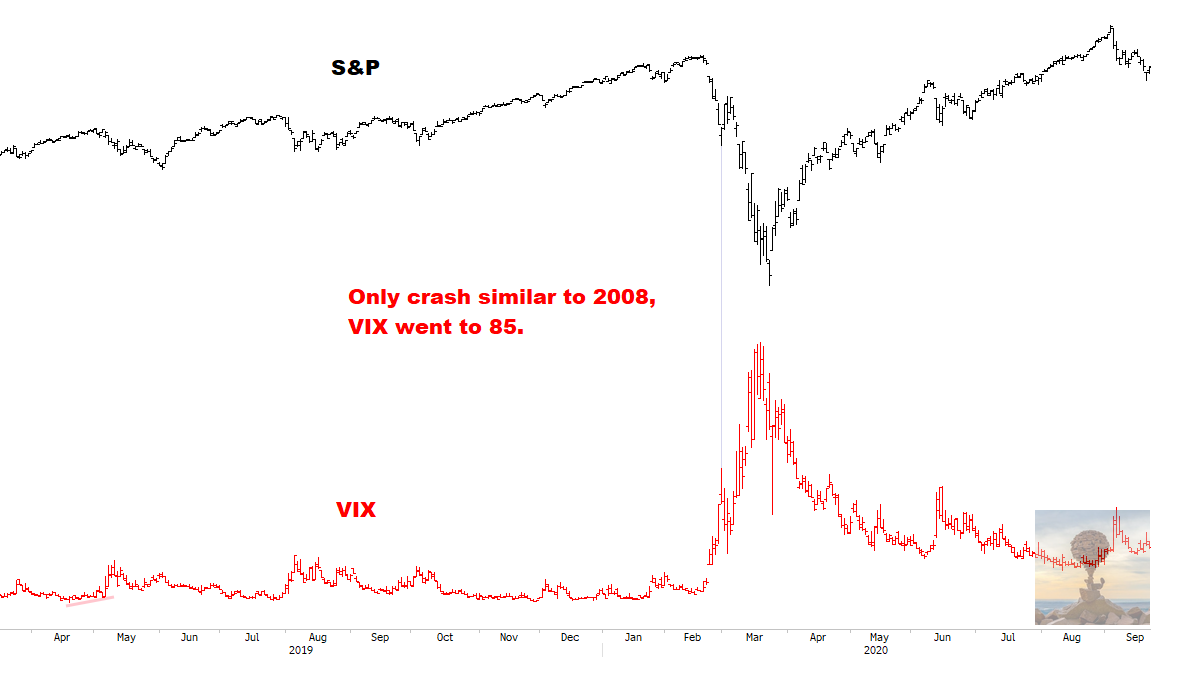
2020 — Global Pandemic
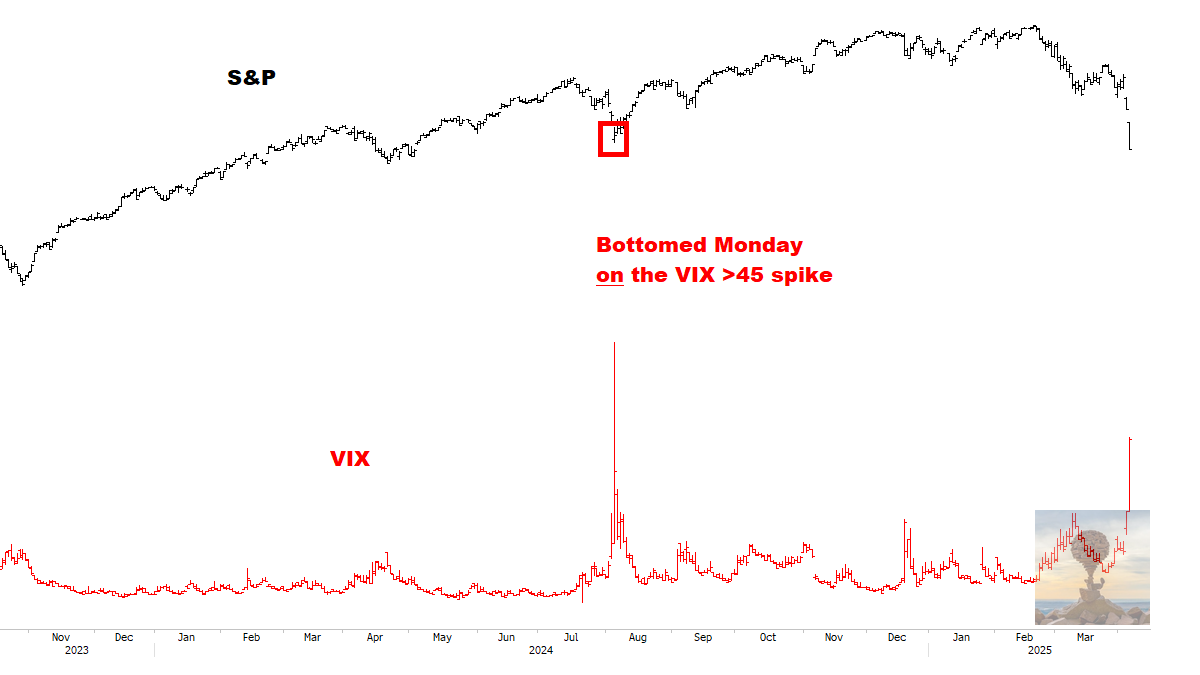
2024 — Carry Trade Unwind
Summary:
Volatility should peak on Monday at the latest, if it didn’t peak in Friday’s session.
Stocks have a strong probability of bottoming on Monday, if not Tuesday morning at the latest — as historically they tend to form an initial bottom the day after Volatility peaks.
Stocks could retest the lows later on, but if big levels get tested on Monday, will be looking to put capital to work — see levels covered extensively throughout the Technical Charts section.
To be clear: I think markets are trading a Panic, not a Crash scenario like 2008 or 2020.
CORE MODELS & DATA
A crisis of historic magnitude:
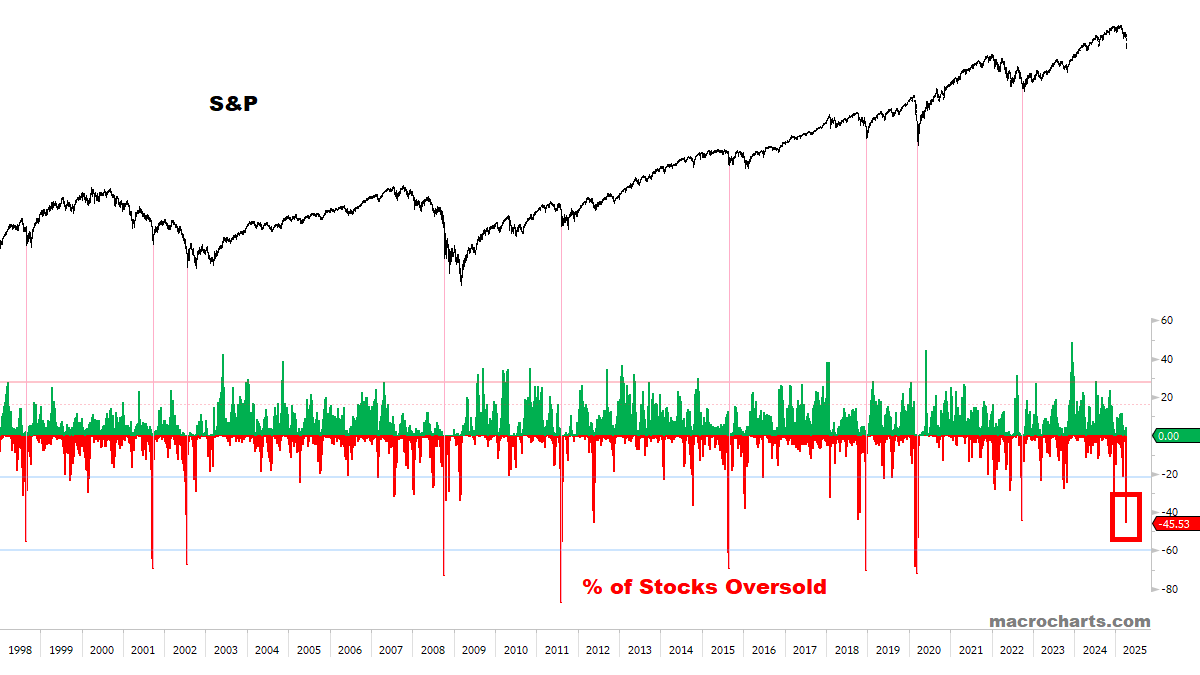
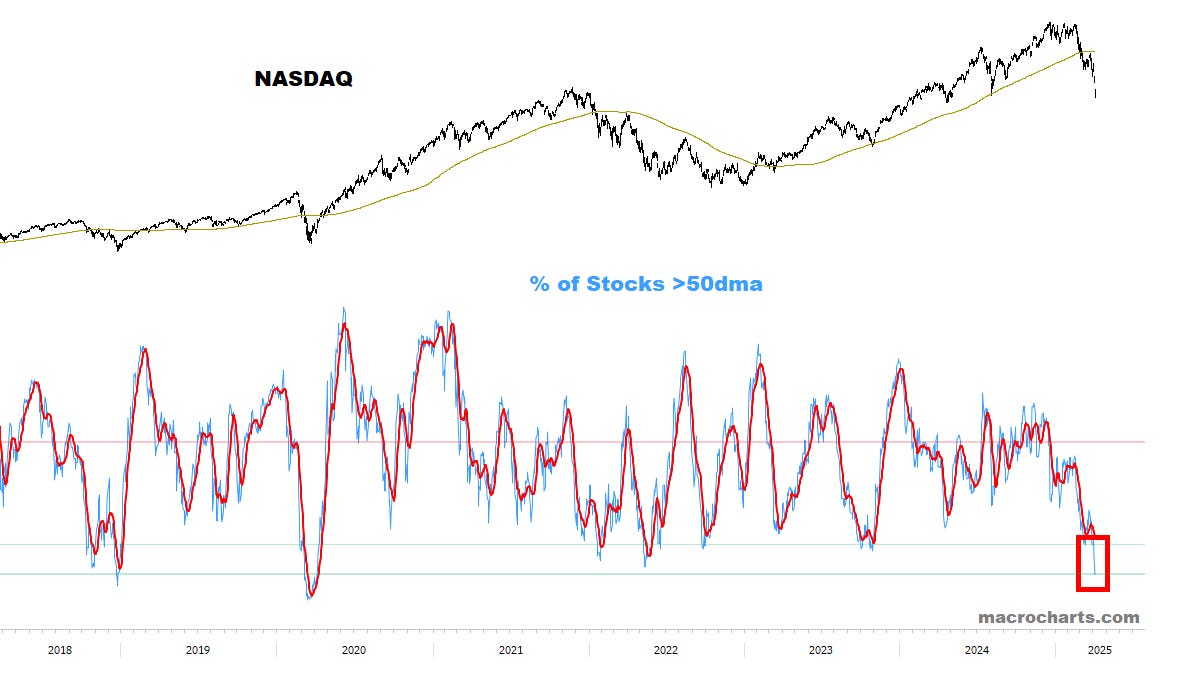
One of the most indiscriminate selling days in history:
*The kind of selling that happens at the deep end of Bear Markets.
Any residual selling Monday would push Stocks to MAJOR bottoming levels.
*Note it’s already worse than the 2022 Bear Market bottom.
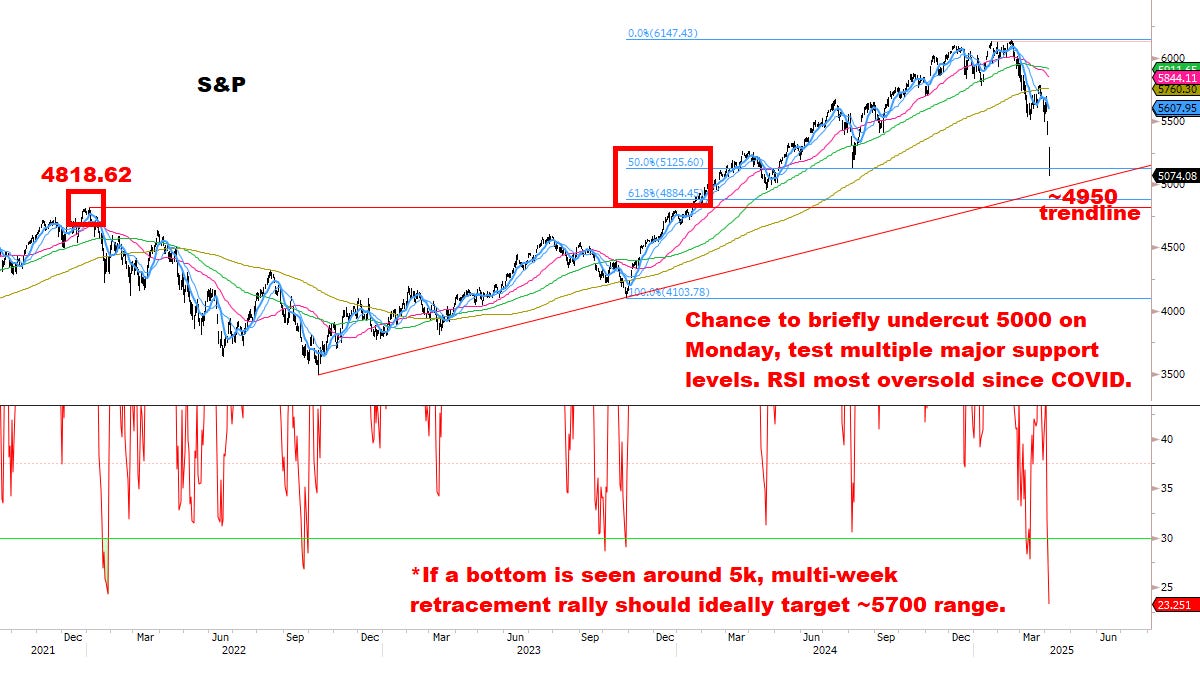
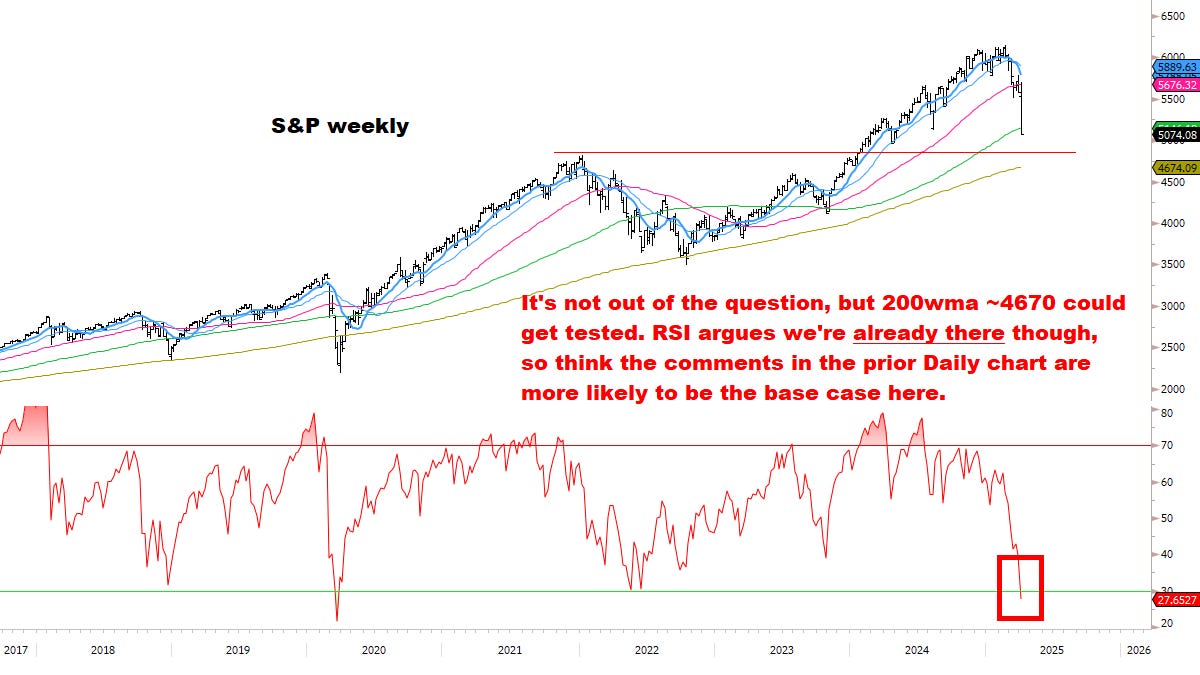
S&P 45% oversold — at 60% would match nearly every major bottom of the last 30 years. Only exception was 2008 (price went lower).
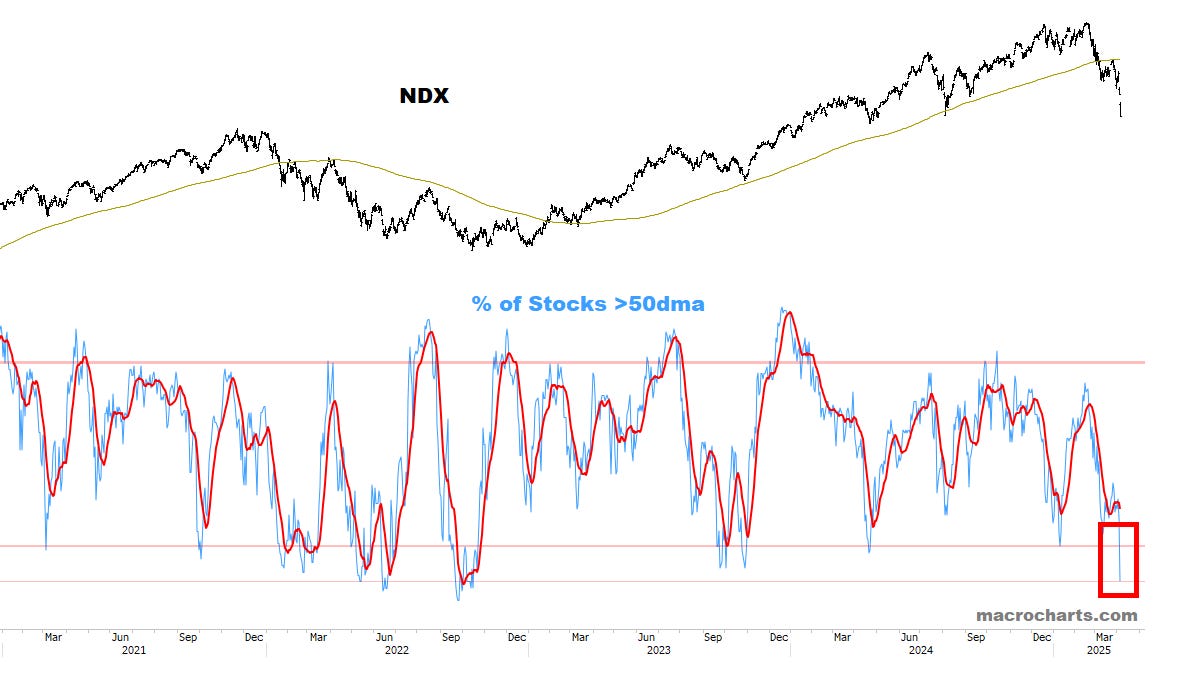
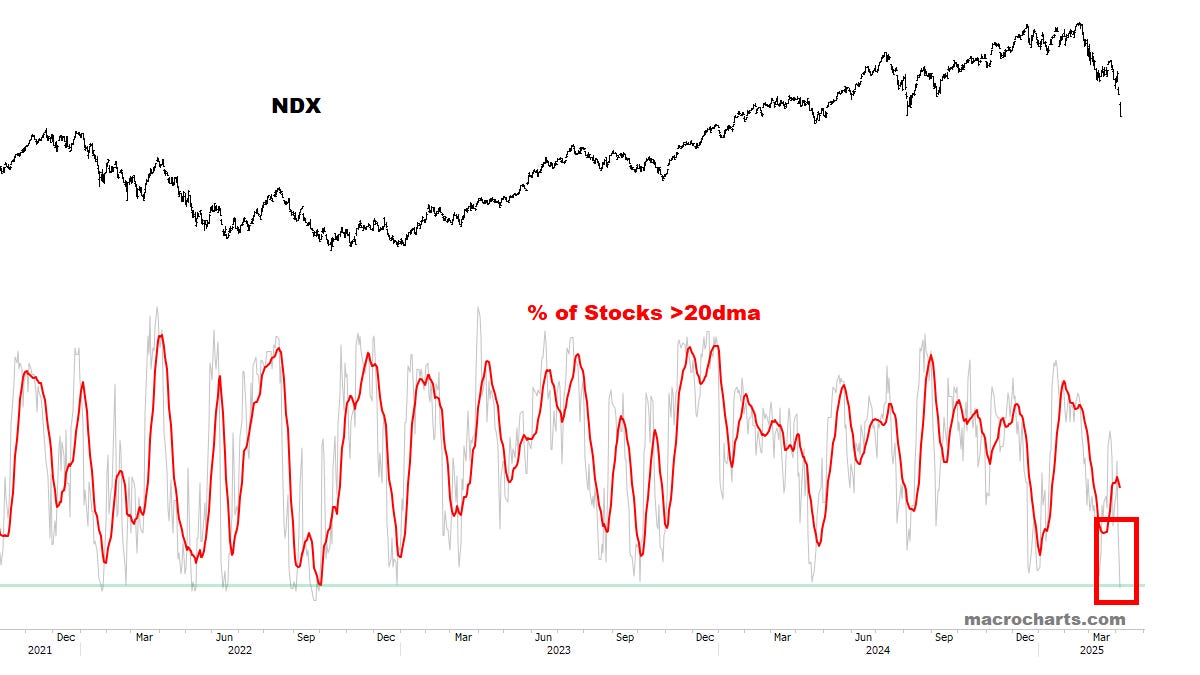
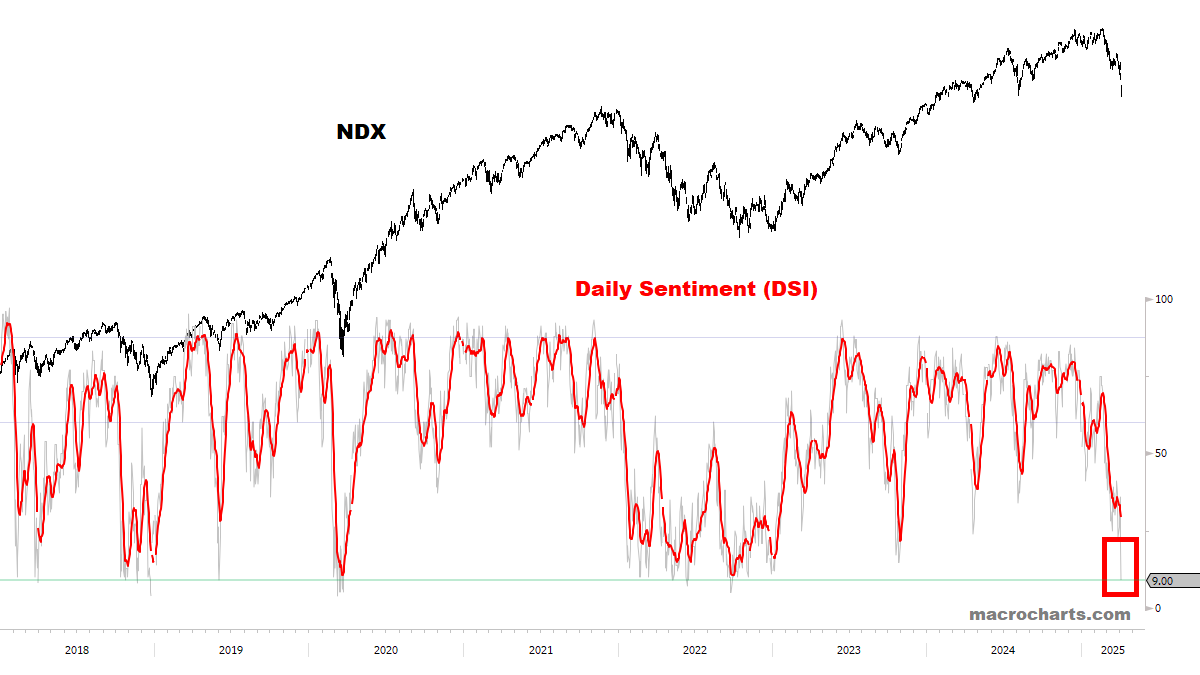
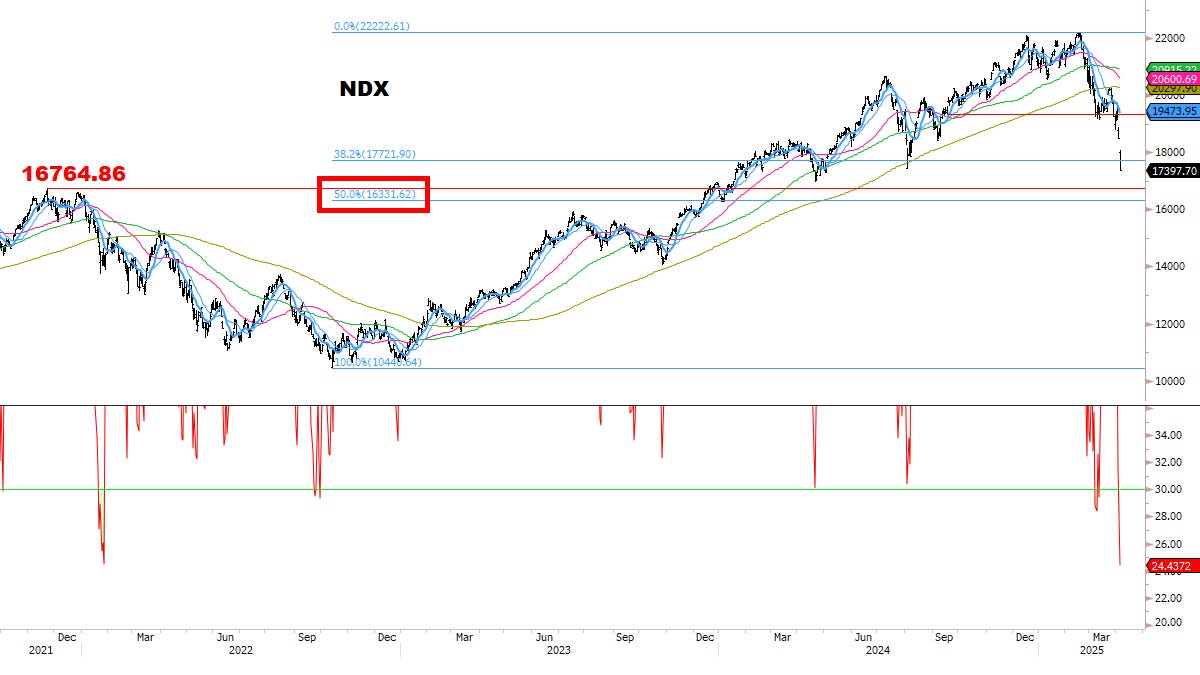
NDX 50% oversold — at 55-65% would match nearly every major bottom of the last 30 years. Only exception was 2008 (price went lower).
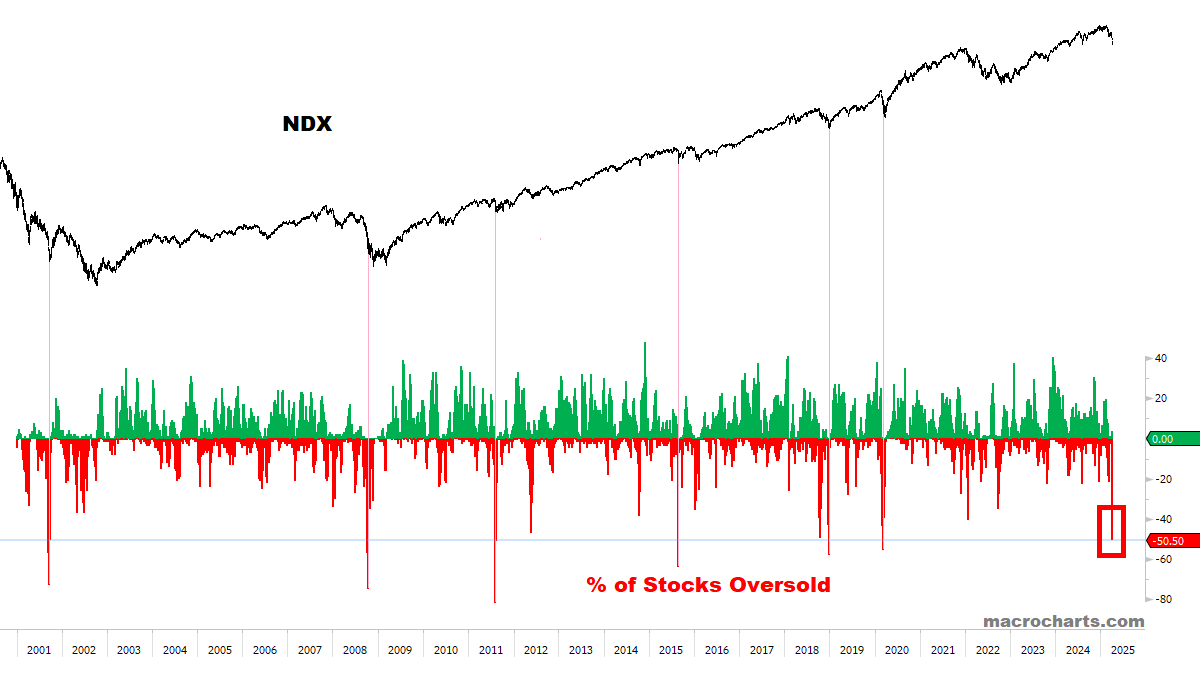
*Another key data point: during the 2020 COVID crash, NDX broke -50% Oversold only ONCE, on March 12. From that close, NDX had an additional loss of 3.4% to the final bottom (closing basis), and 6.8% (intraday basis). This residual downside could quickly be reached on Monday’s session.
I wrote this last week and it’s valid for next week again:
Friday’s decline increases the risk of a Down Monday setup and capitulation / reversal on the balance of next week. It’s not required, but would accelerate the process of finding a bottom for this correction.
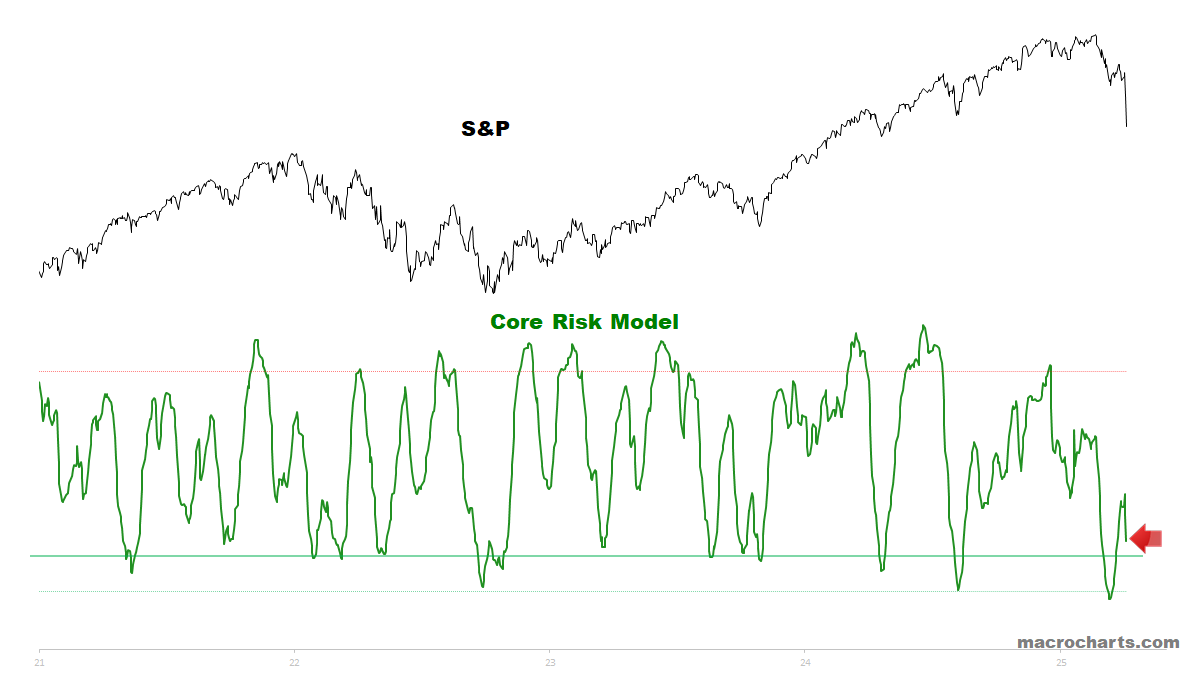
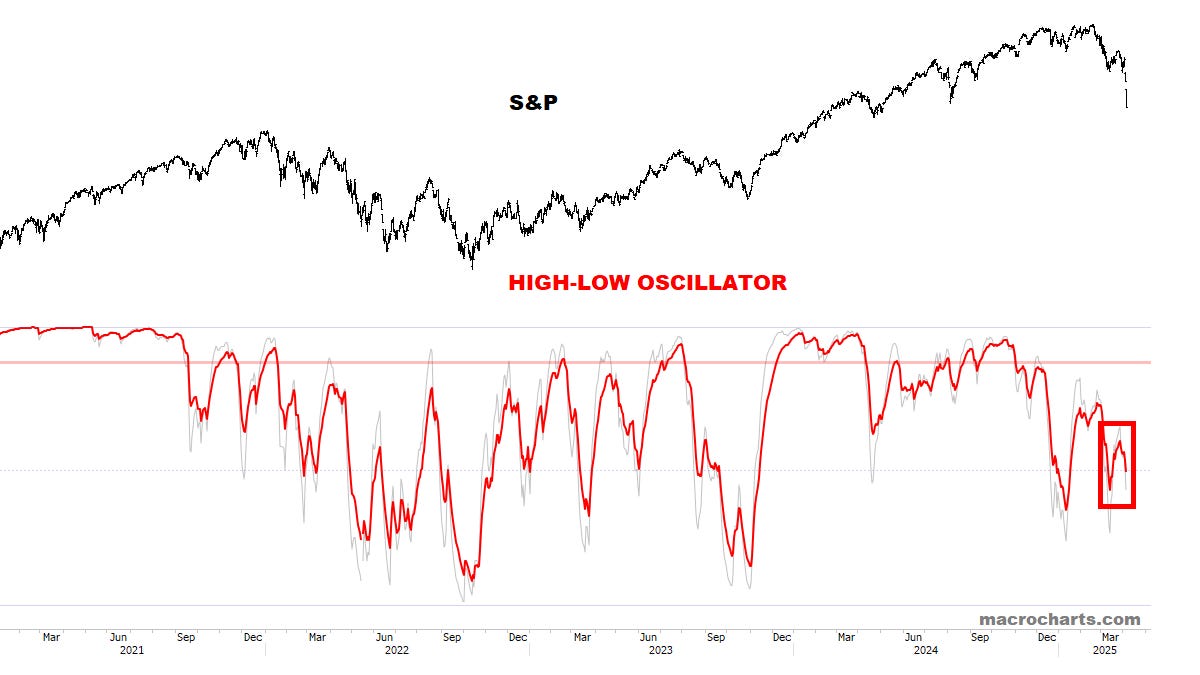
Core Risk will be fully oversold on Monday:
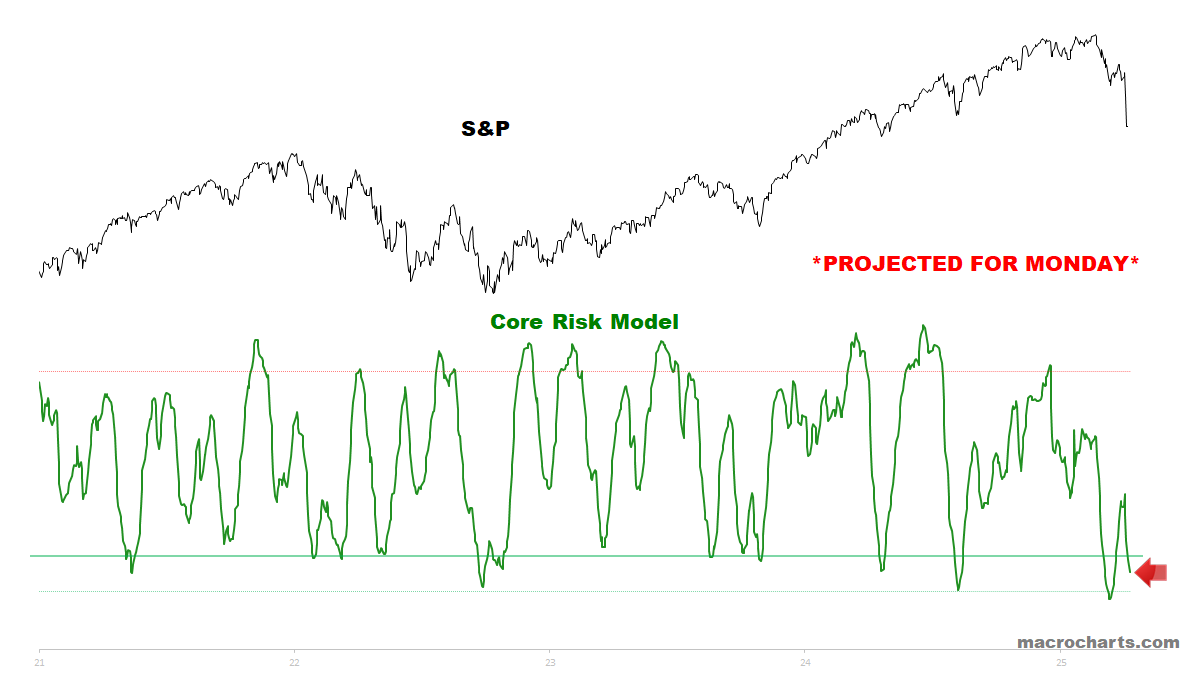
S&P High-Low Oscillator could finally get oversold next week, joining the others which are fully there.
MACD Profiles have a similar message — S&P should soon join the others.
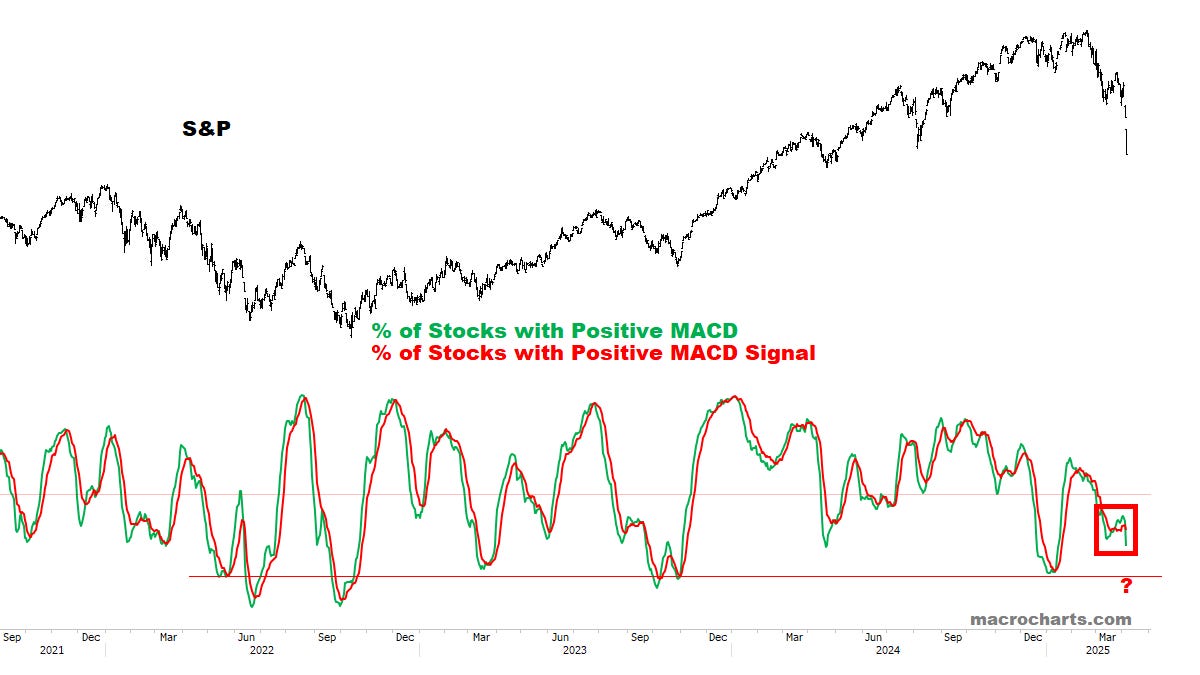
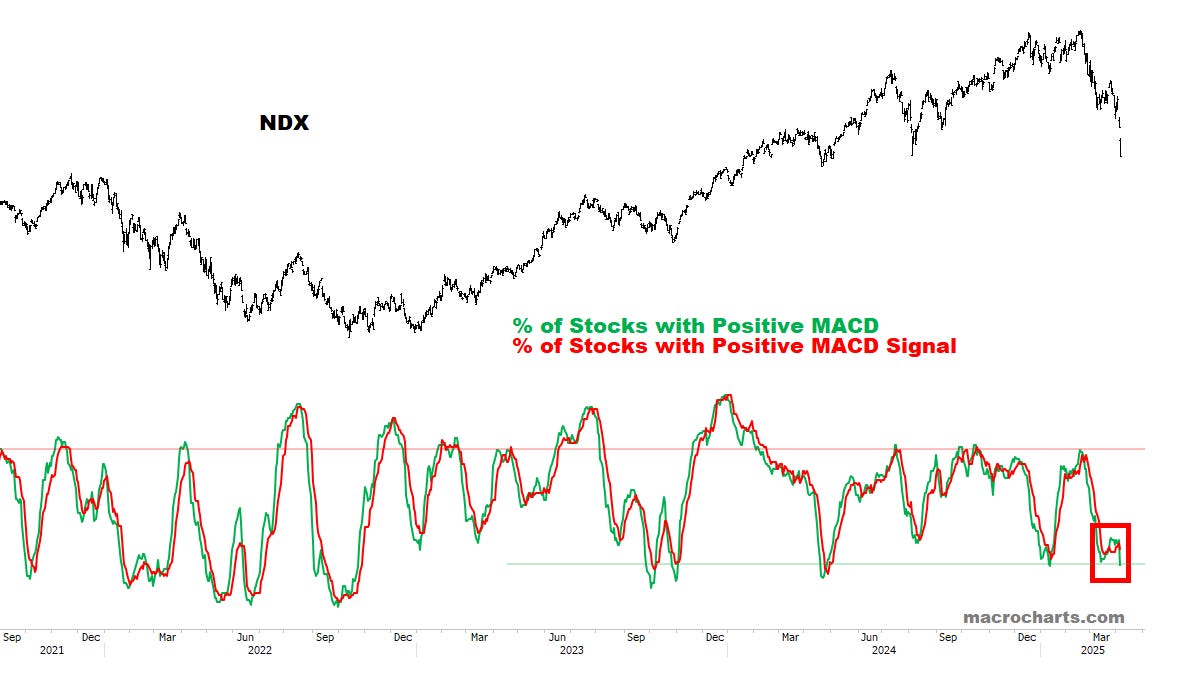
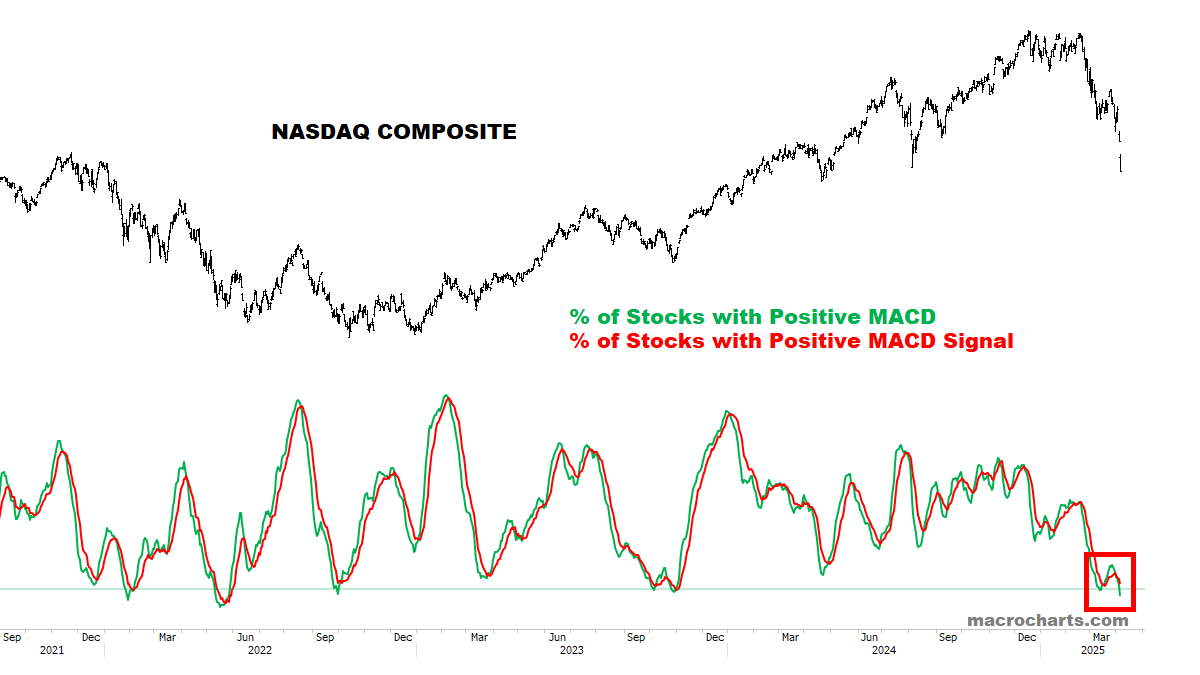
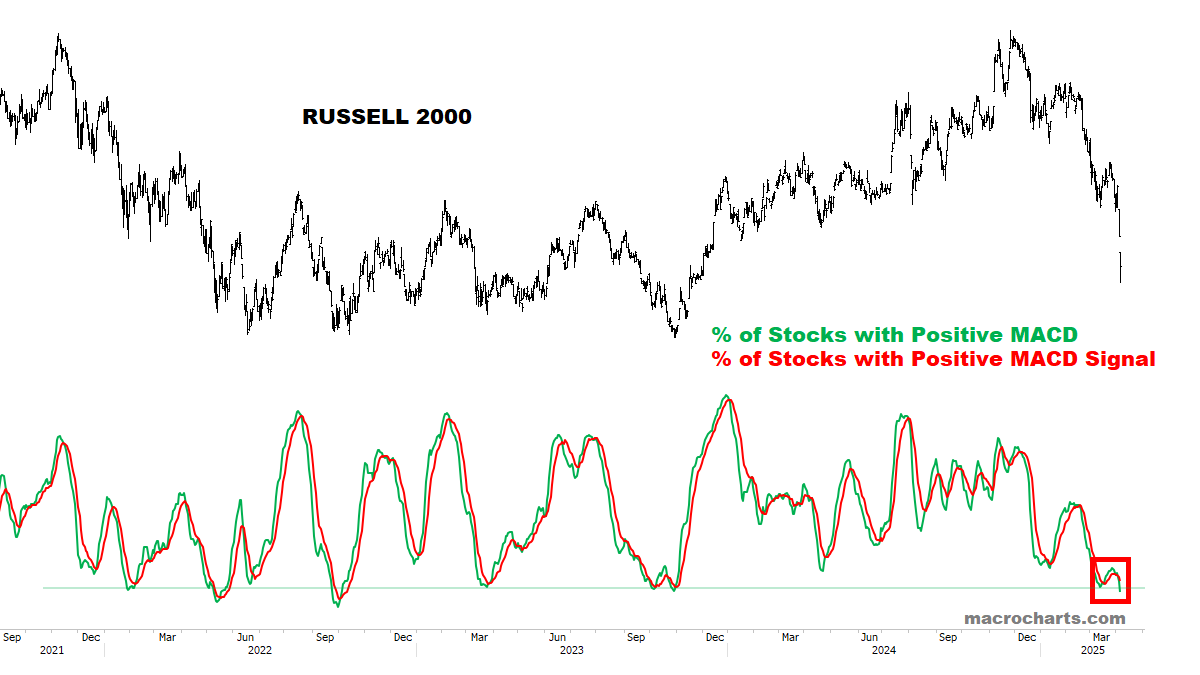
Intermediate-Term Breadth is “rock-bottom” oversold.

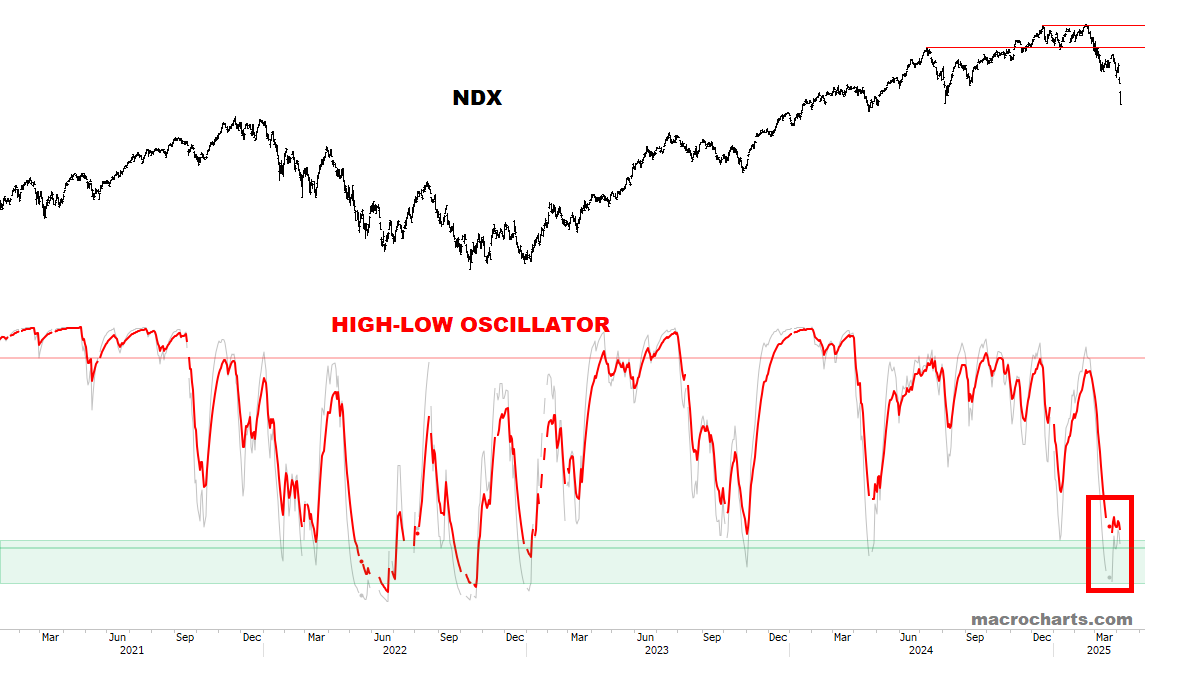
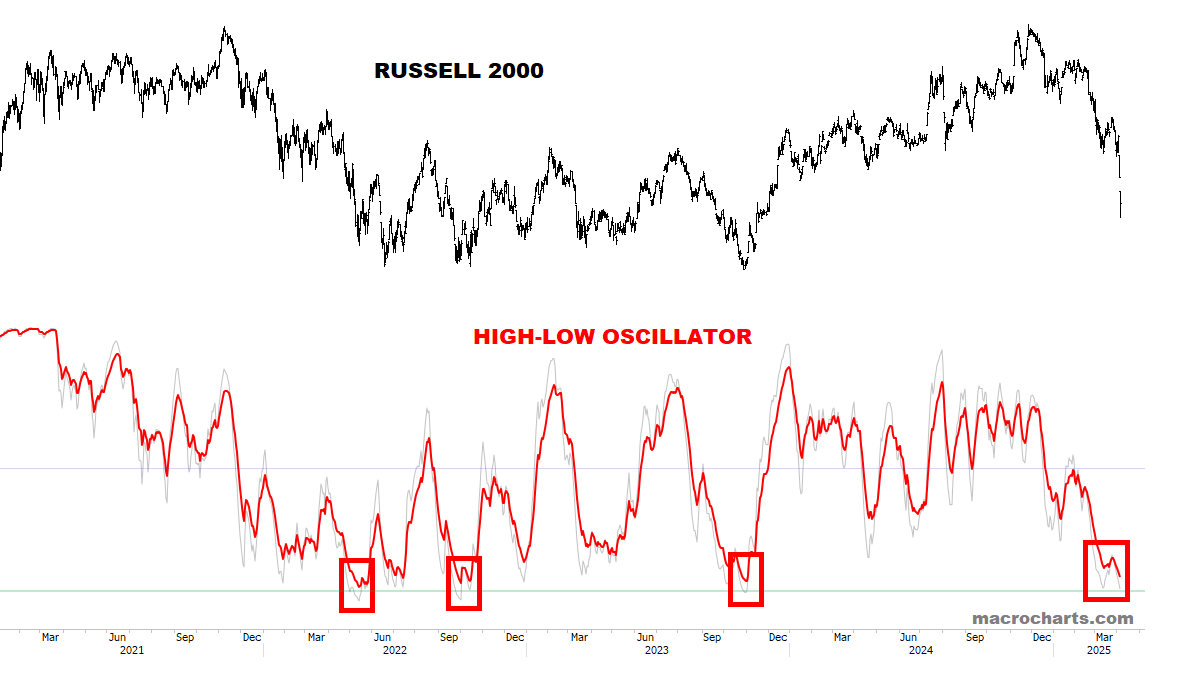
The following are at 2020-oversold levels.

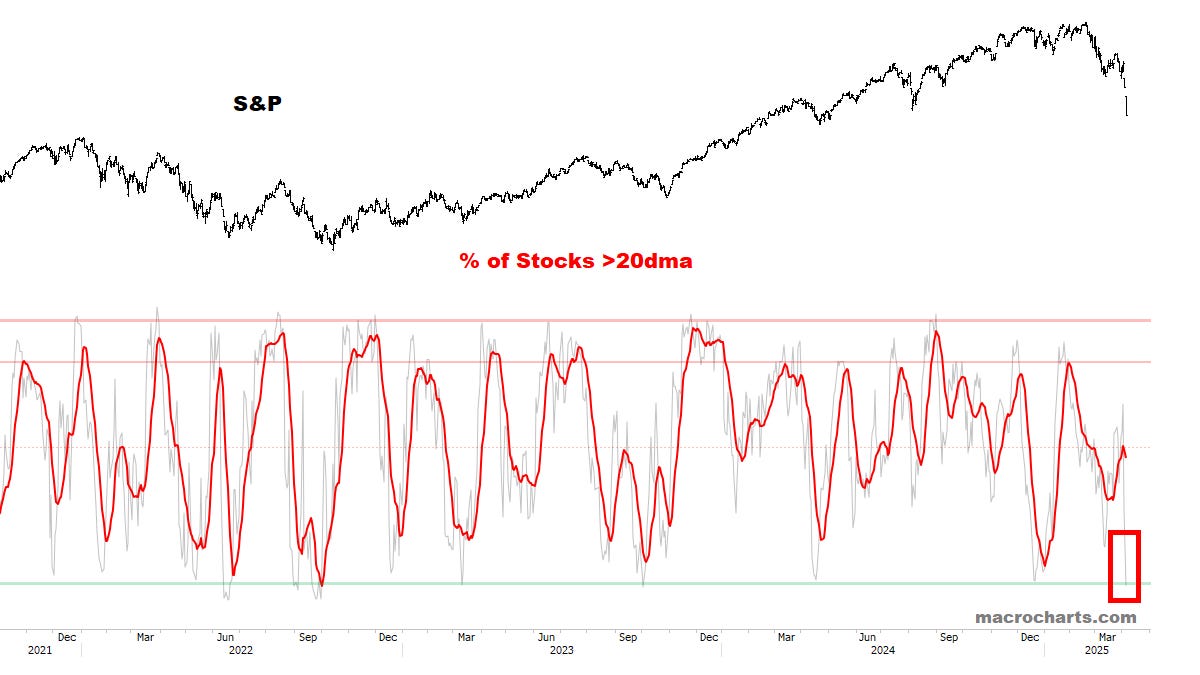
S&P Short-Term Breadth has finally joined the others at “max oversold”. These are extremely rare conditions likely to produce an immediate reaction next week.
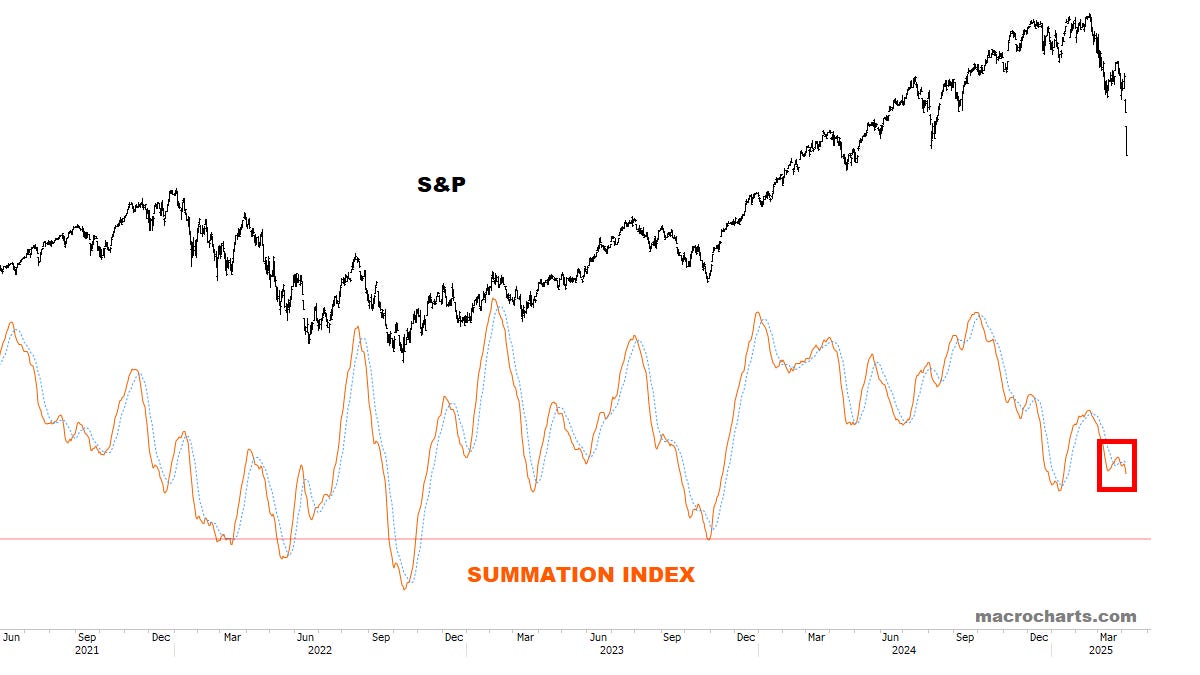
Summation Index dropped a bit this week, but could quickly turn into a Buy signal if Stocks bottom here:
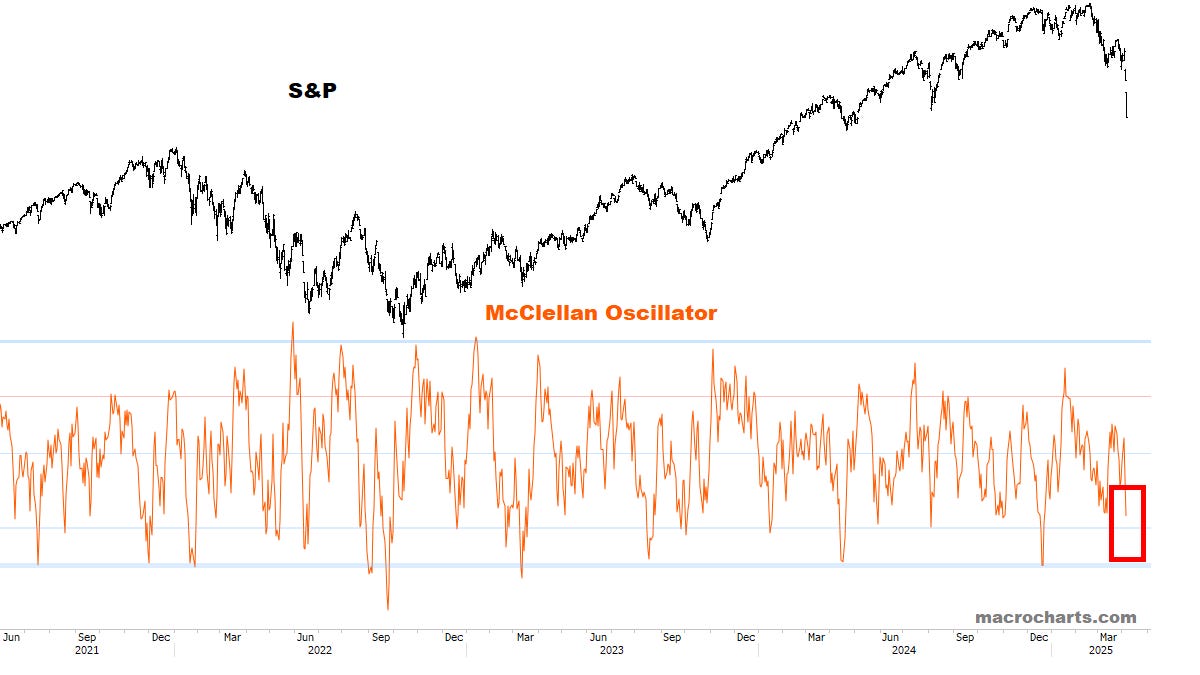
McClellan Oscillator is following the ideal setup, on track to reach full oversold next week:
TREND & SENTIMENT
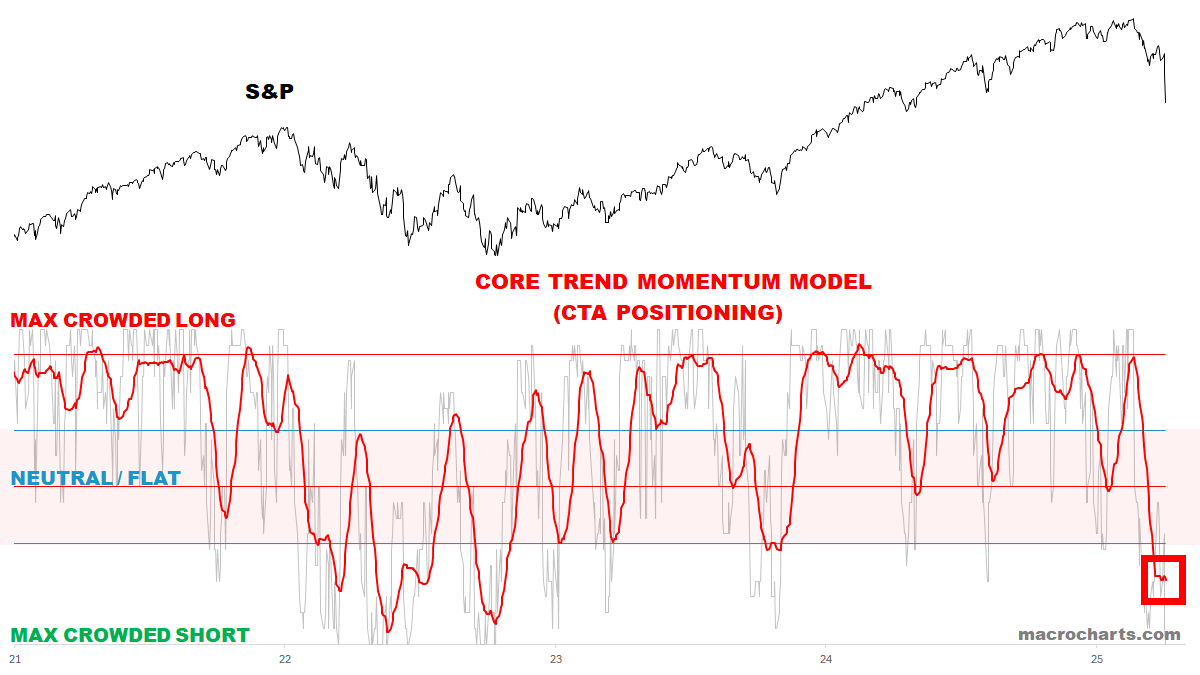
CTA Equity Positioning remains at the lowest since the October 2022 Bear Market bottom.
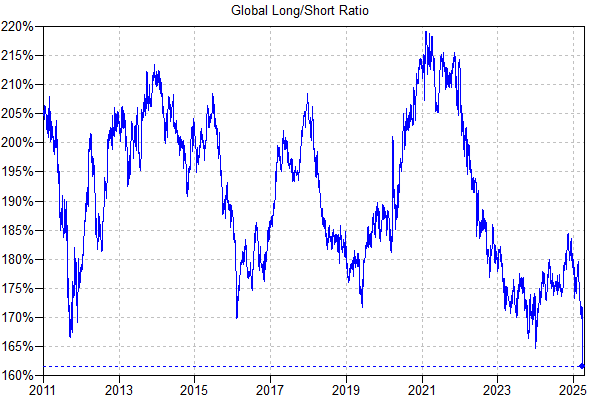
From GS, Global Funds’ Long/Short Ratio just made an all-time low.
Sentiment is at full capitulation levels — fulfilling the scenario proposed last week.
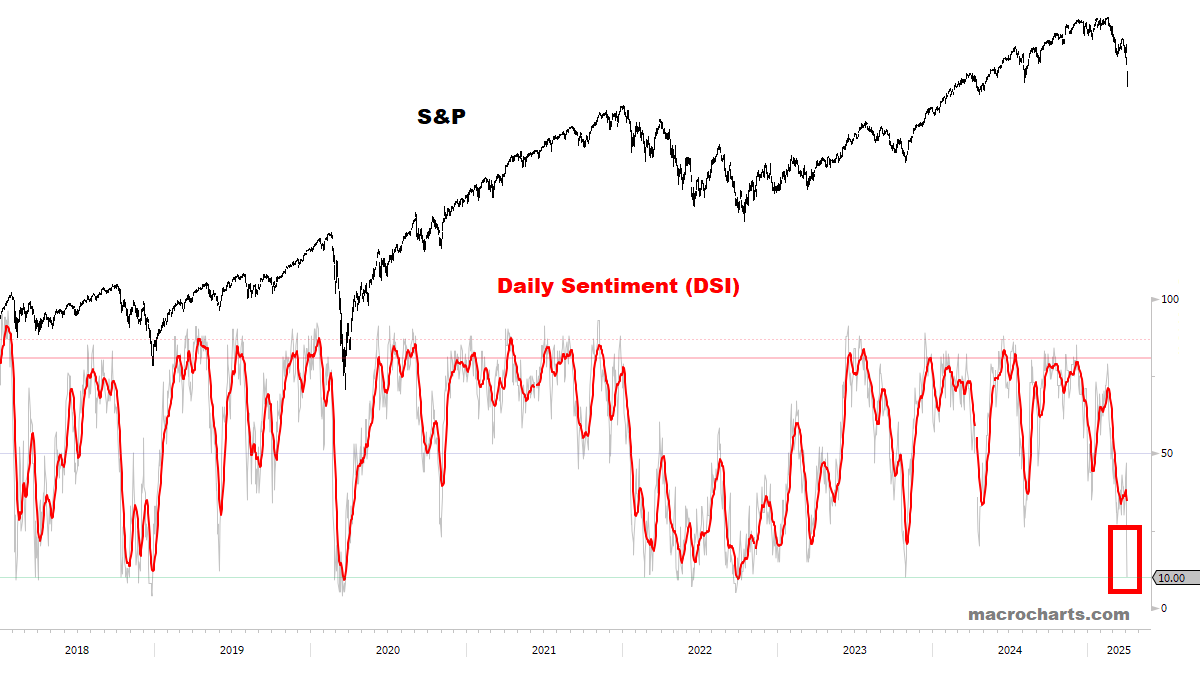
VIX Sentiment is at 77 — last time at this level was on March 10 (DSI 78). The market last bottomed March 13.
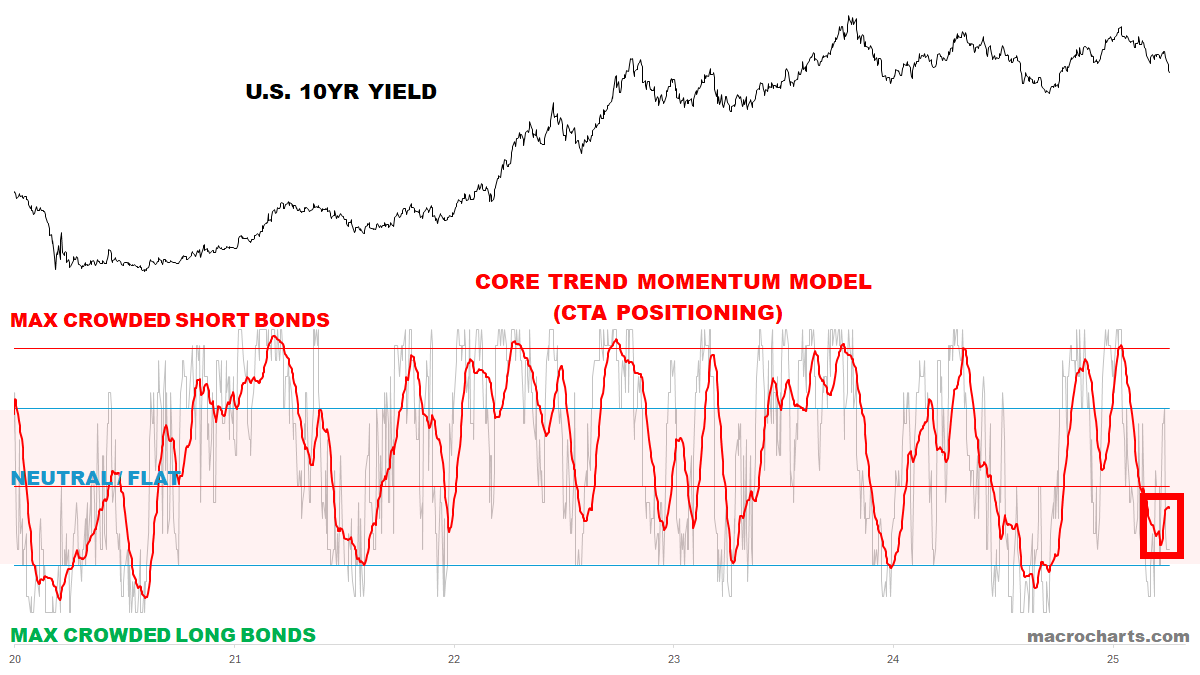
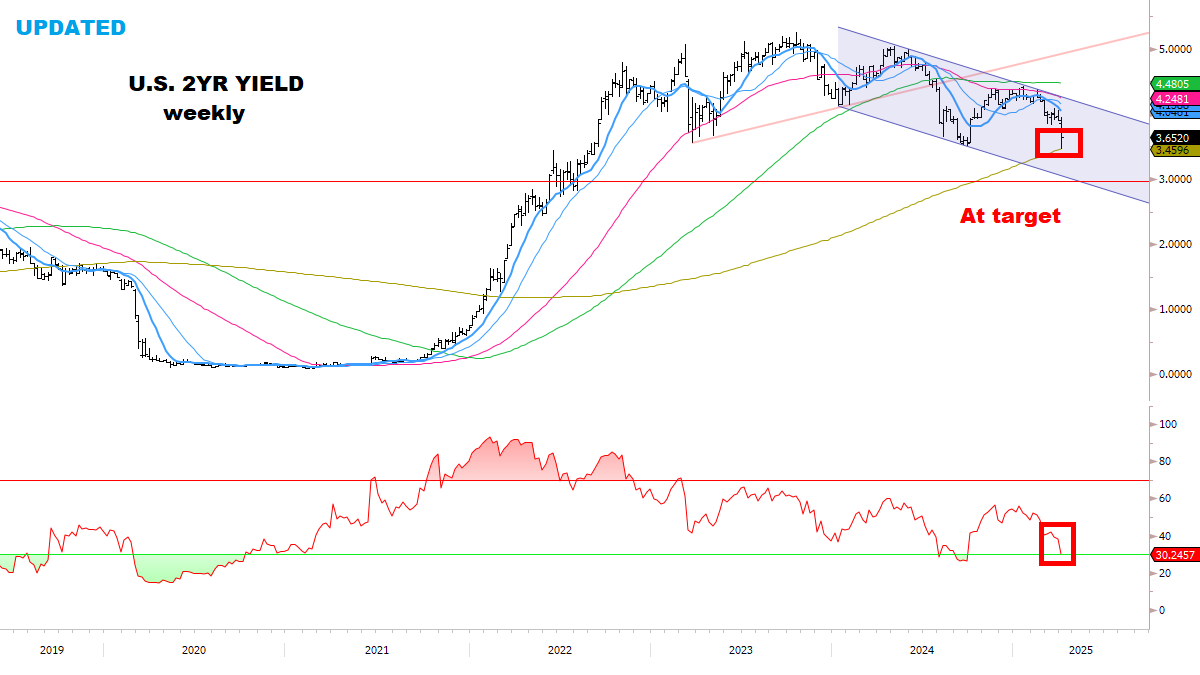
CTA Rates Positioning is in a neutral state here, turning up from the bottom of the range.
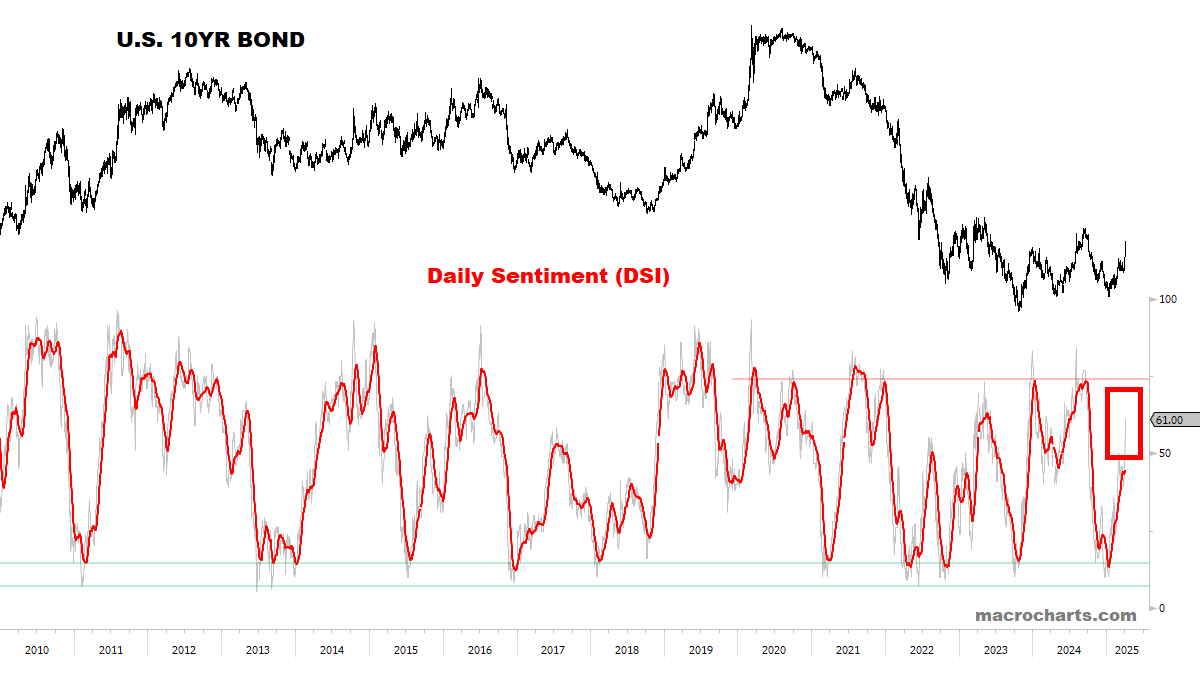
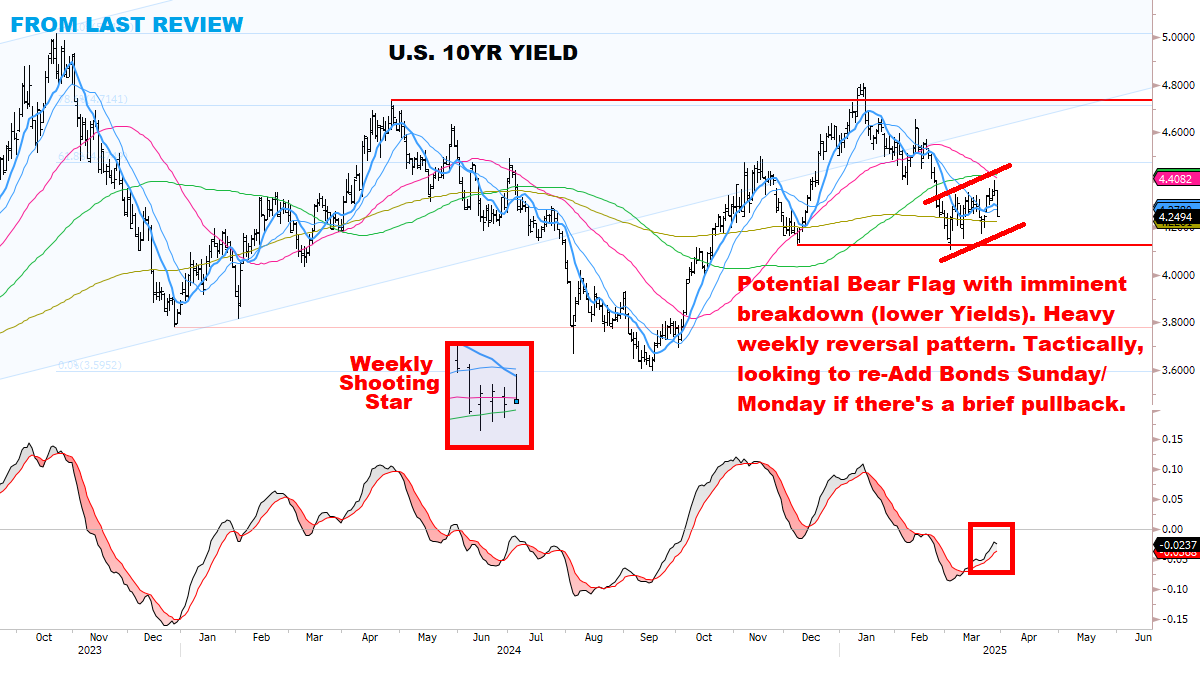
Bond Sentiment is starting to spike but is not quite overbought yet. It remains to be seen if Bonds continue their move here — we’ll discuss this in the Charts section.
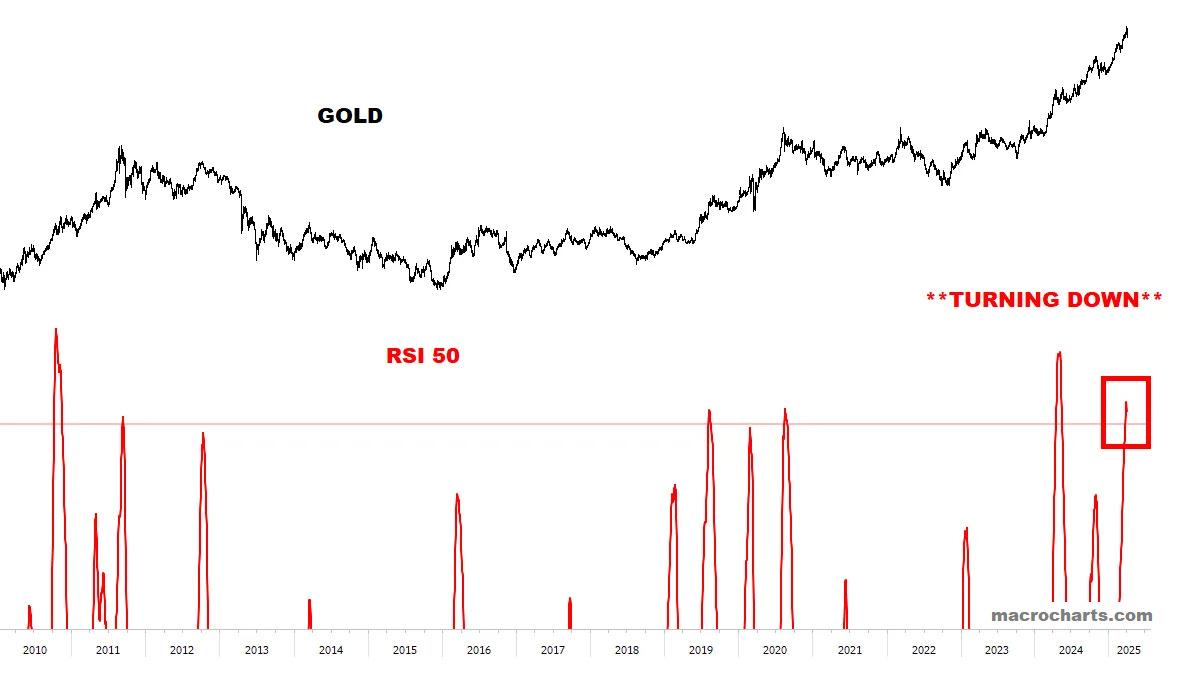
CTA Gold Positioning is stretched again.

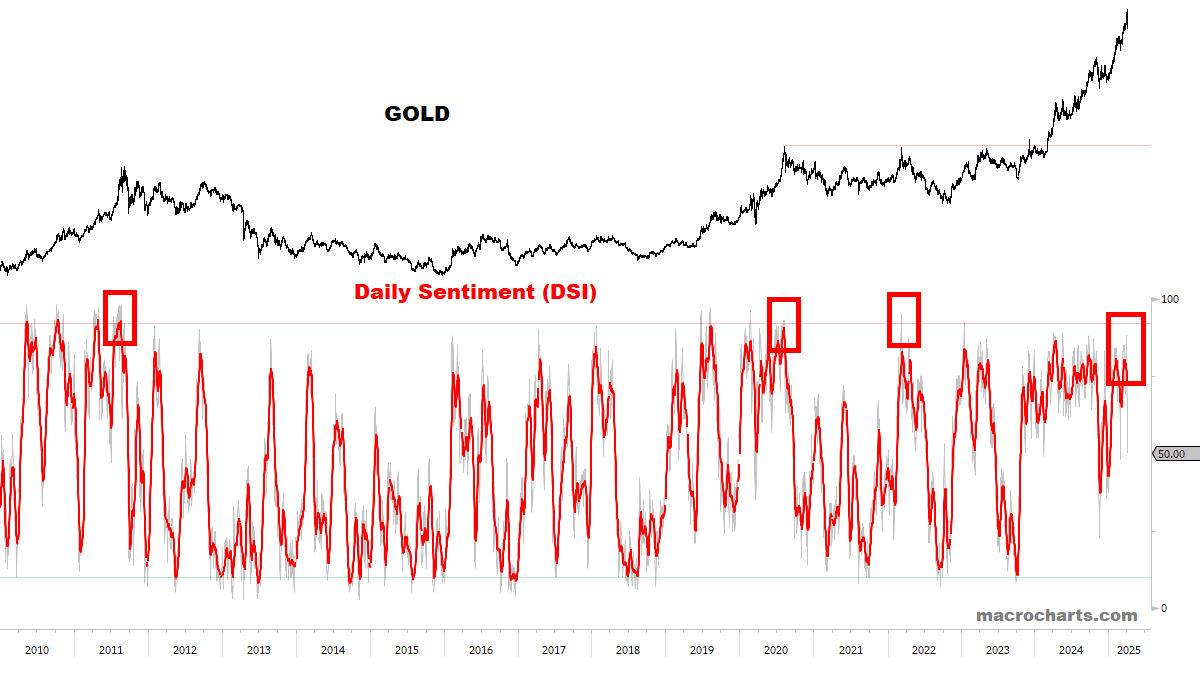
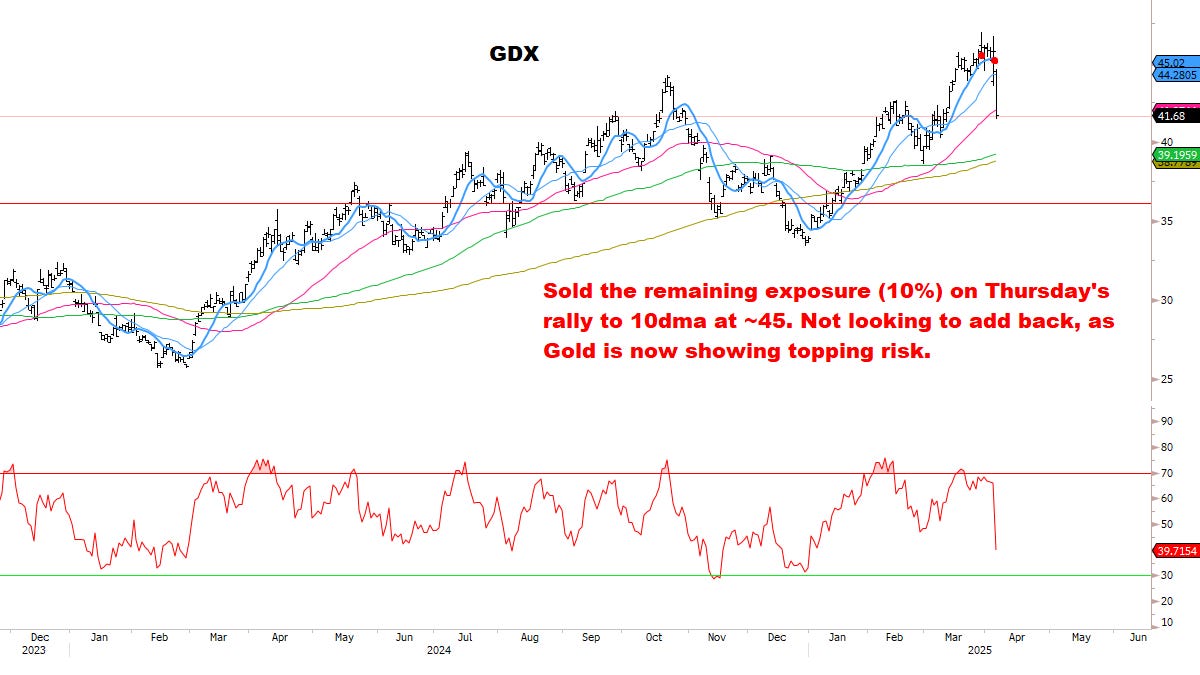
Gold is historically overbought and likely to correct for a few months — think this would strongly align with Stocks finding a bottom here:
*Gold is now on negative watch in our Market Dashboard.
Gold Sentiment never got extended — so I’d lean to a trend correction here, rather than a major top. It may bounce next week as part of a topping process, but if Long I’d use that to start reducing exposure.
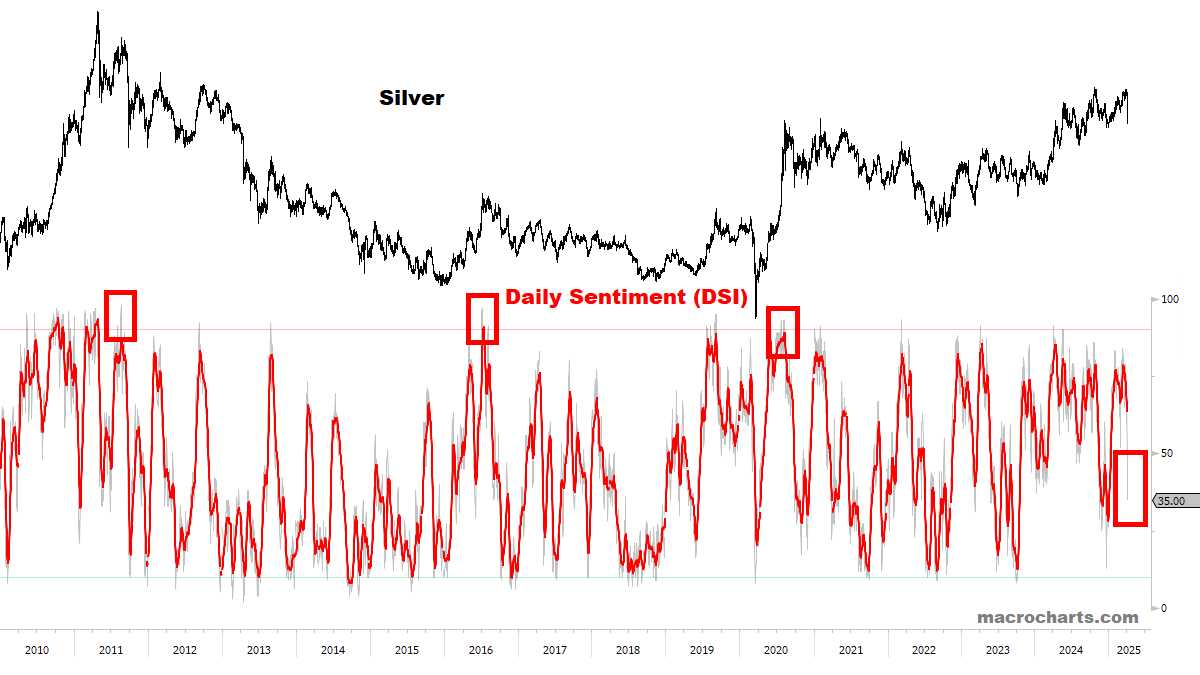
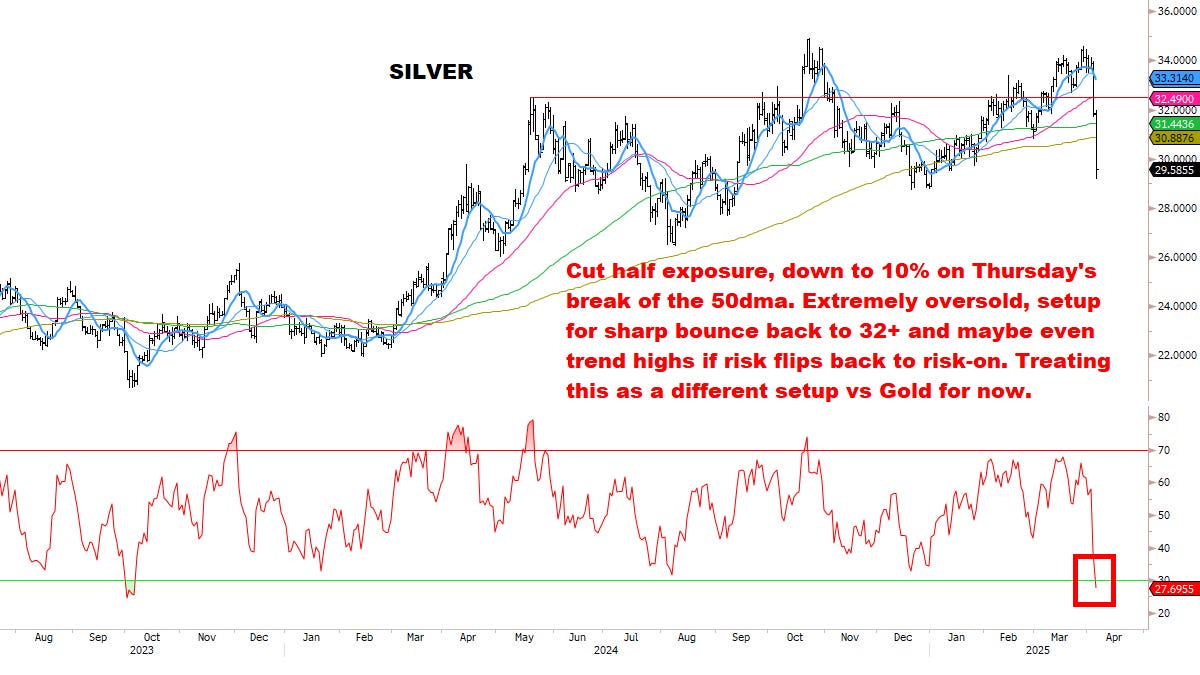
Silver has traded more like a risk-on in this tape (unlike Gold), so I’d lean to Buy it next week for a snapback rally, possibly even back to the recent highs. This is covered in the next section also.
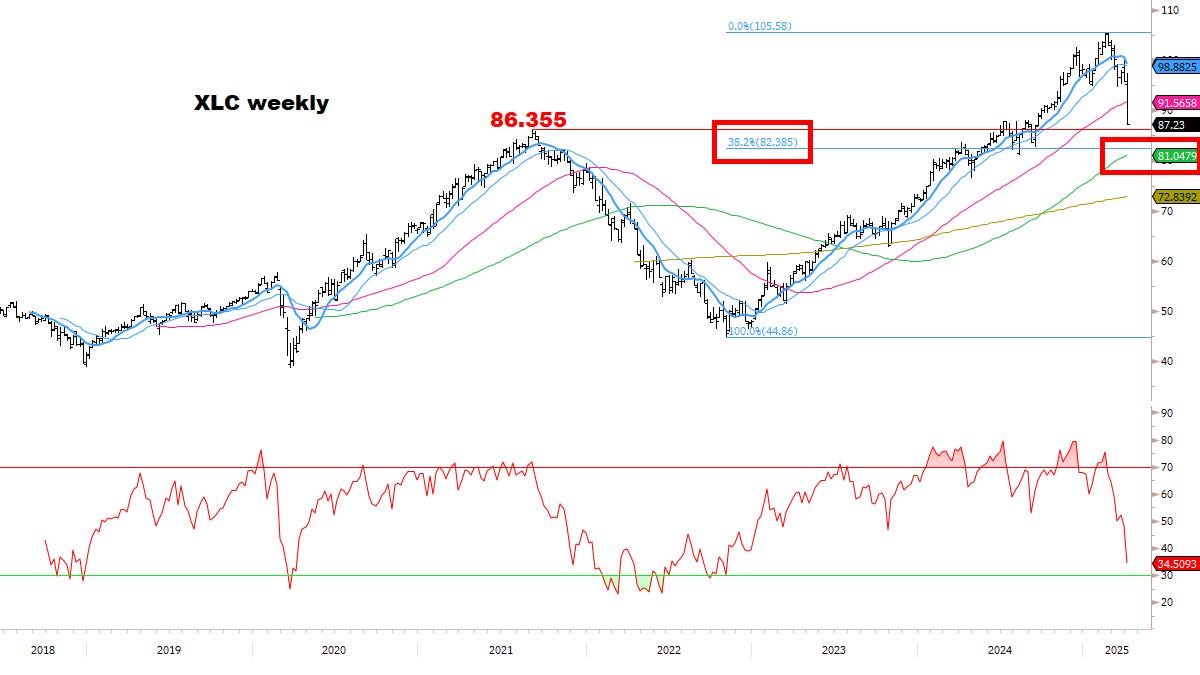
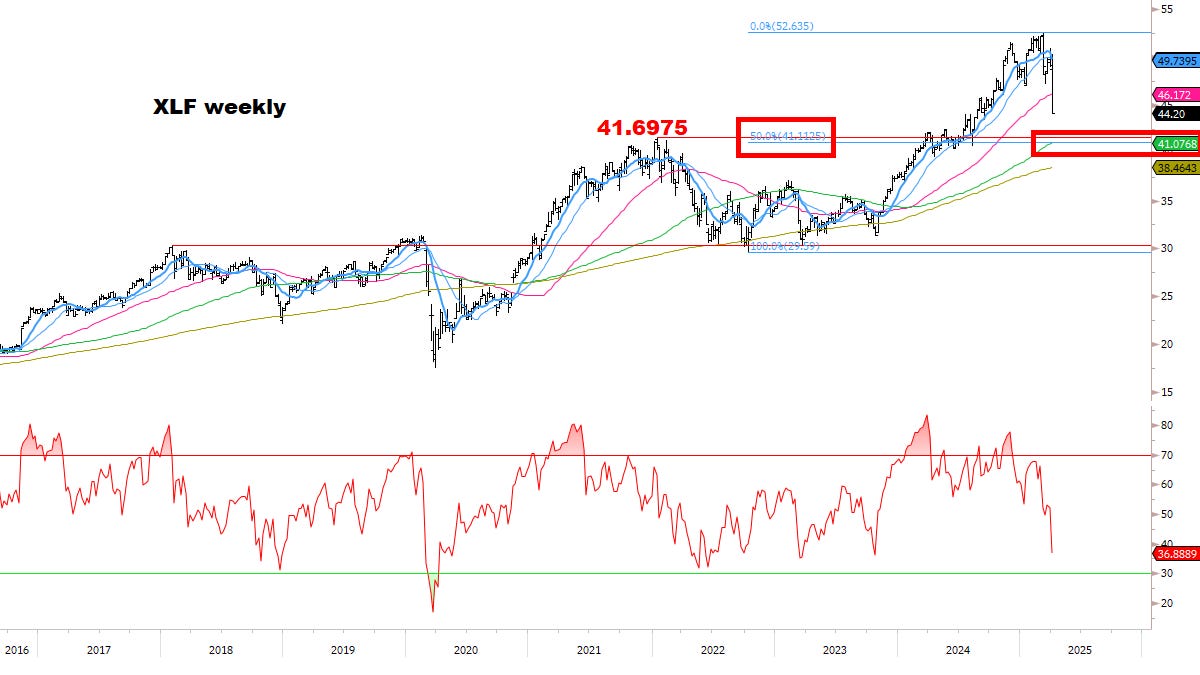
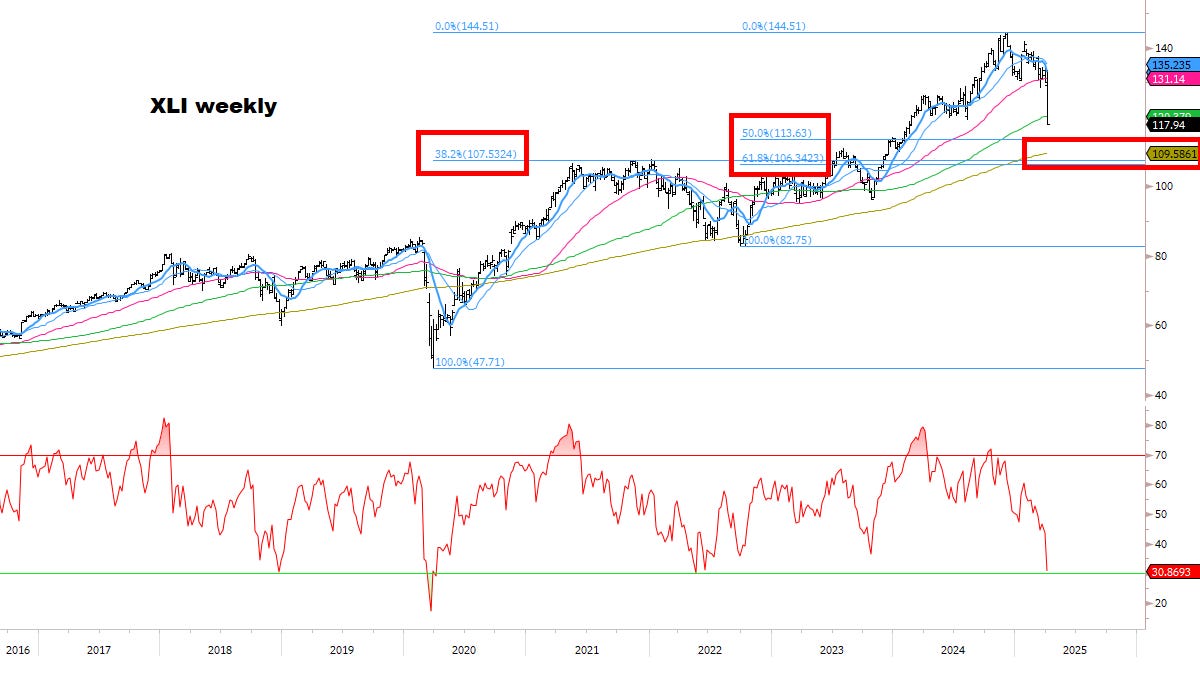
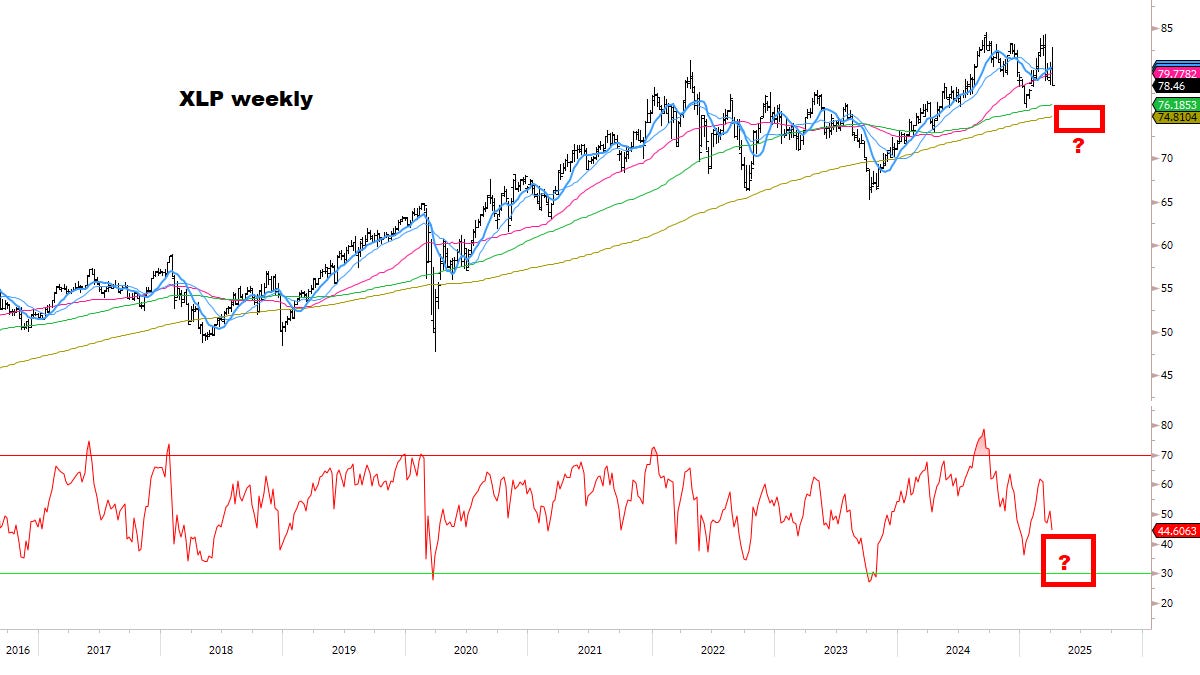
KEY TECHNICAL CHARTS
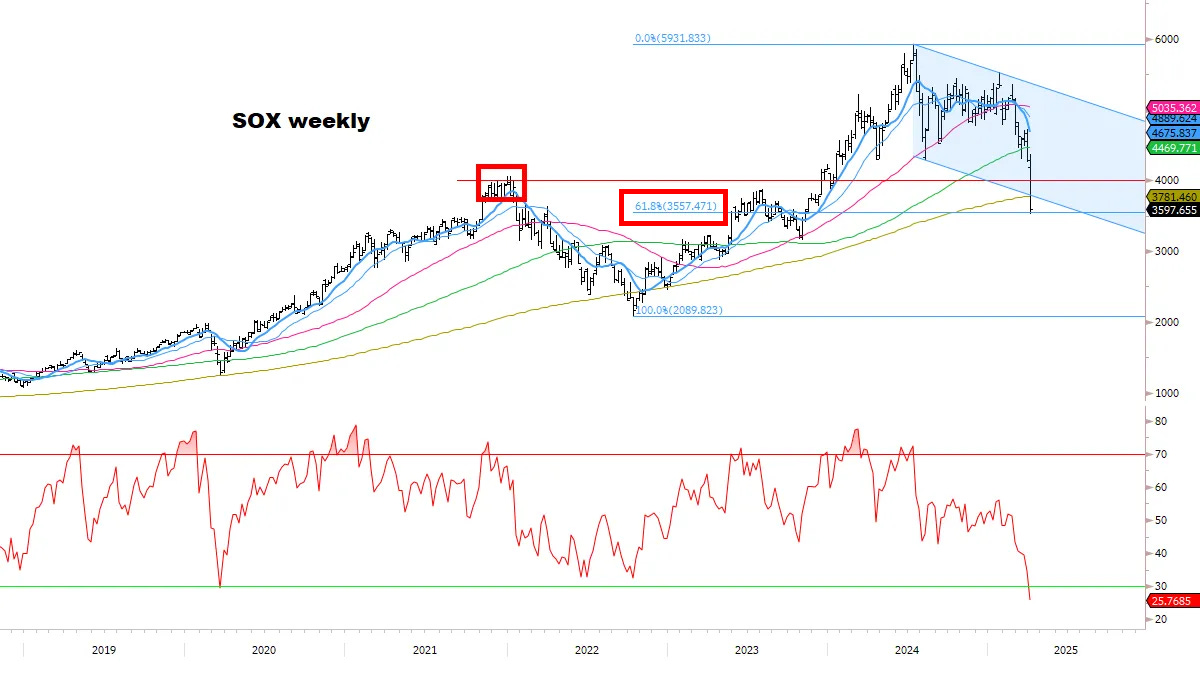
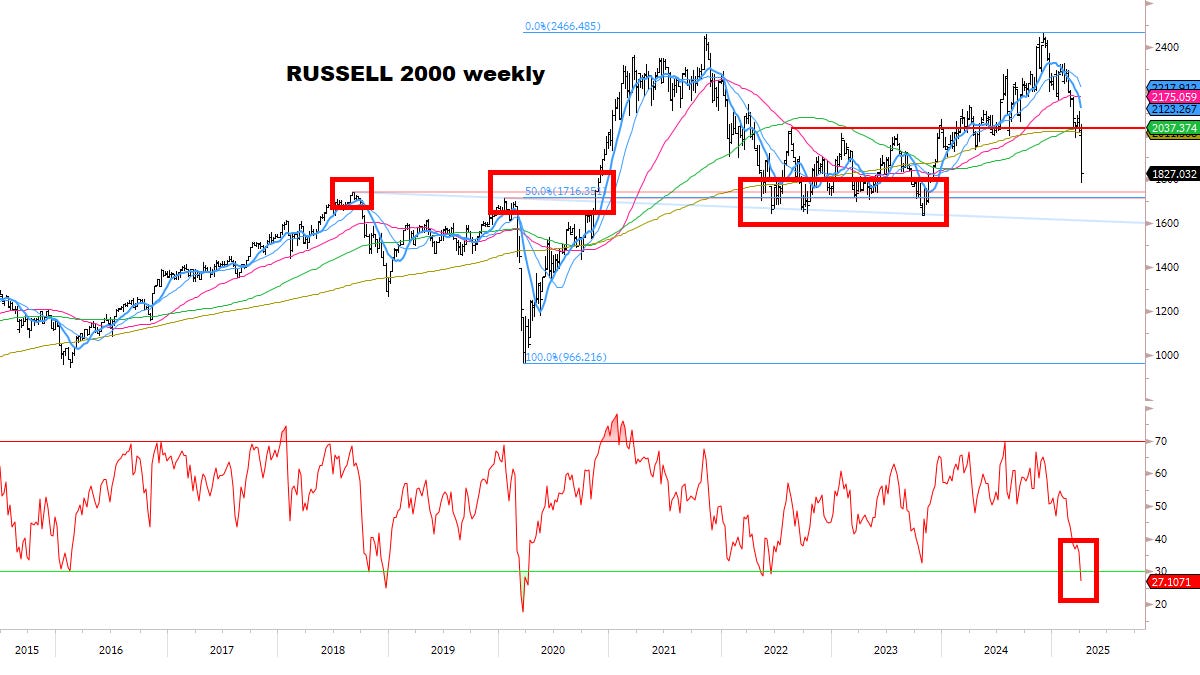
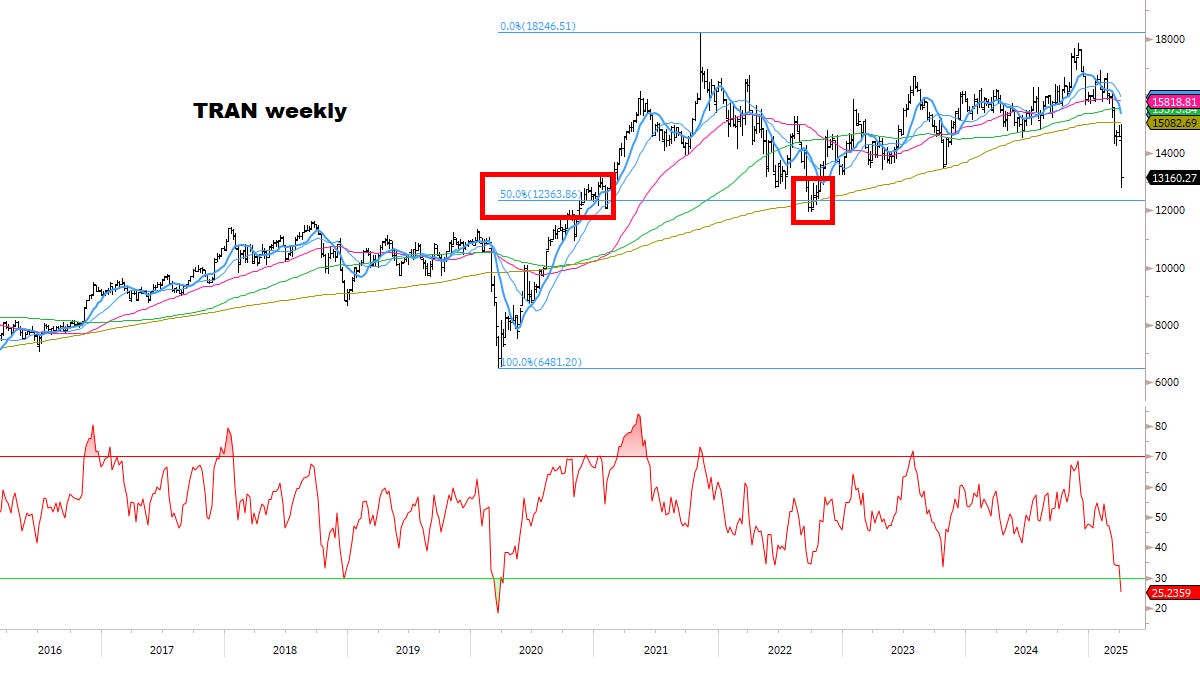
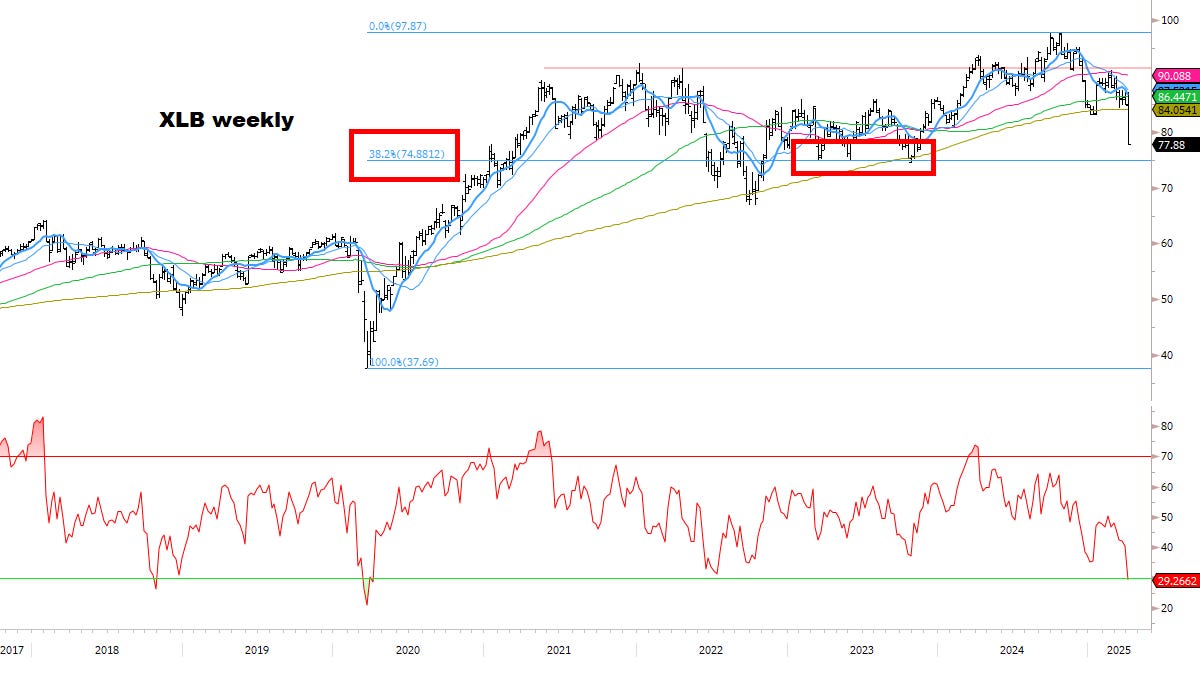
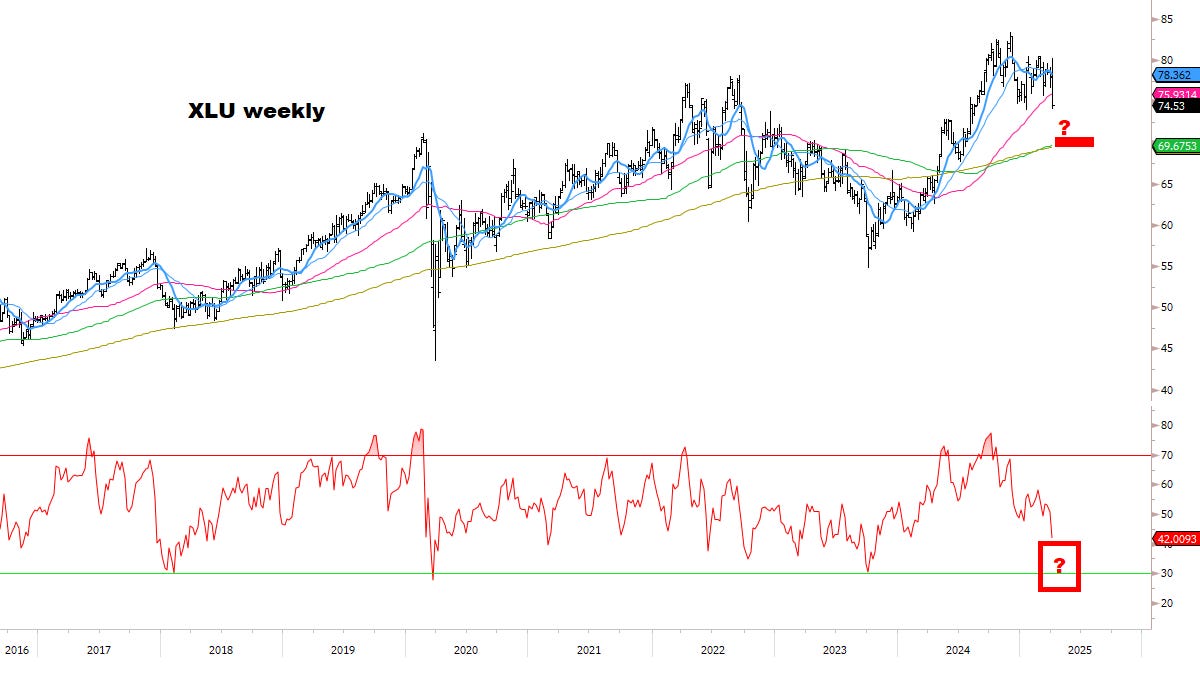
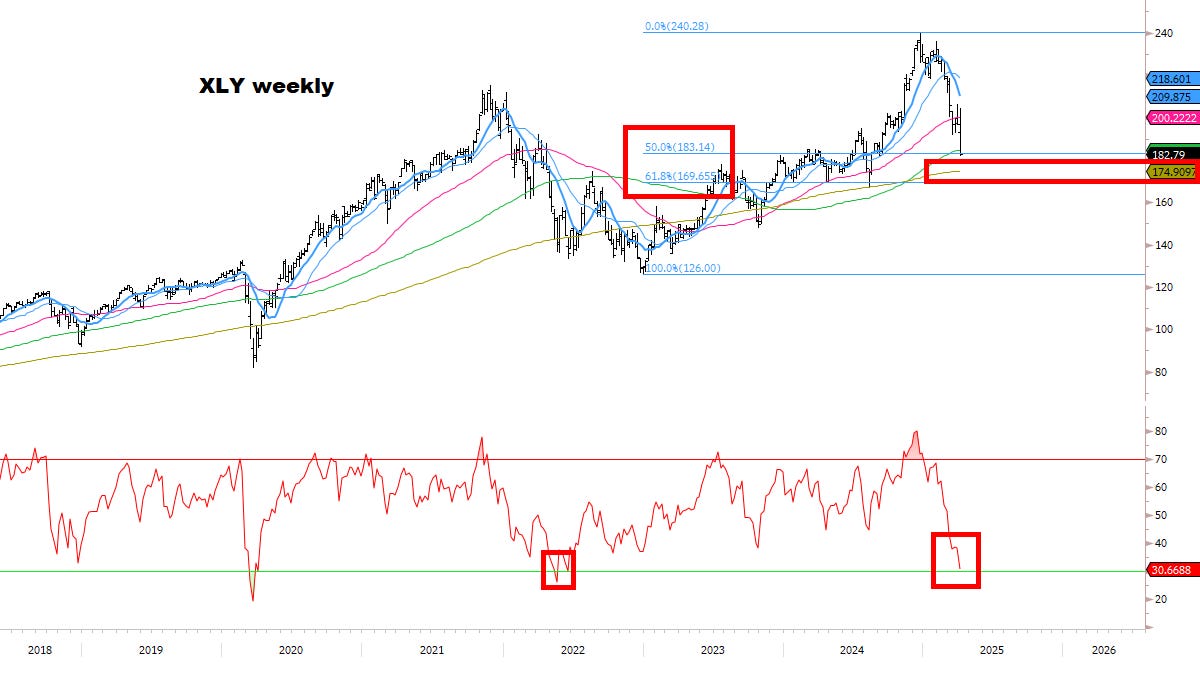
STOCKS
A crisis of historic magnitude — and lasting significance.
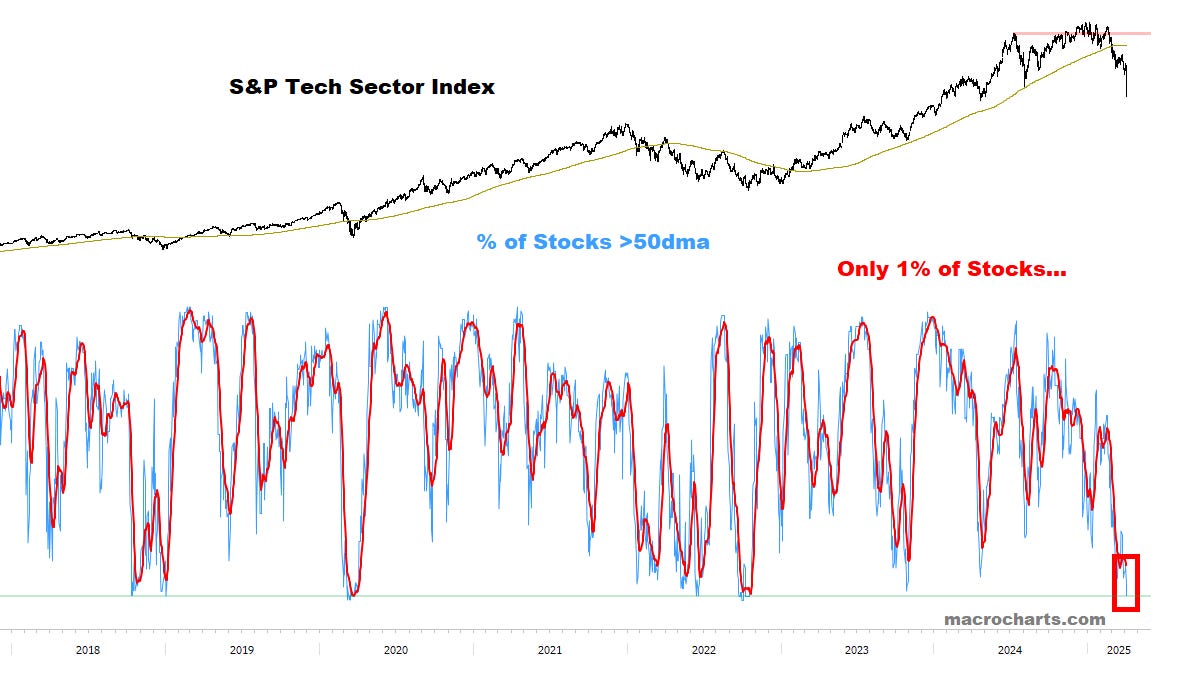
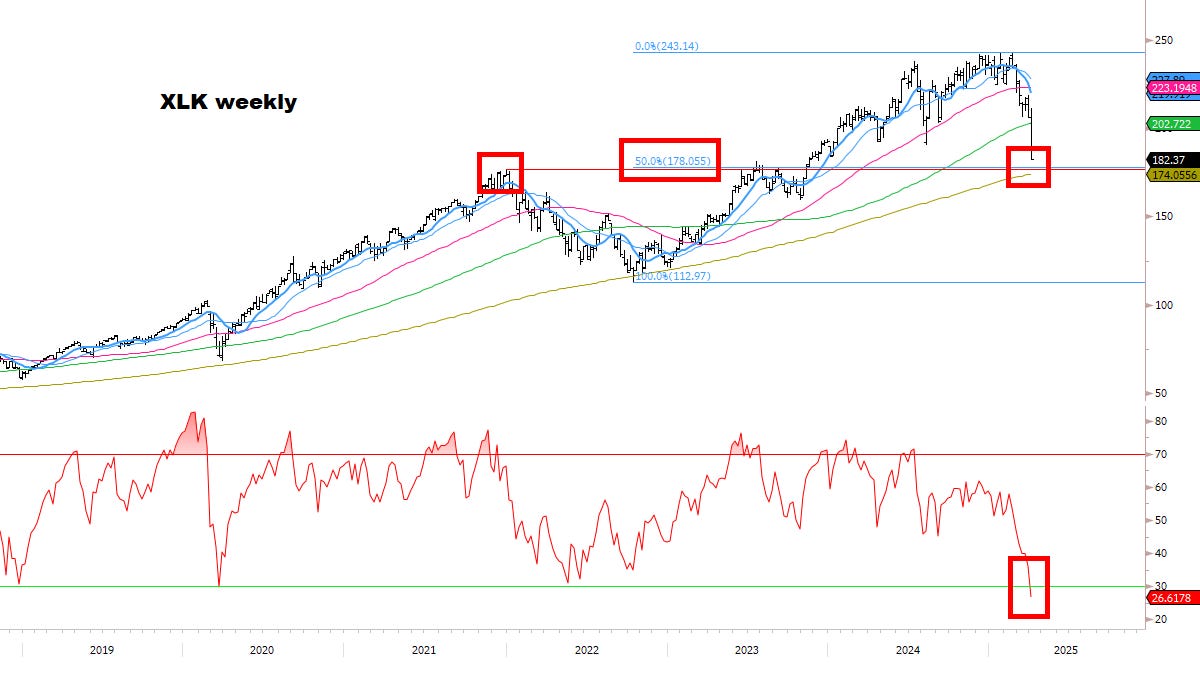
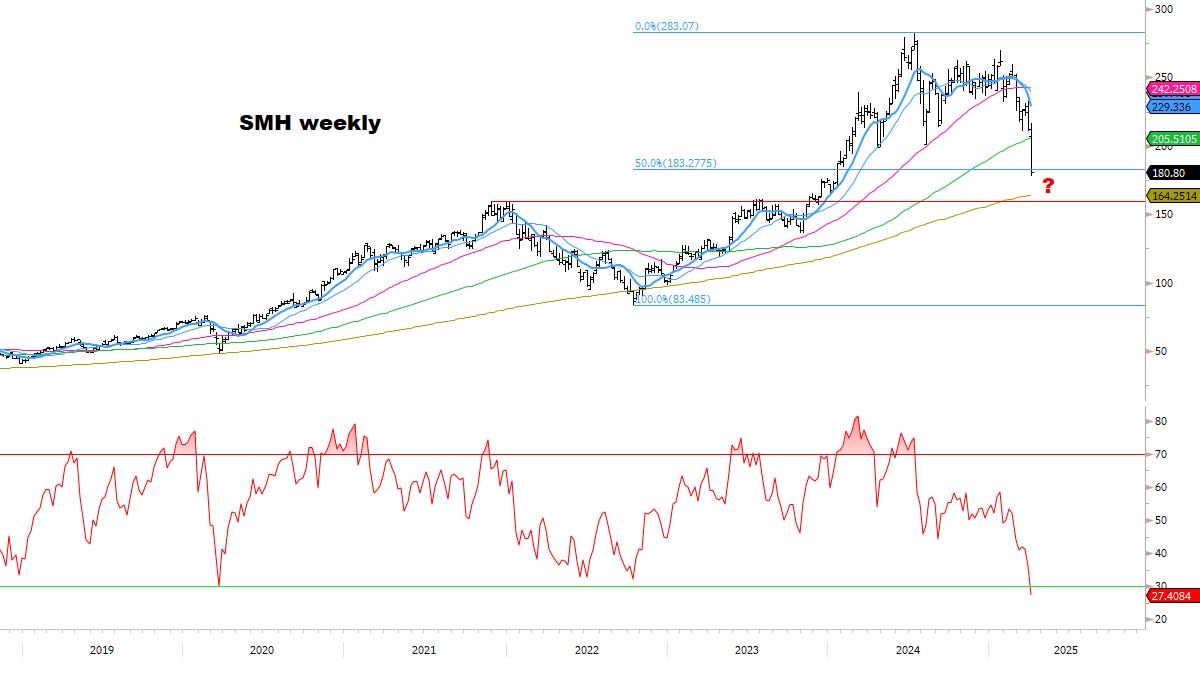
Tech & Semis more oversold than 2020:
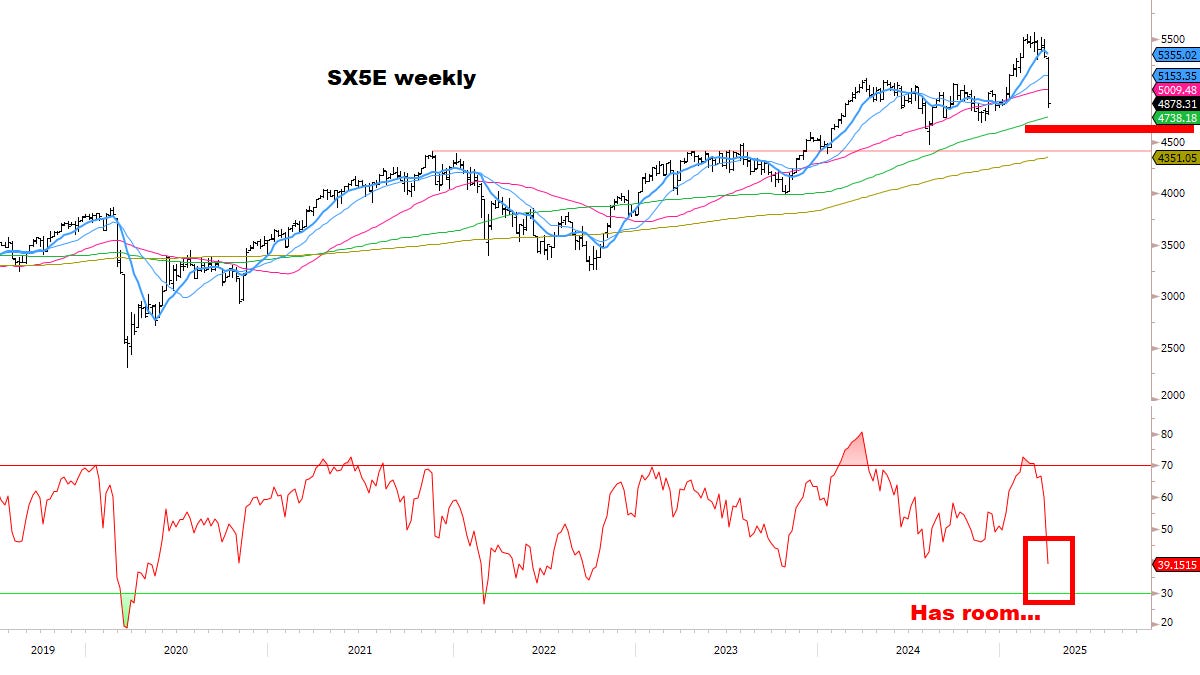
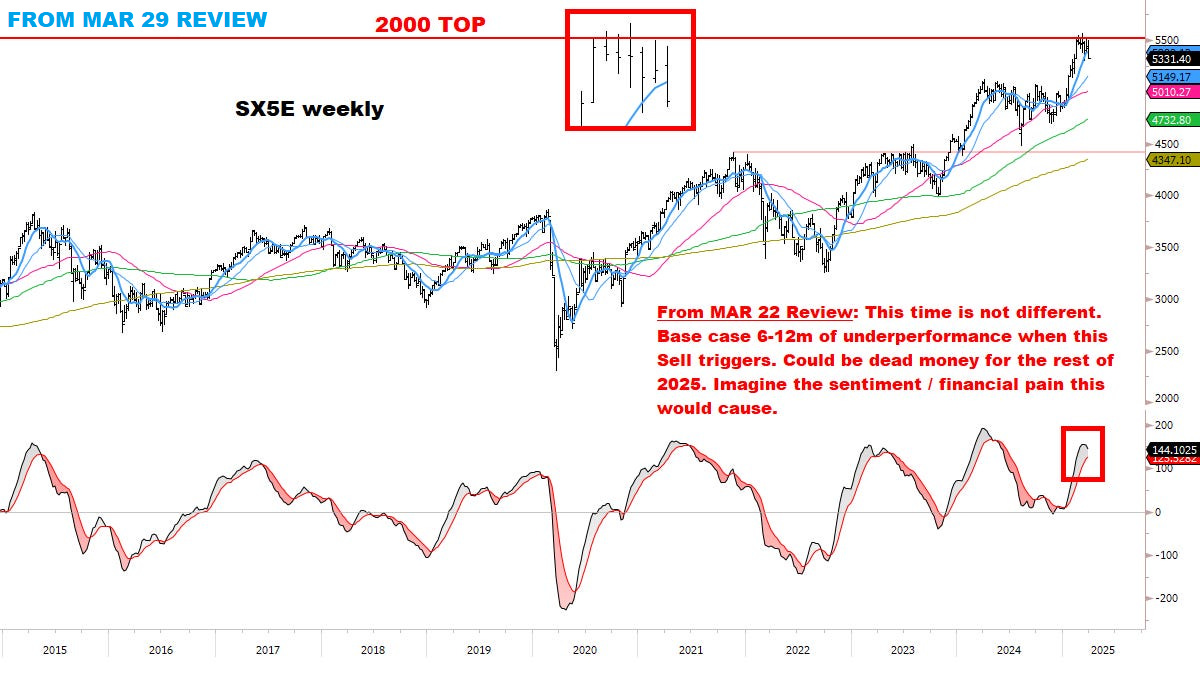
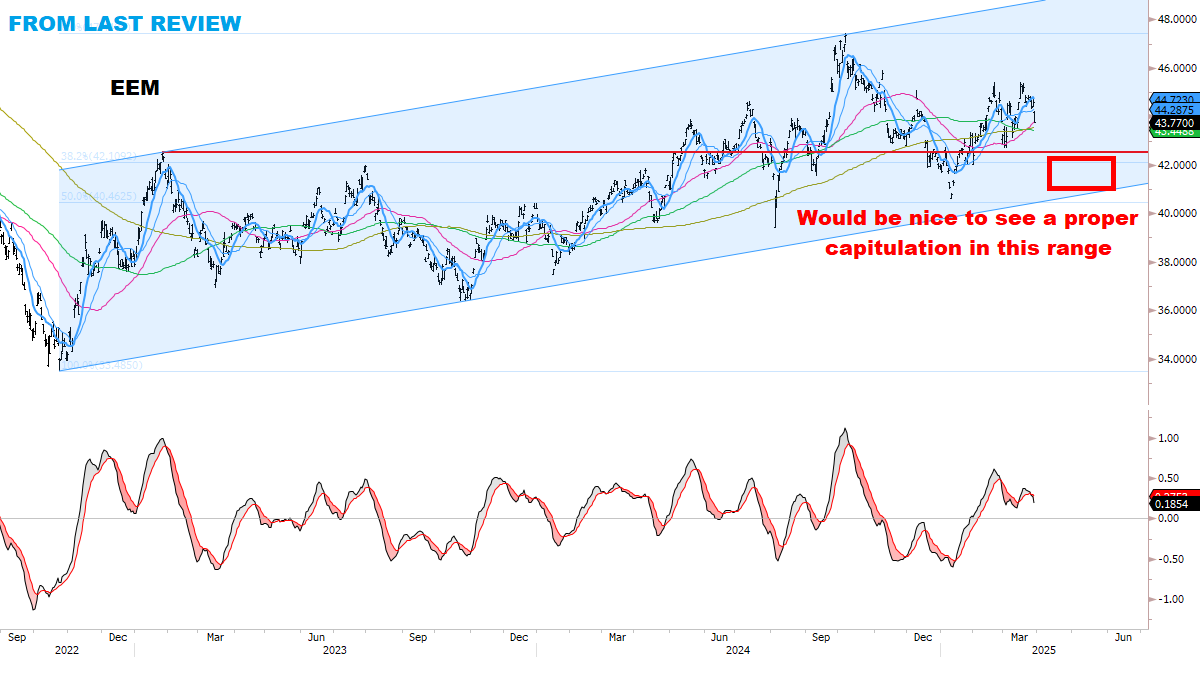
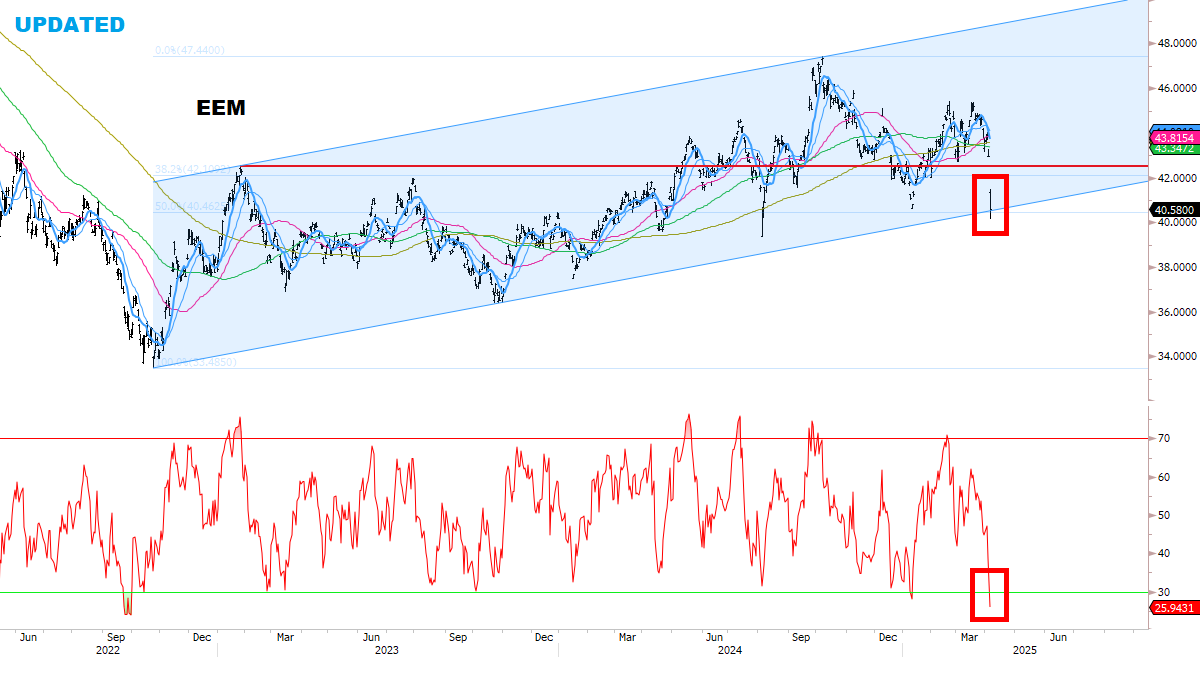
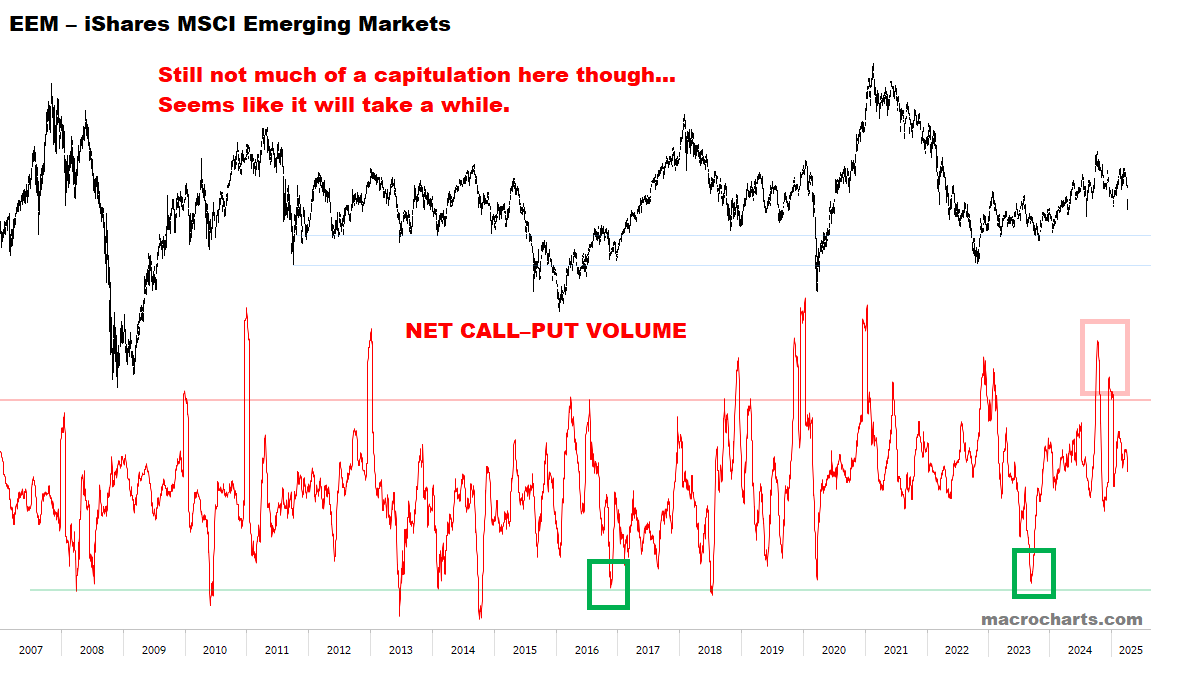
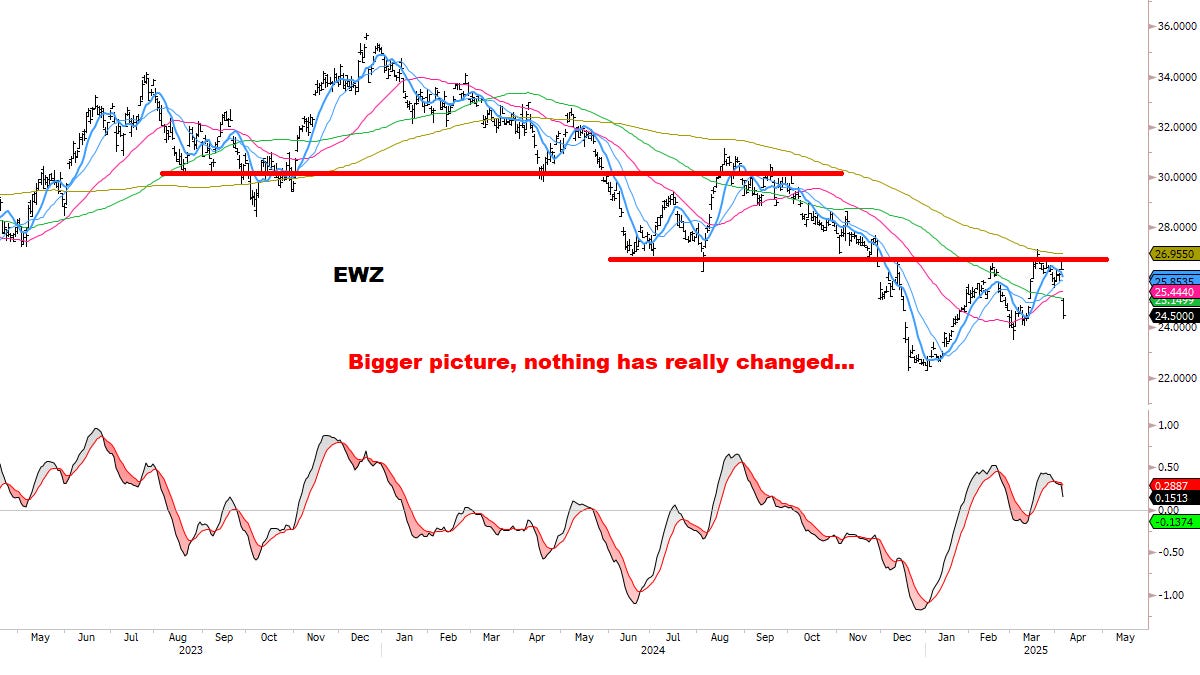
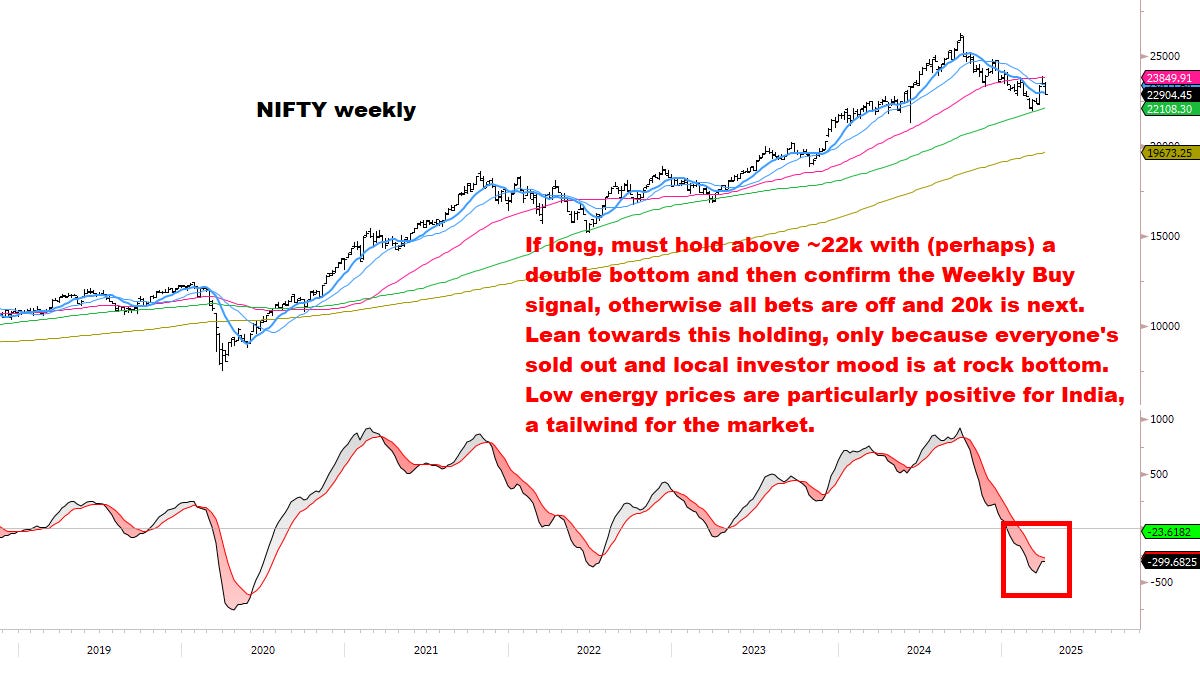
INTERNATIONAL MARKETS
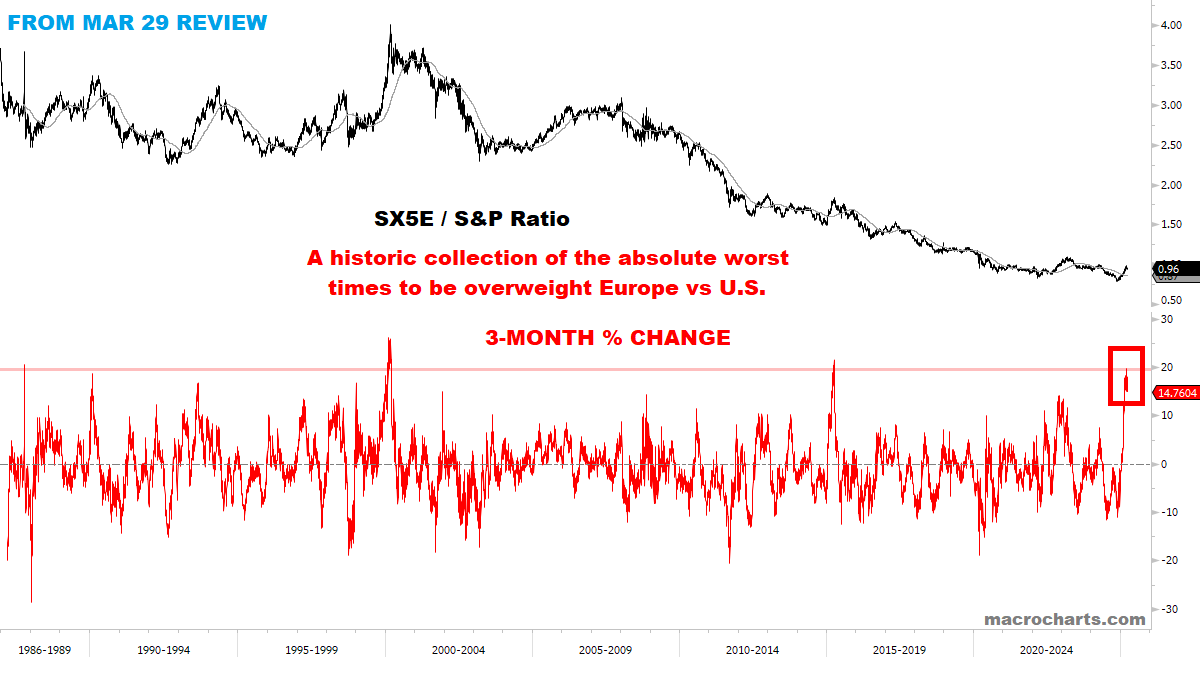
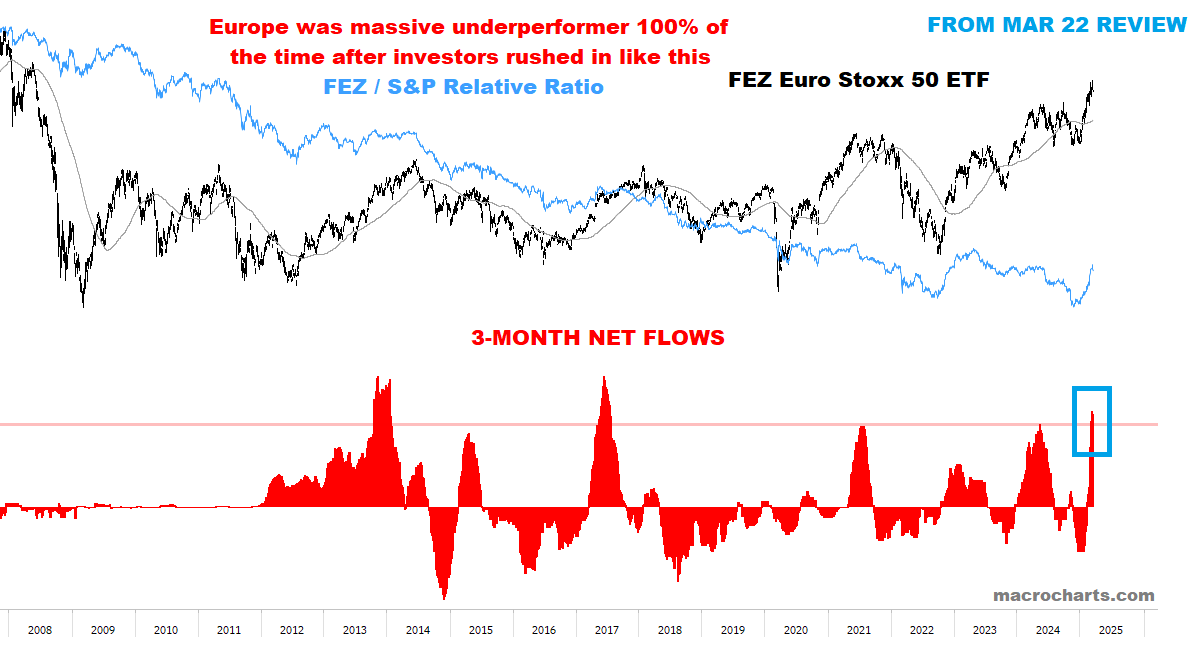
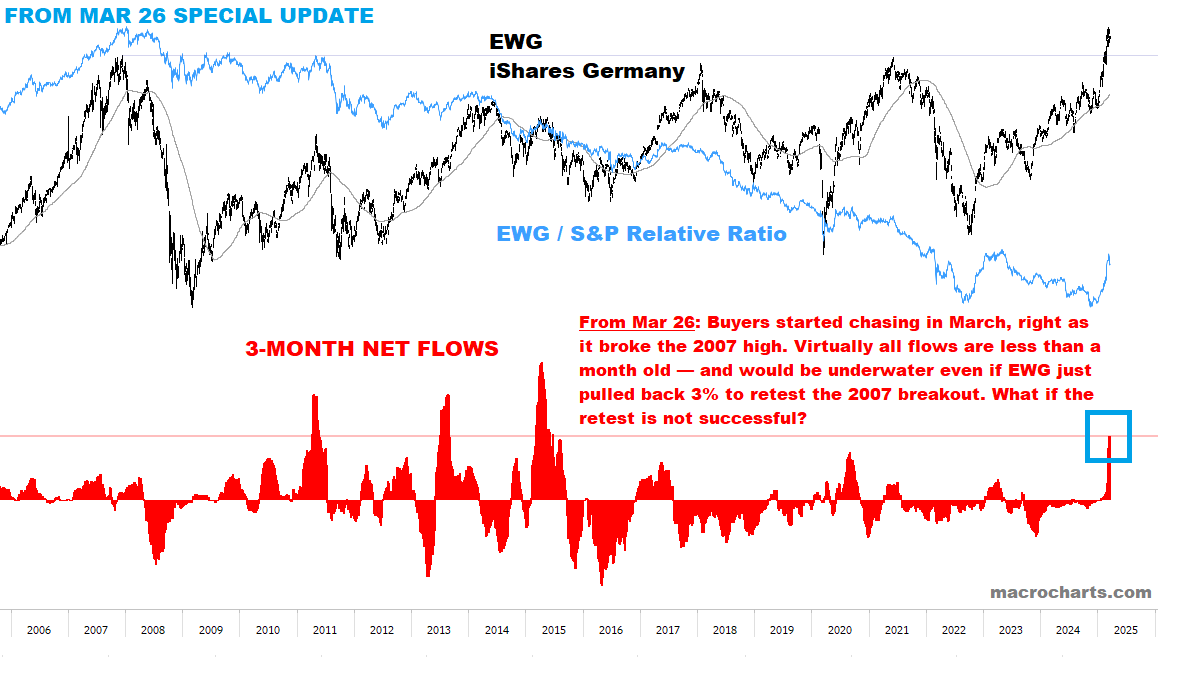
Everyone went all-in Europe during a global trade war.
-14.50% from peak in SX5E Futures vs -17.50% S&P… diversification.
*Bigger picture: EU underperformance may just be getting started (especially if the world is moving into a recession — see Currencies section).
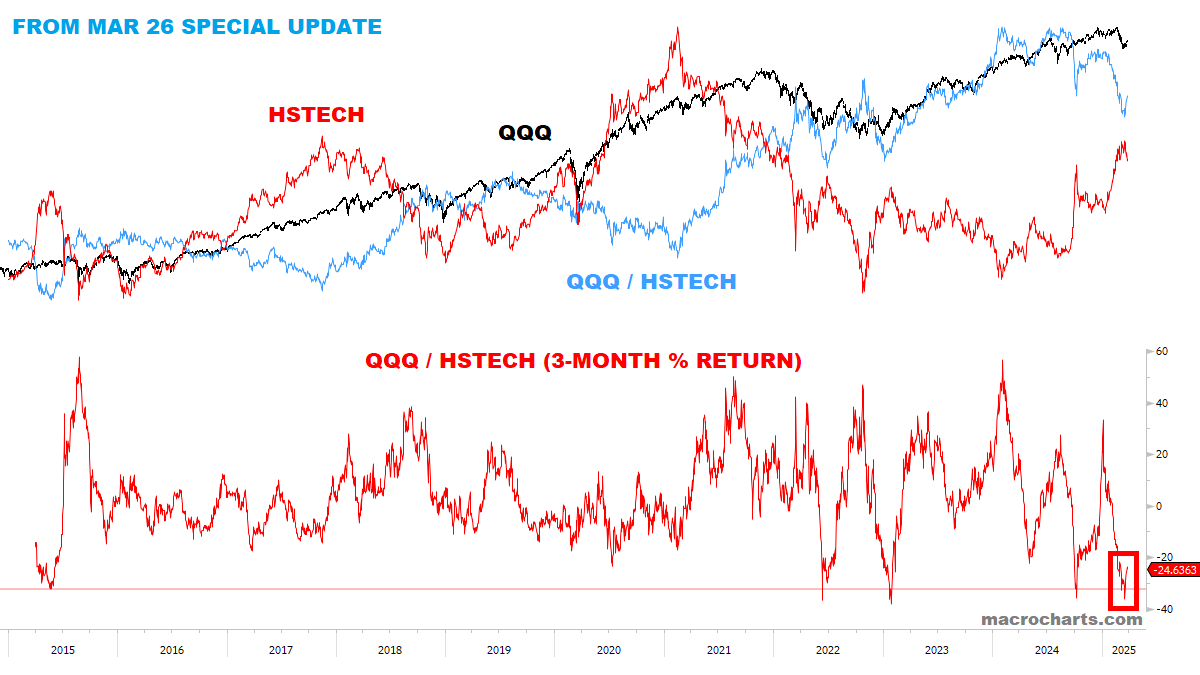
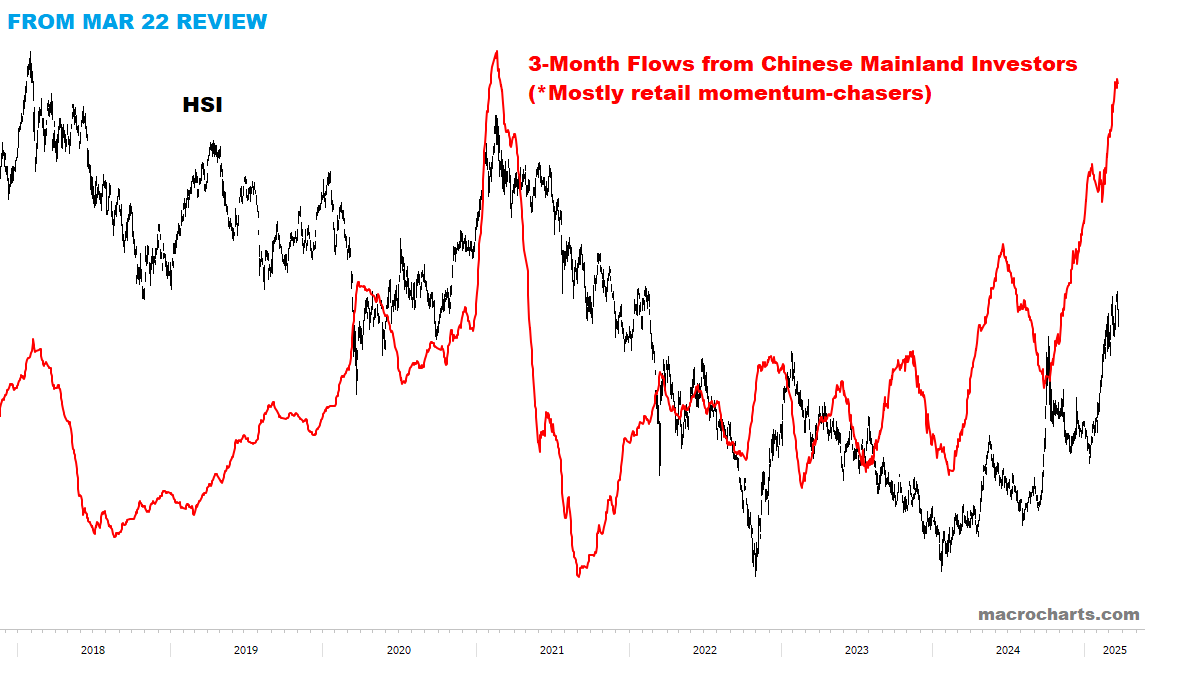
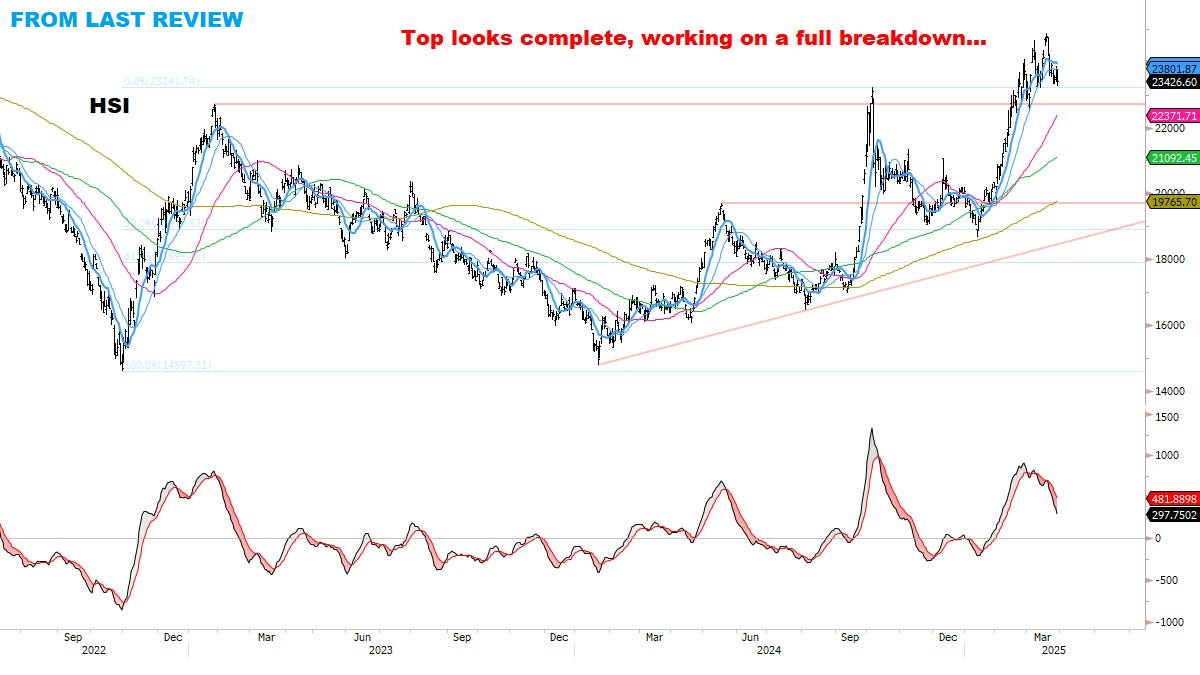
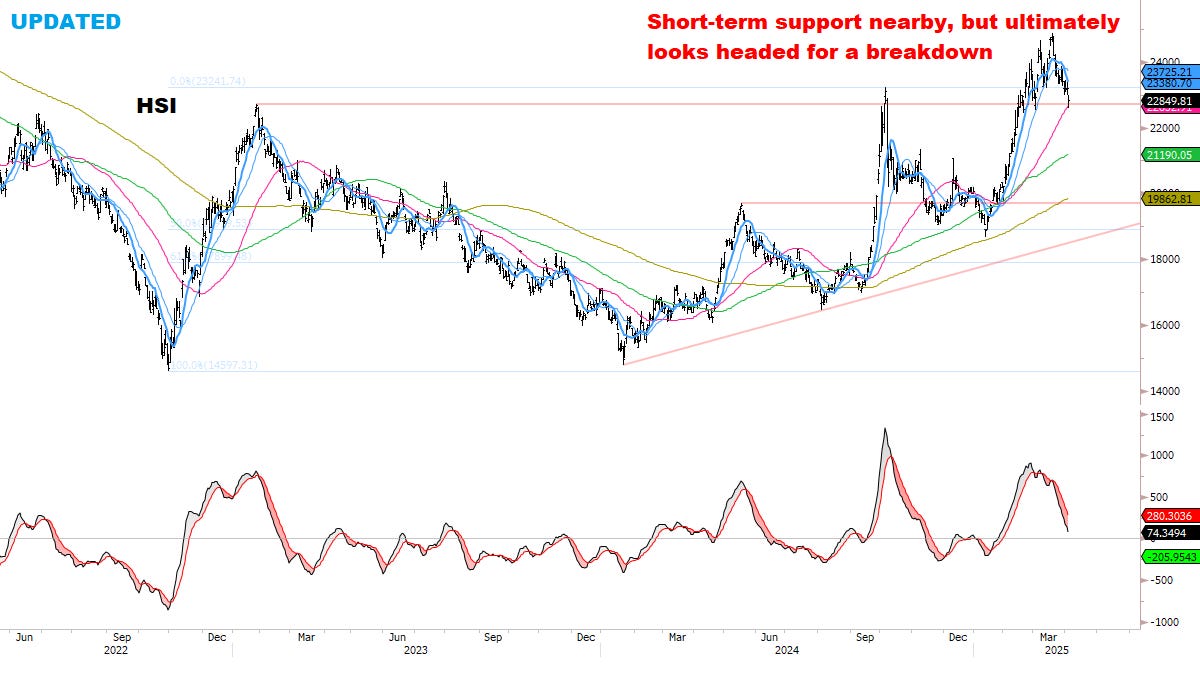
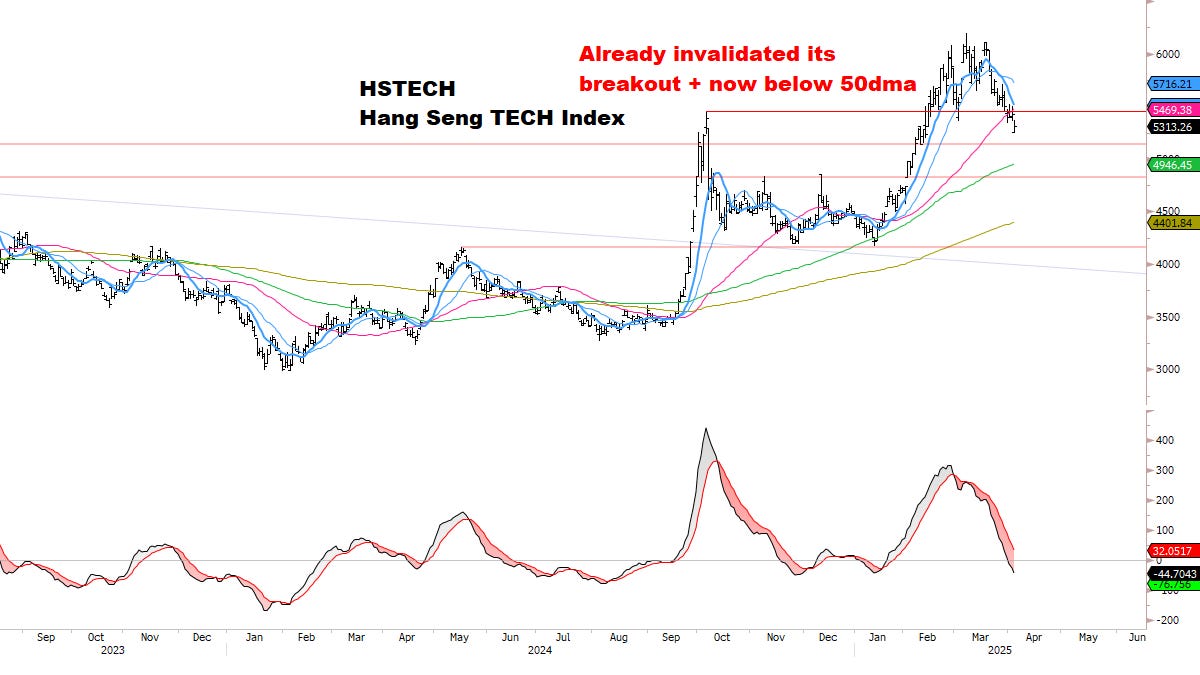
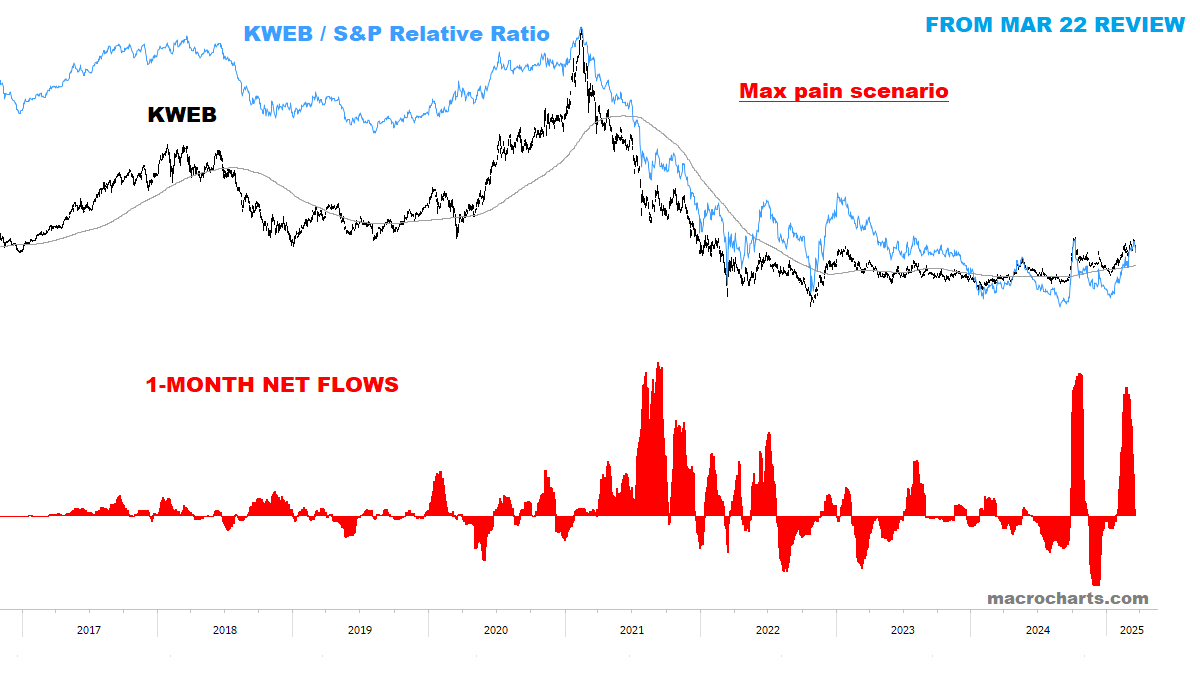
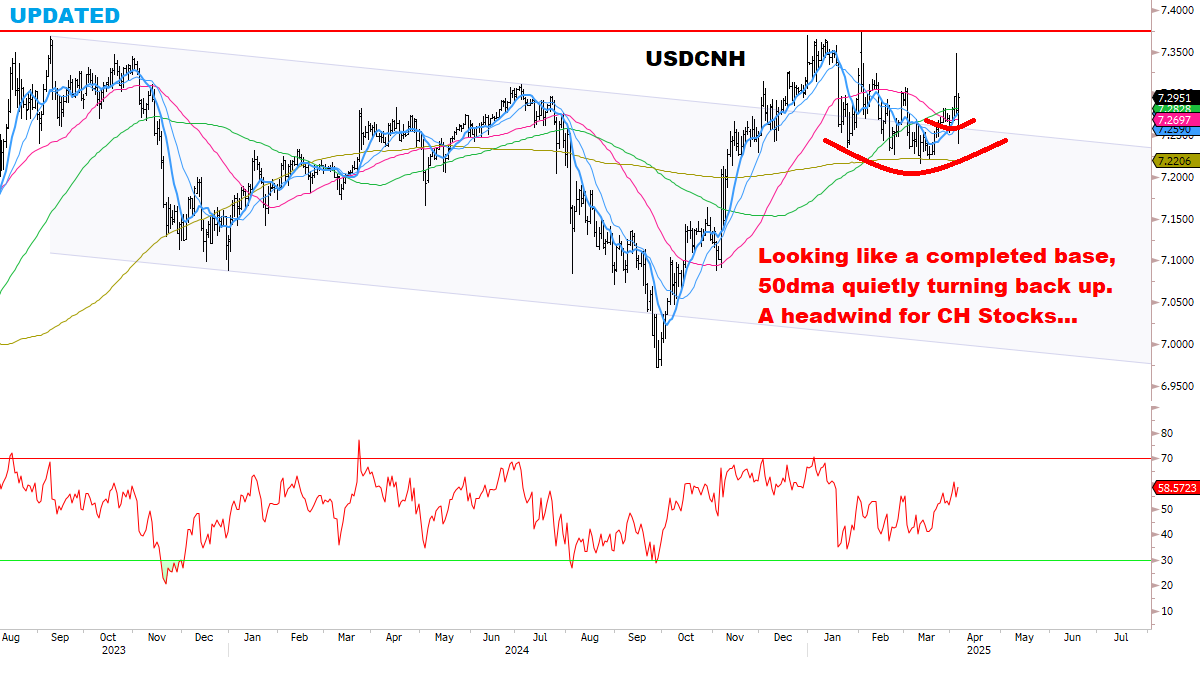
CHINA
Maybe not the best place to be overweight in a global trade war either. Maintaining zero exposure / negative trend risk.
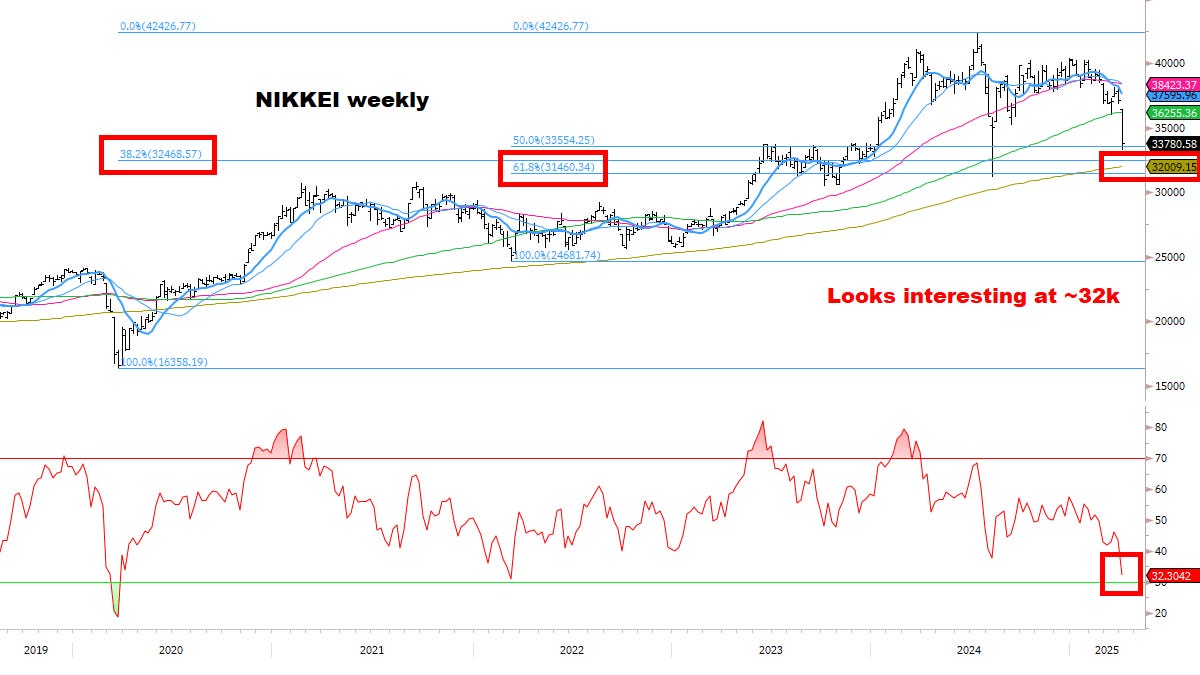
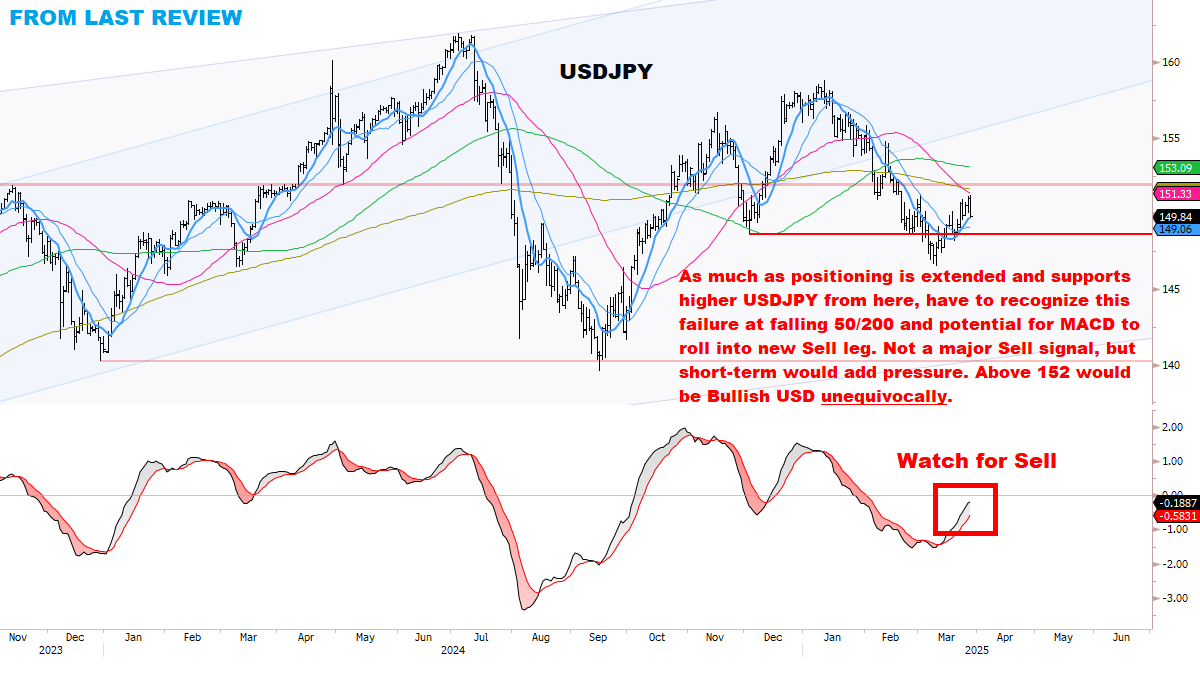
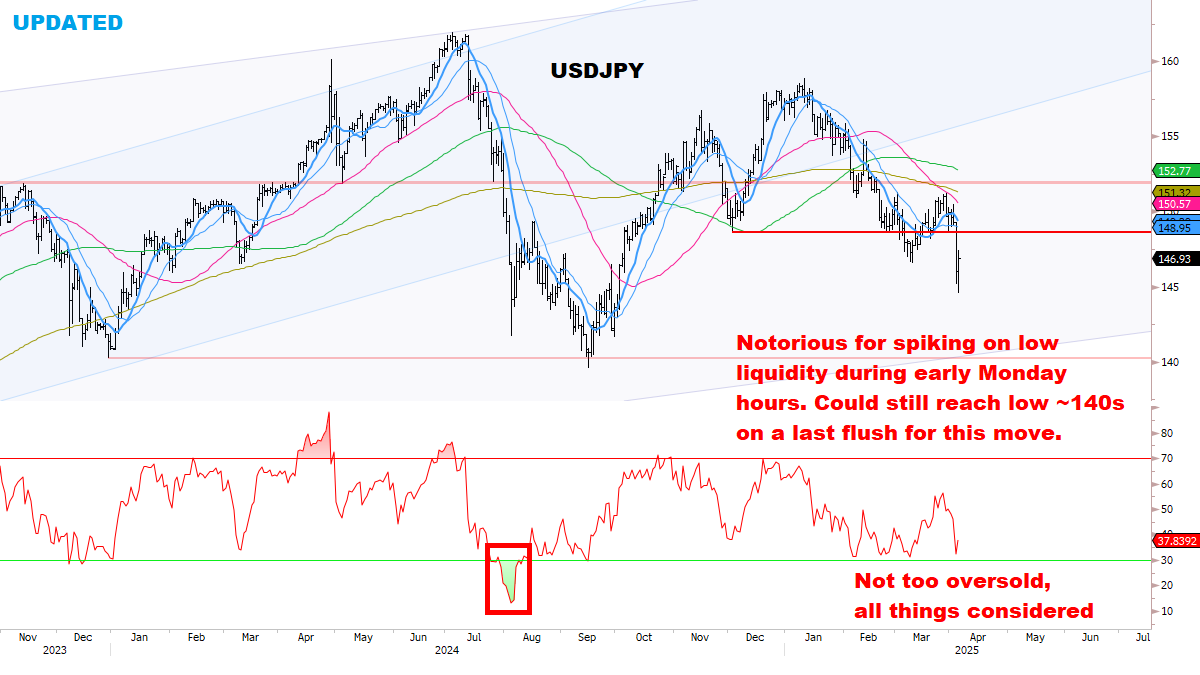
JAPAN
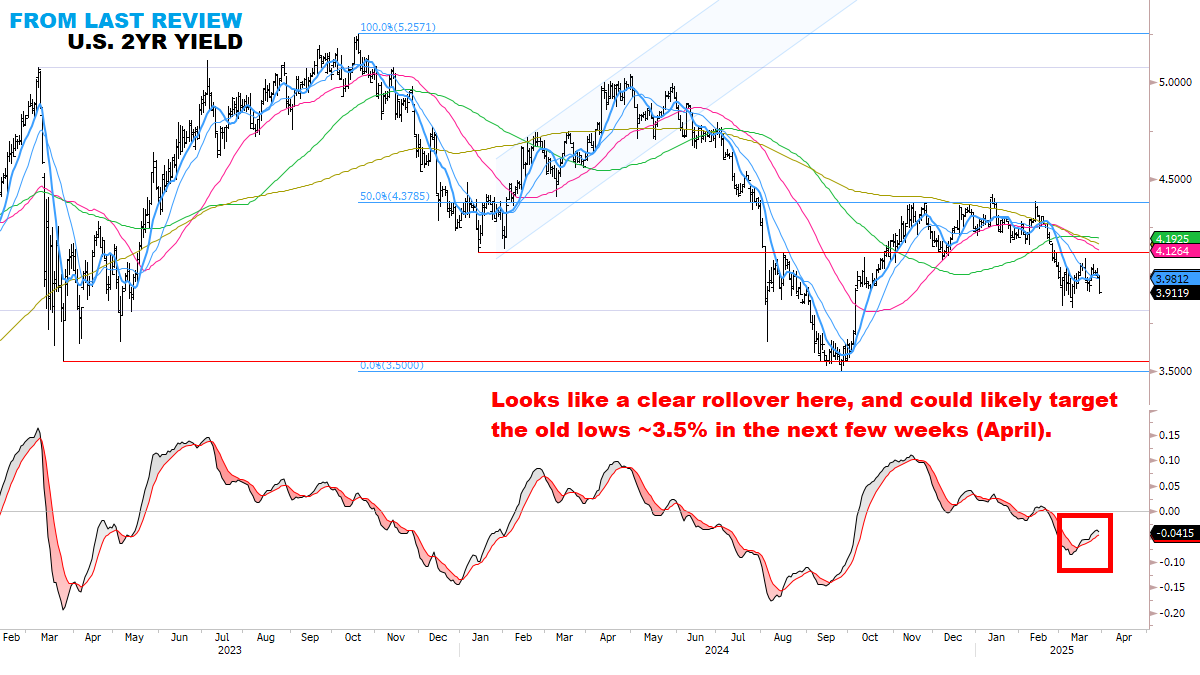
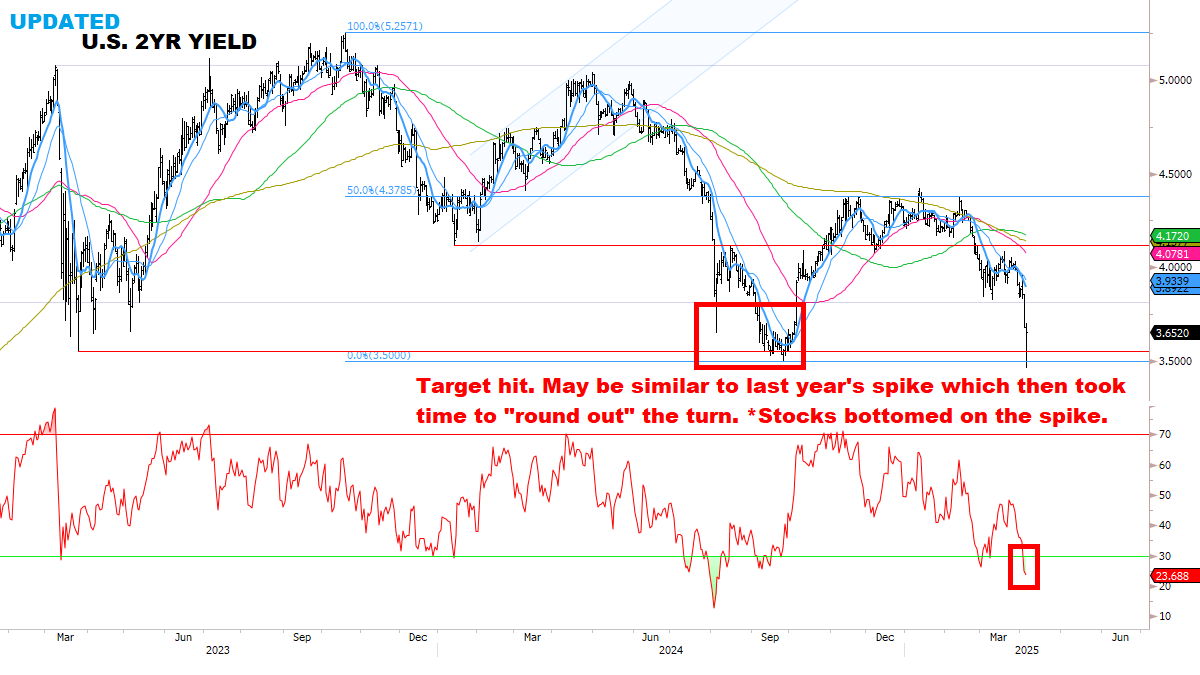
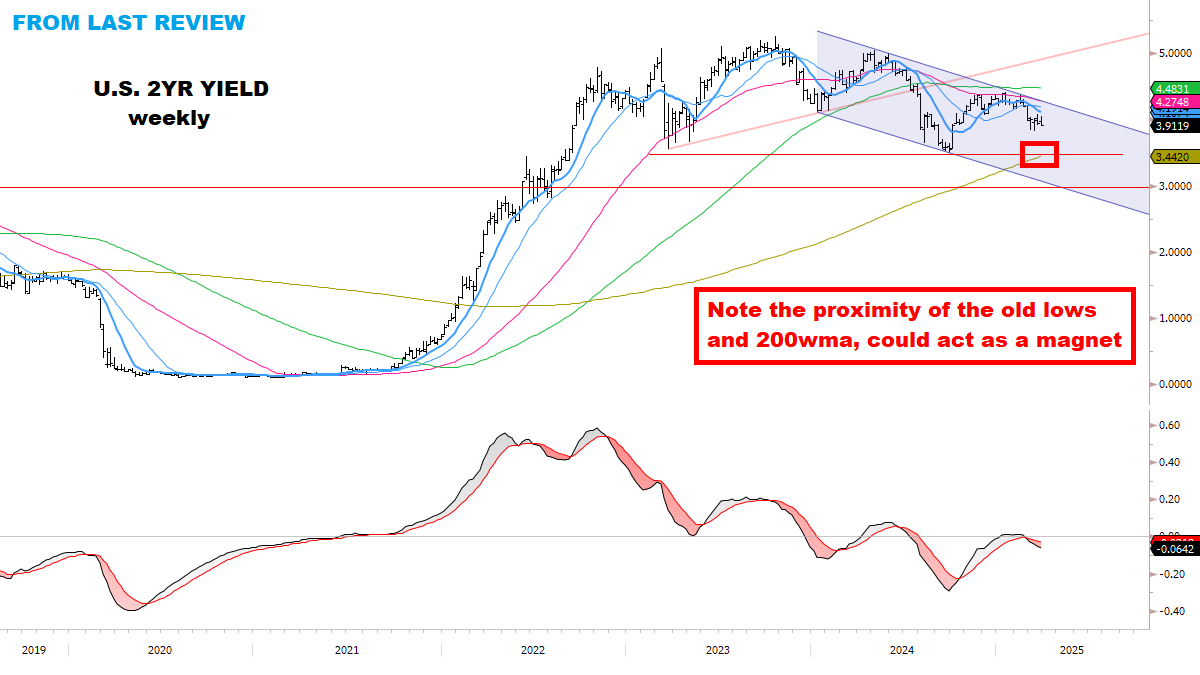
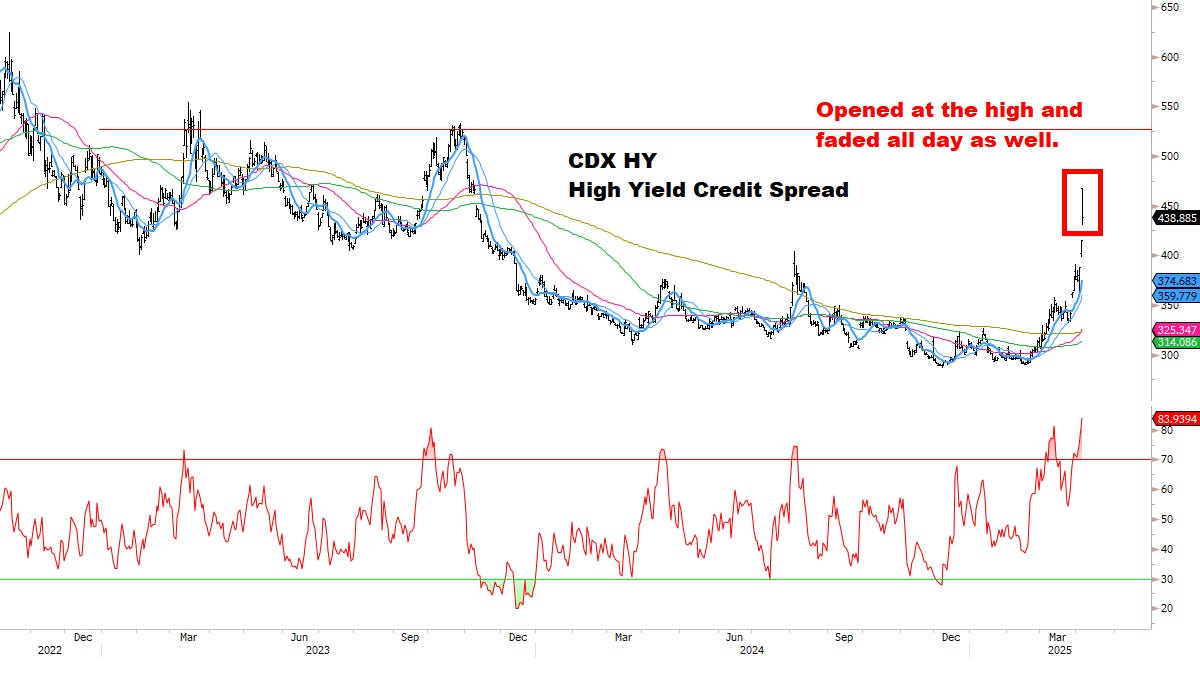
RATES
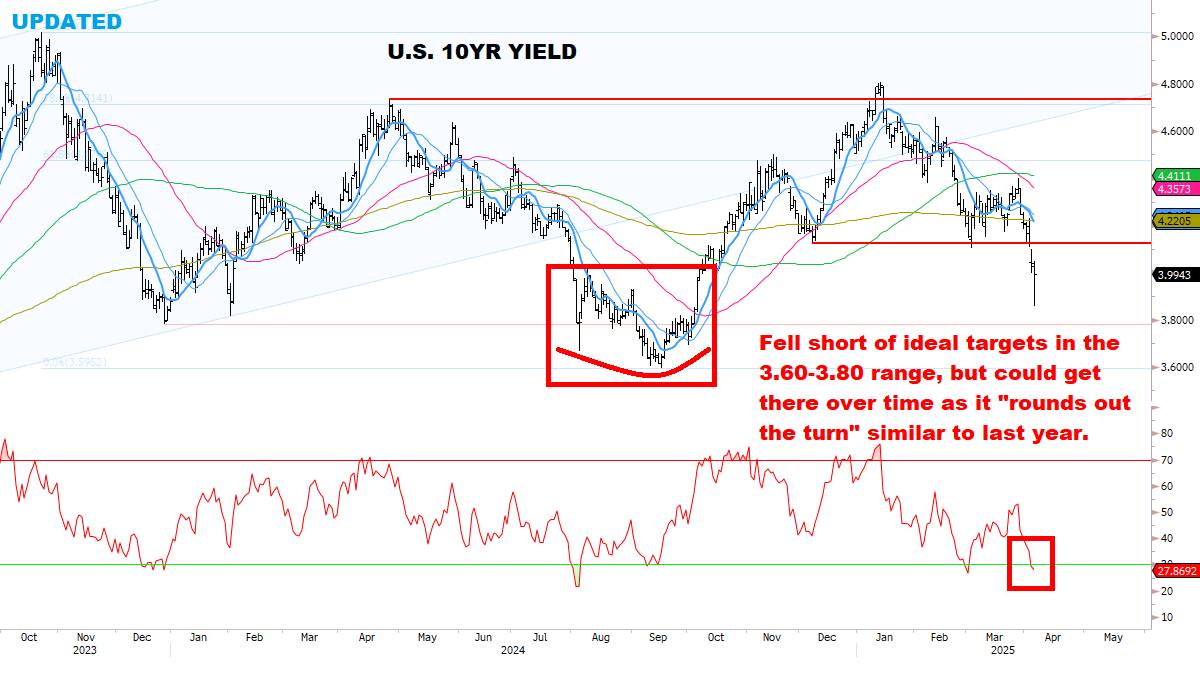
Bonds “stopped working” on Friday — that’s when real liquidation sets in. Recall back in March 2020, Bonds peaked on March 9, two weeks before Stocks bottomed. Gold peaked with Bonds on that same day. (It may be a shorter lag to the bottom in Stocks this time, we’ll see.)
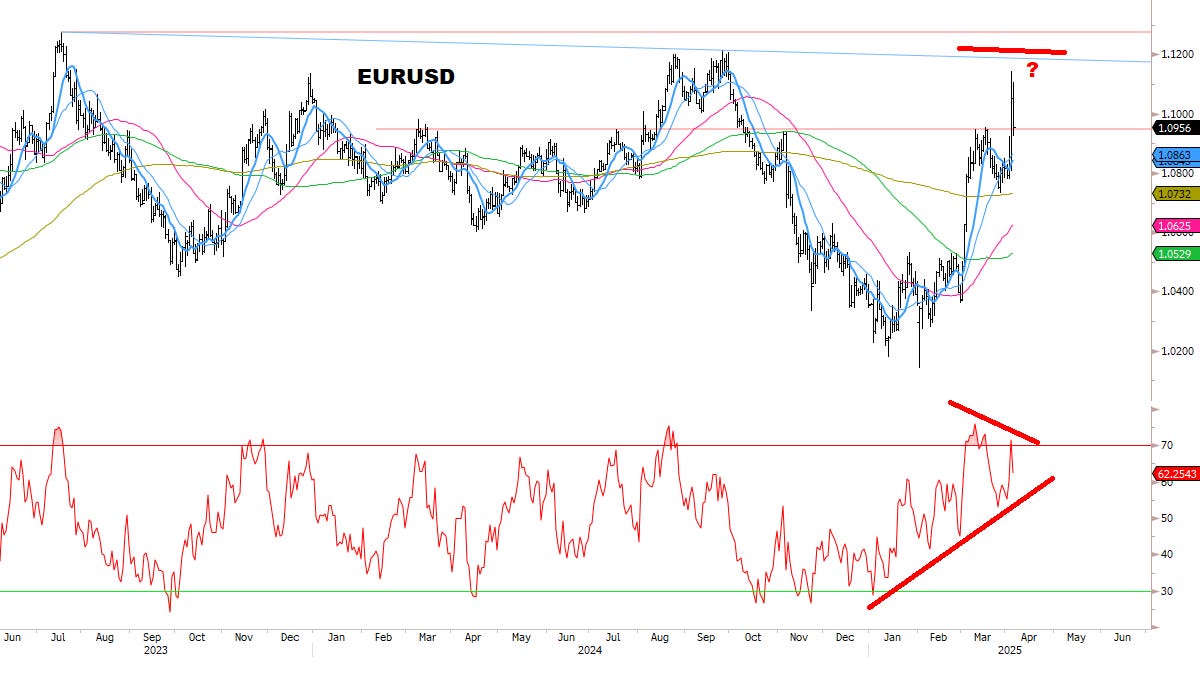
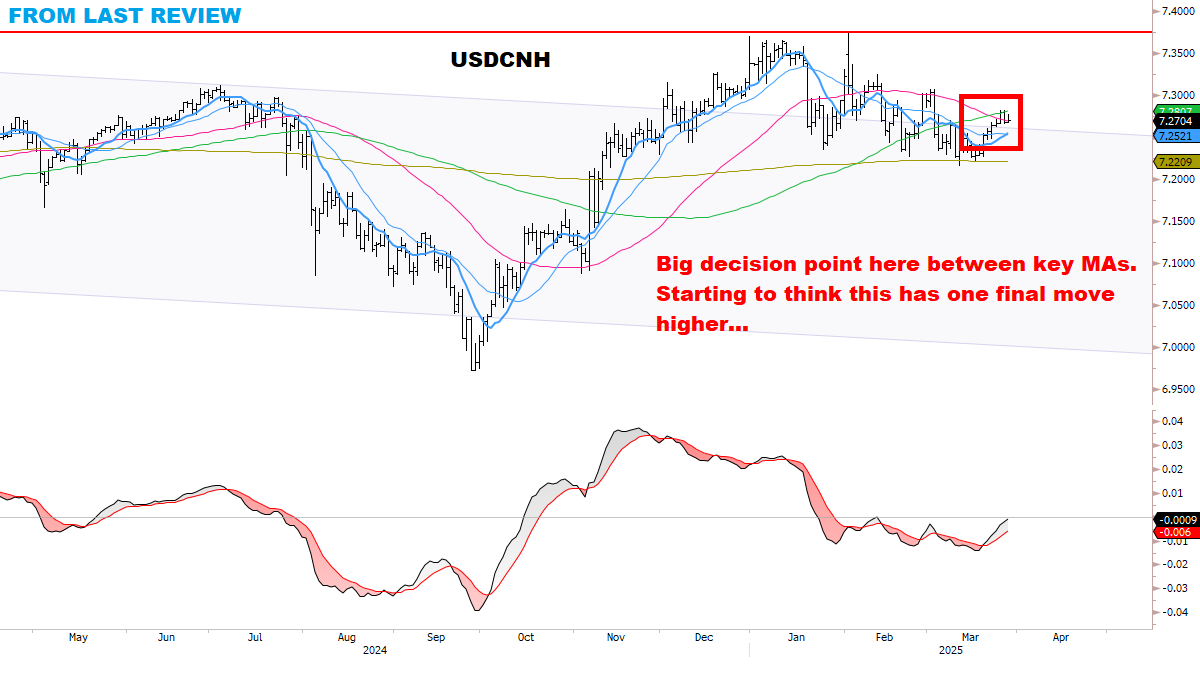
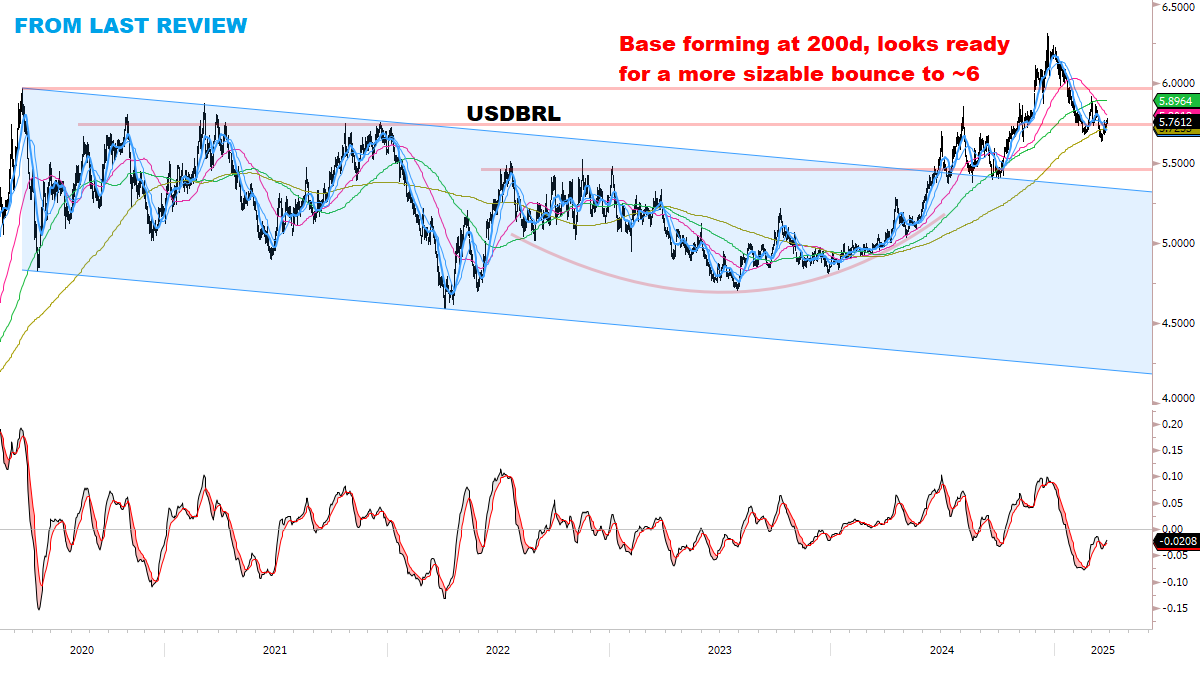
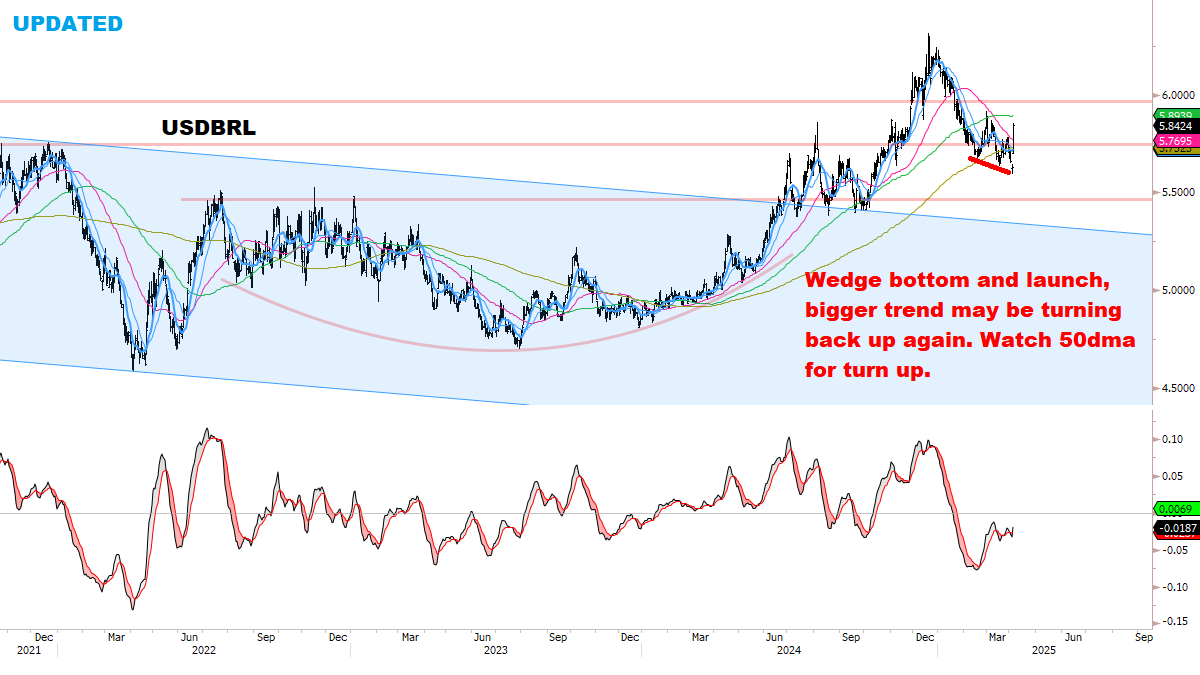
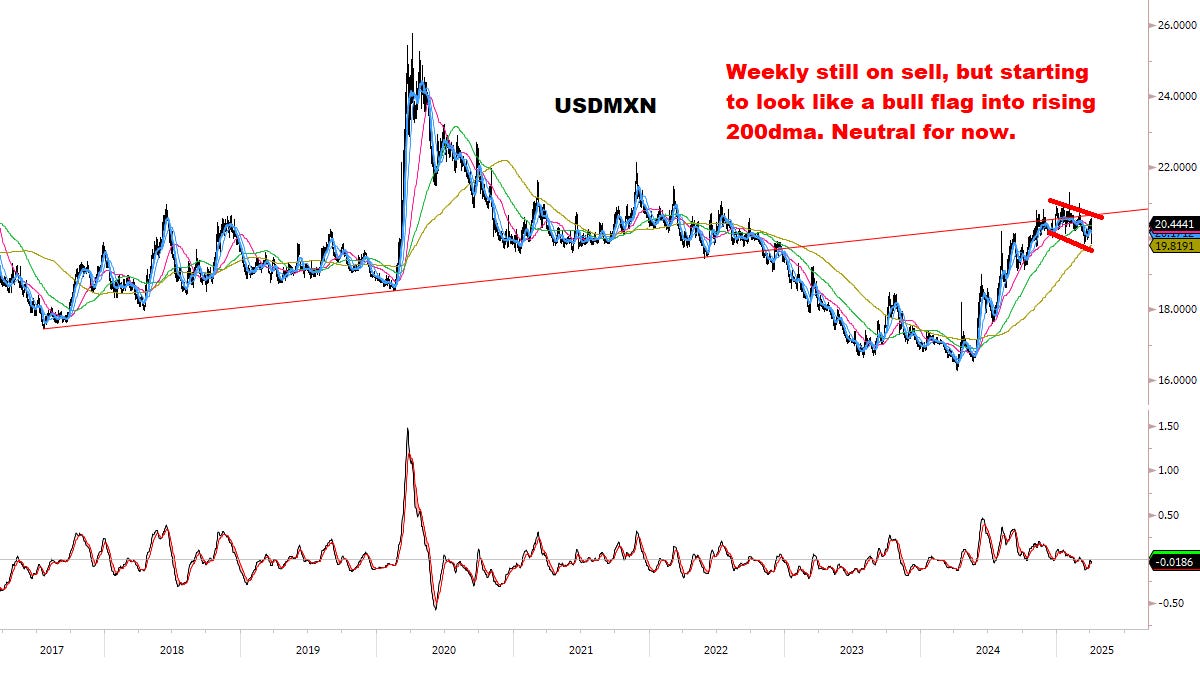
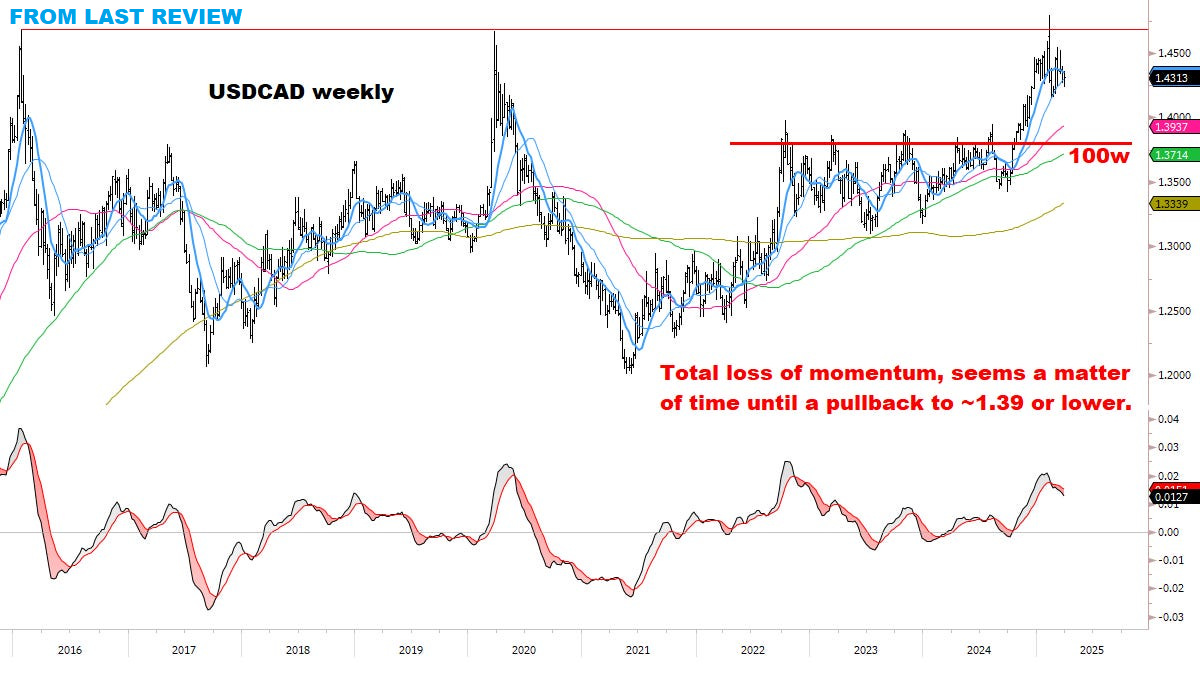
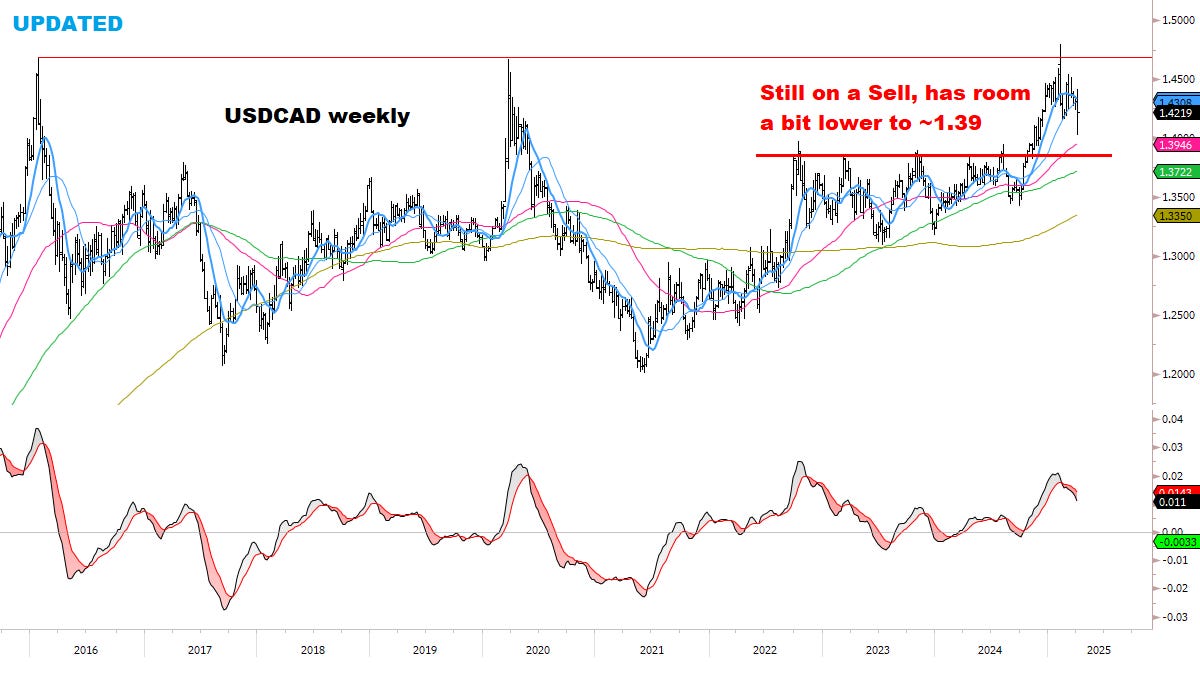
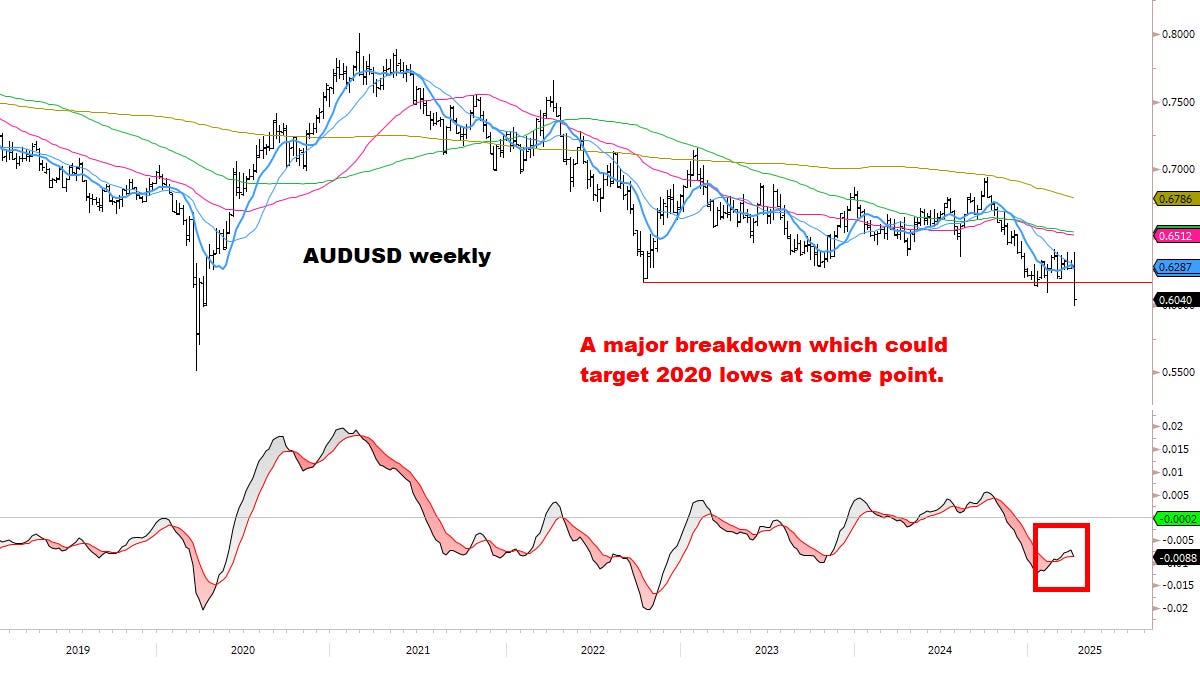
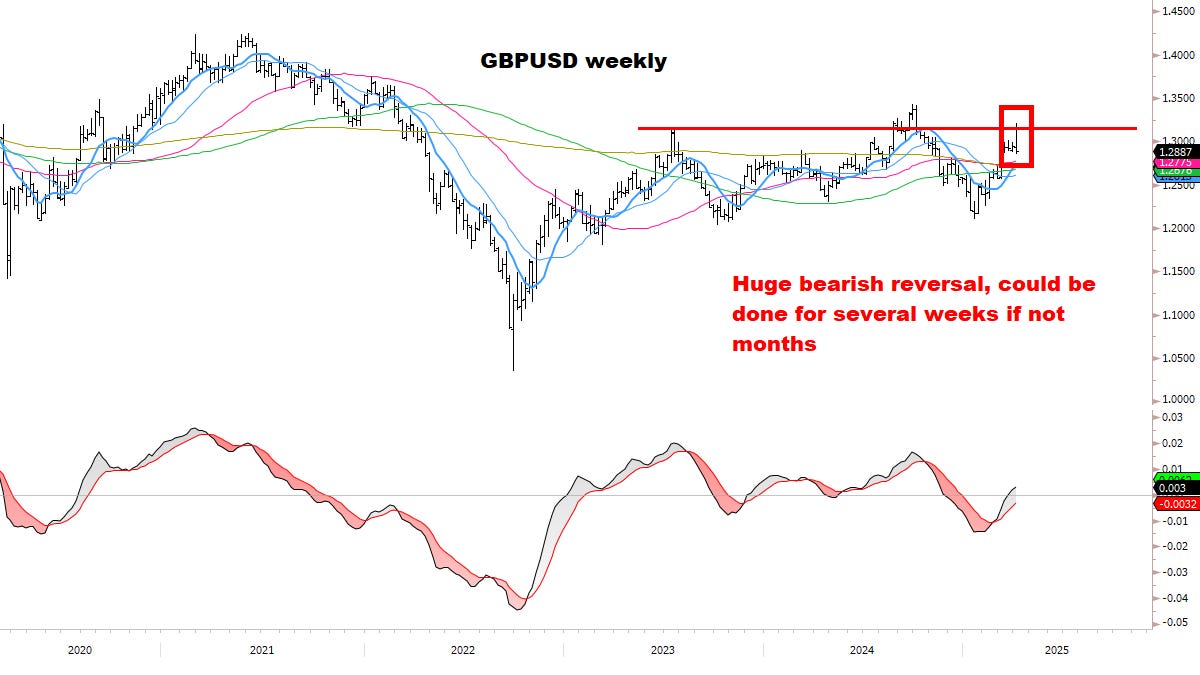
CURRENCIES
The “dollar smile” was first described 20 years ago by Stephen Jen and refers to when the U.S. Dollar outperforms other currencies in two extremely different scenarios:
When the US economy is strong and there is optimism in markets.
When the global economy is doing badly and risk appetites are low (a ‘risk-off’ environment).
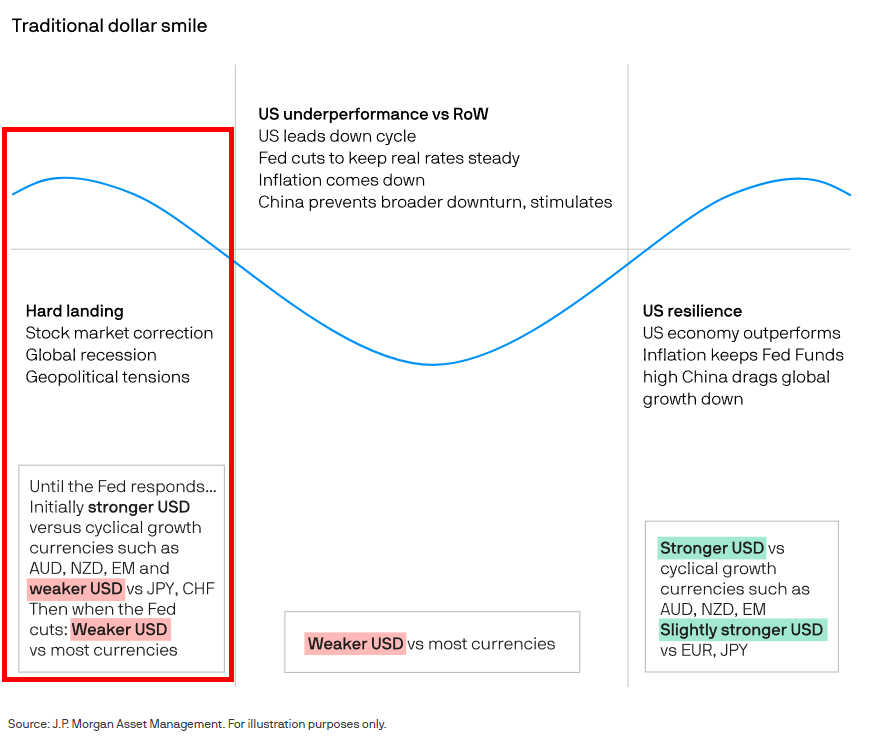
Above, the left-side scenario is likely now driving markets, evidenced by Friday’s big reversal up in the Dollar — completely erasing Thursday’s selloff against many currencies.
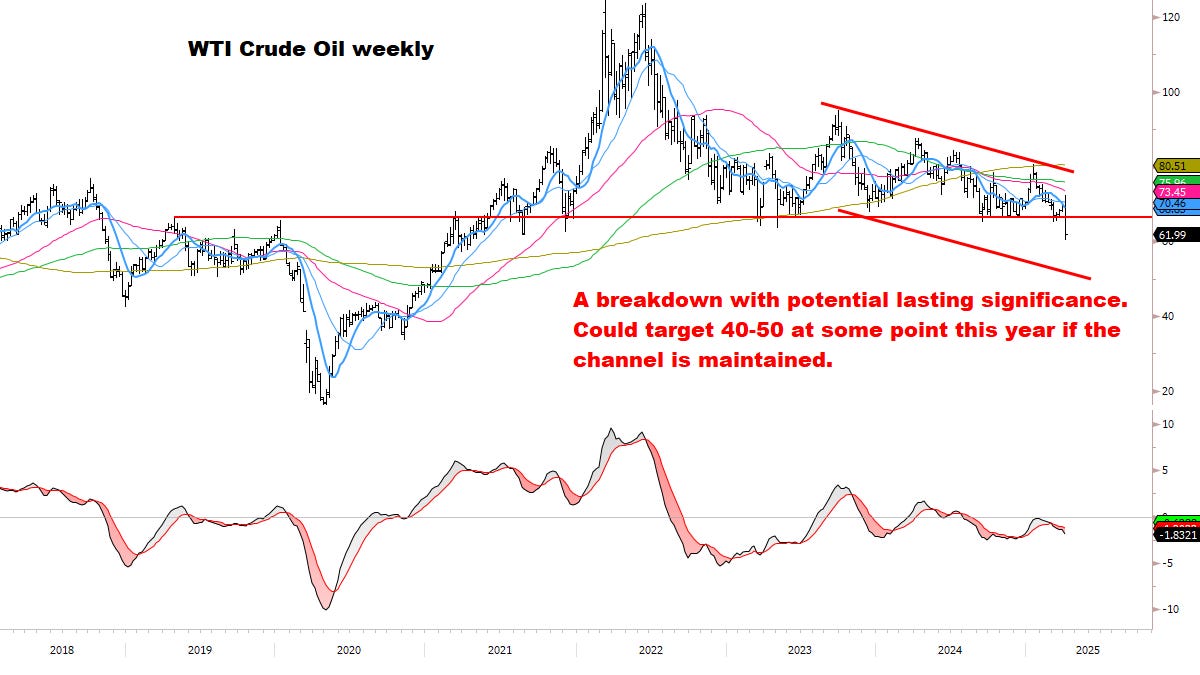
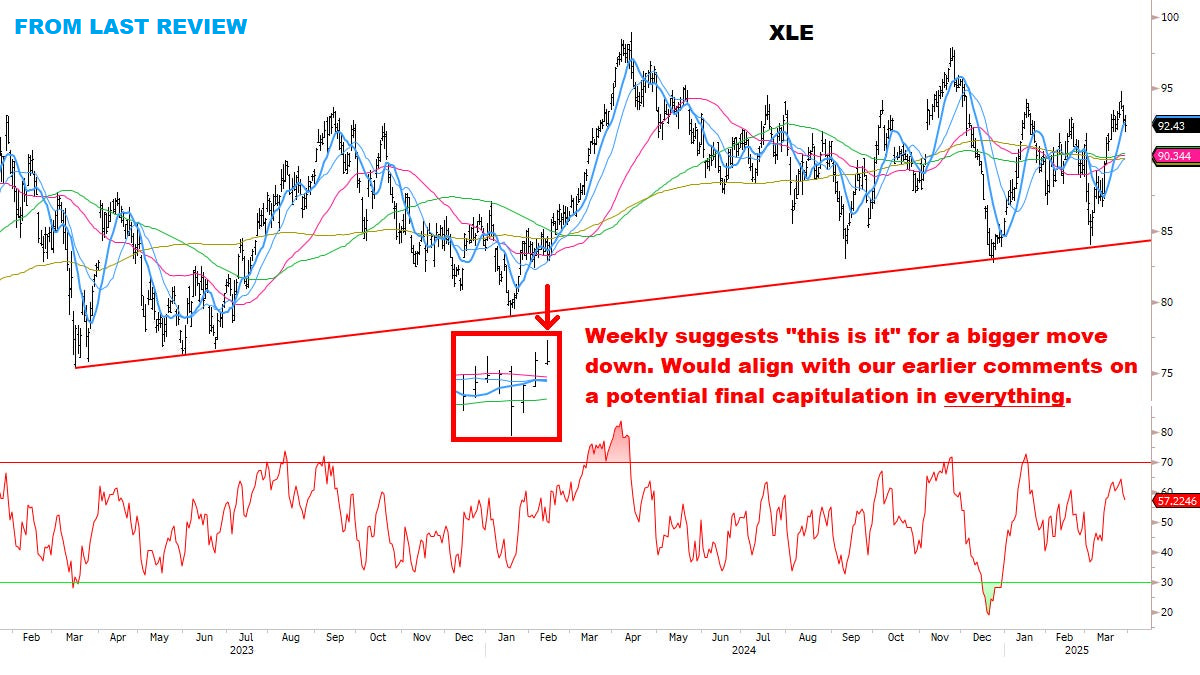
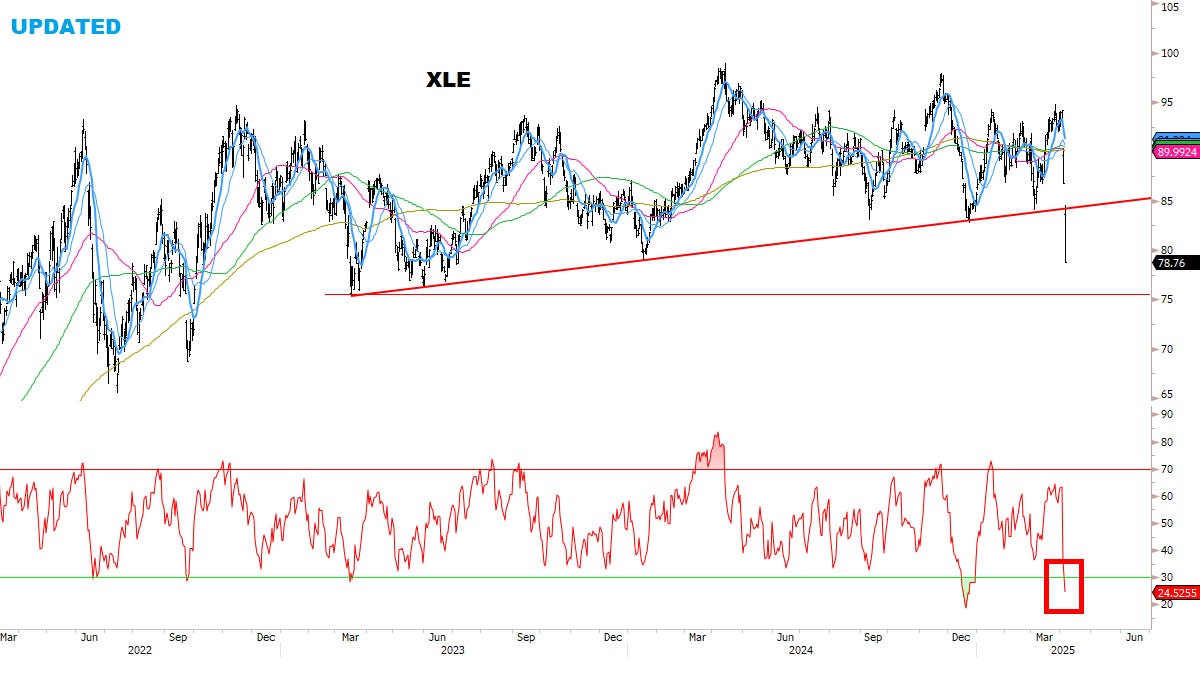
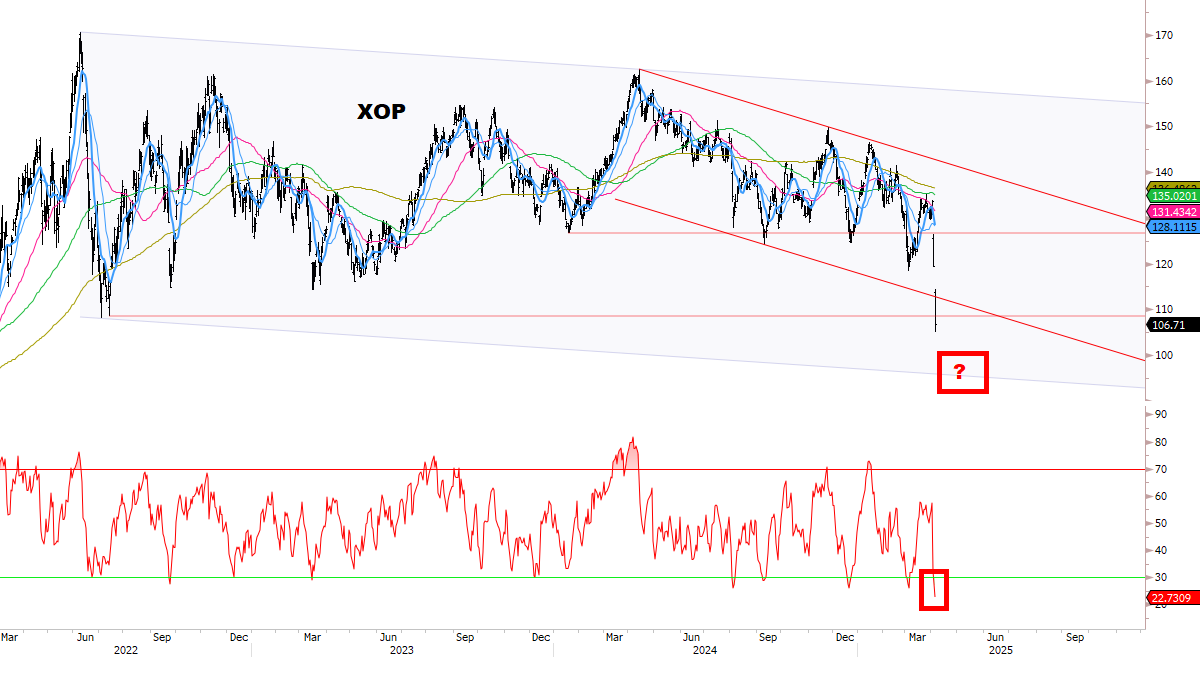
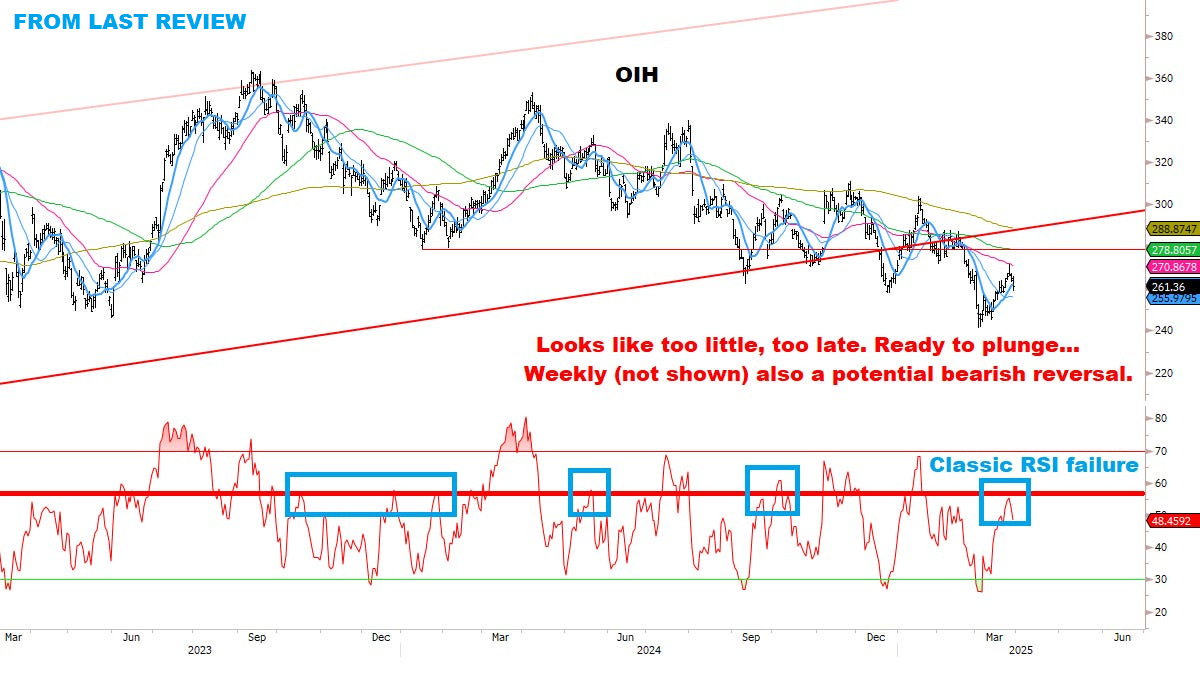
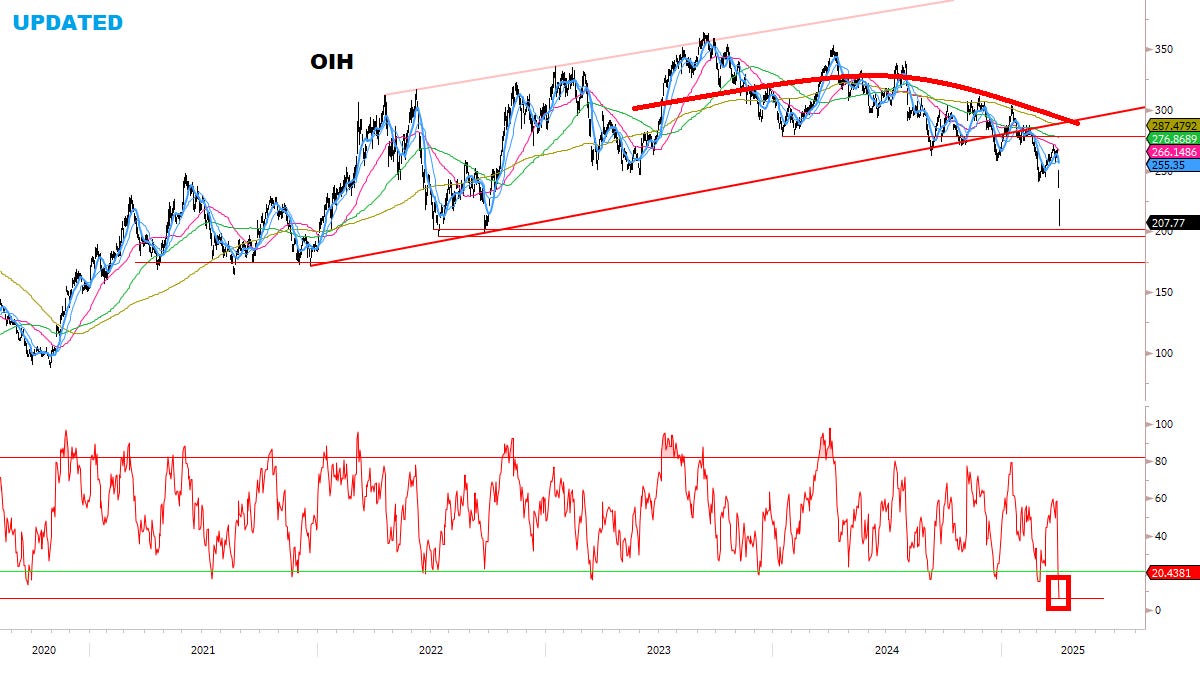
OIL & ENERGY
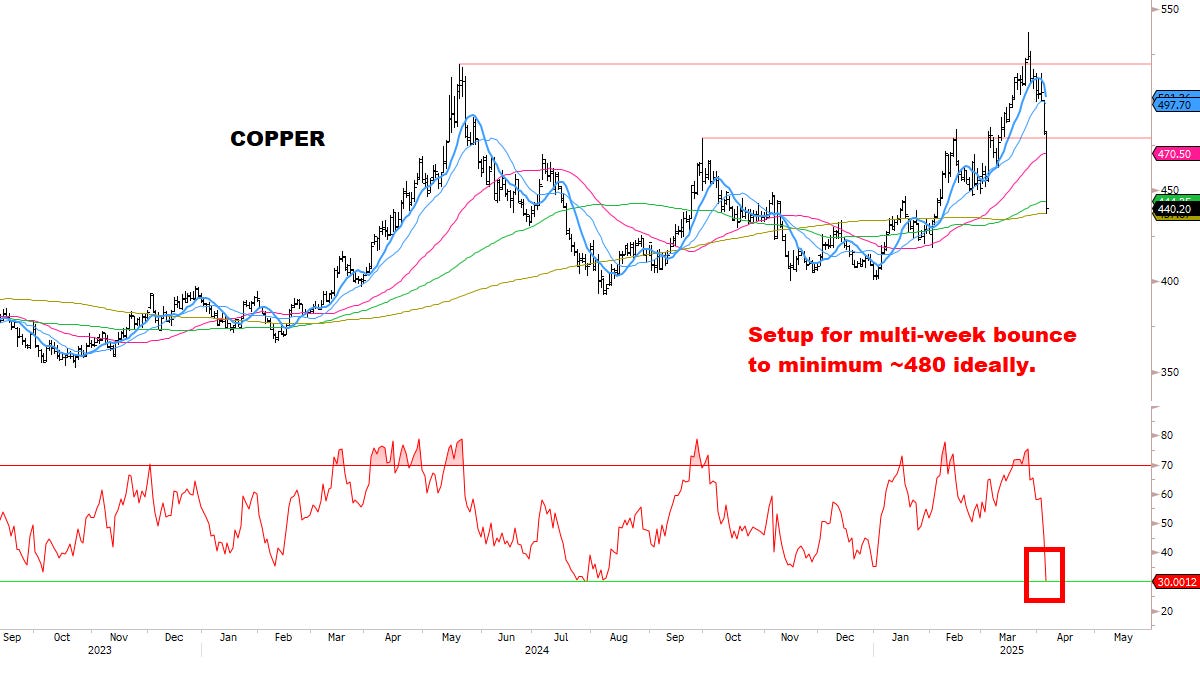
METALS

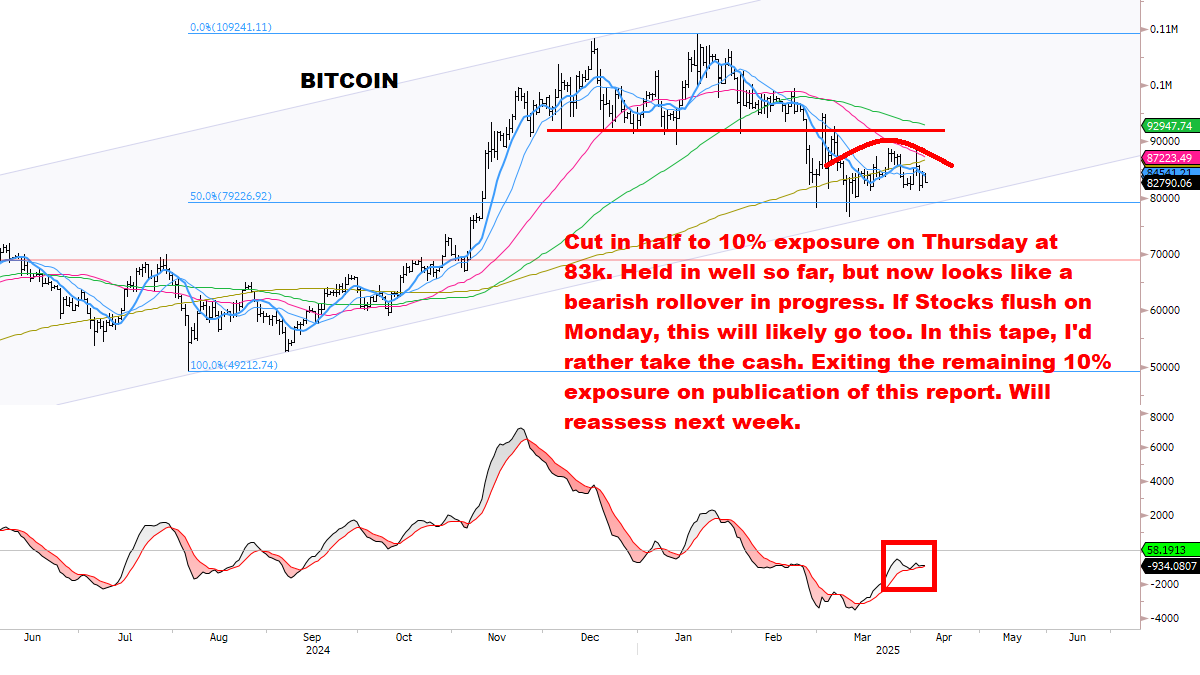
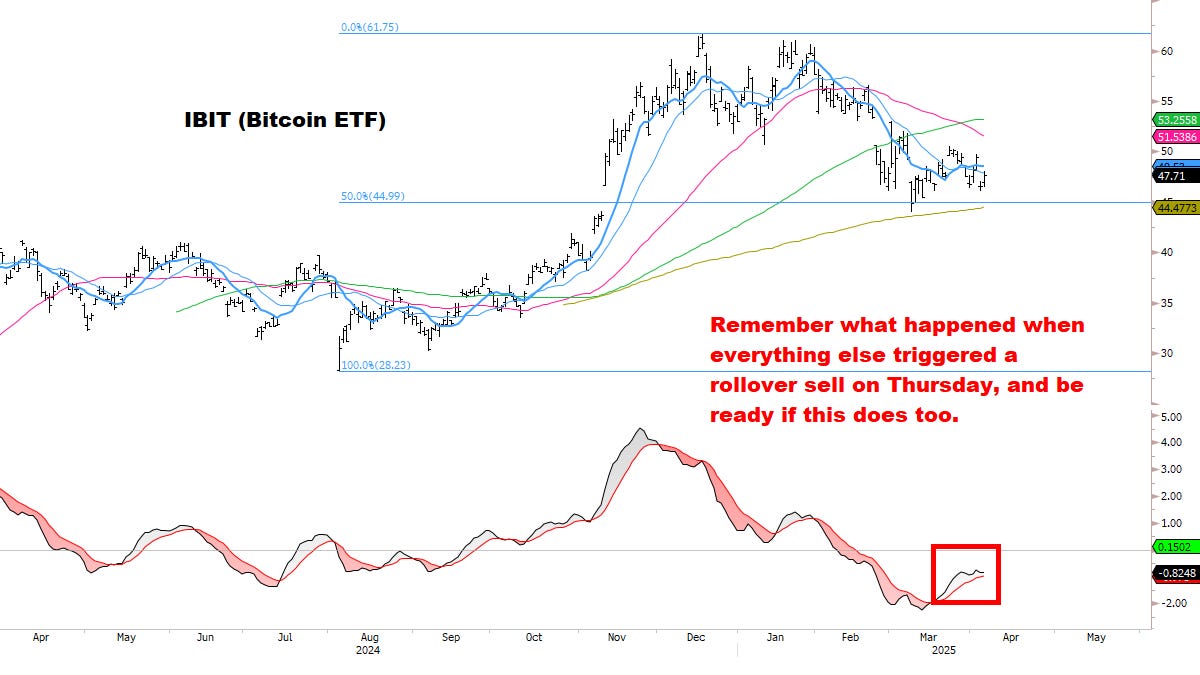
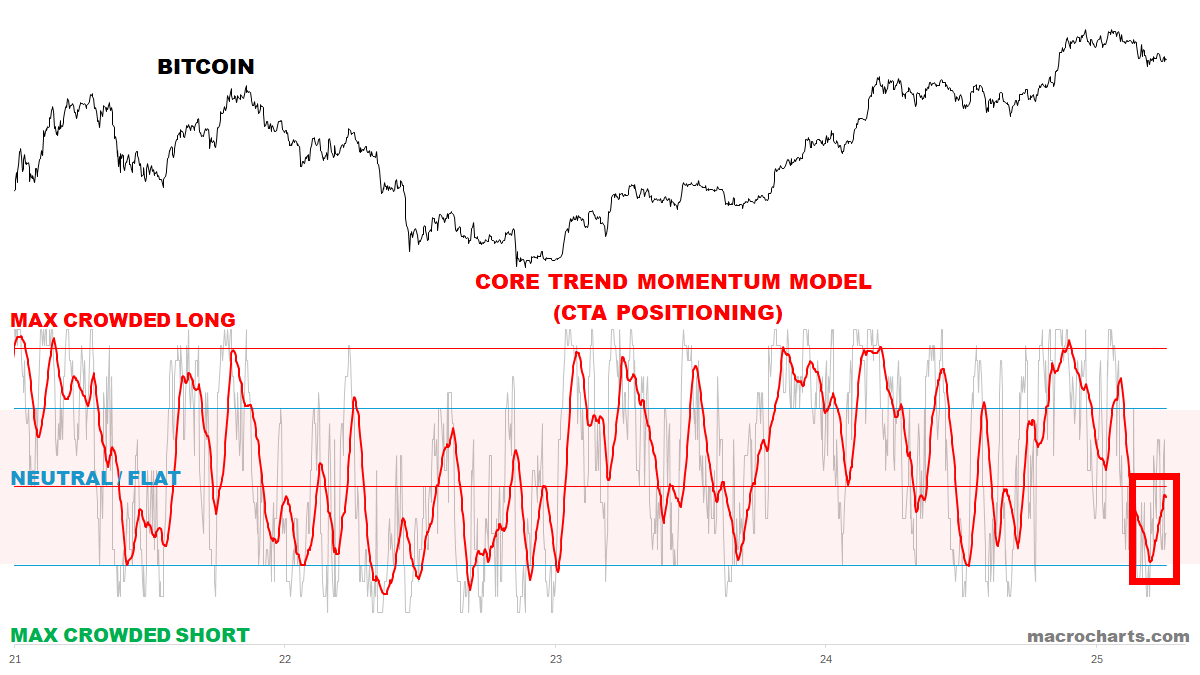
BITCOIN
EXECUTION PLAN FOR NEXT WEEK
Disclaimer: this is NOT a recommendation, only what I’ll be doing for my personal portfolio. And for anyone trying to catch falling knives, never use leverage.
Beyond next week’s (likely) extreme short-term volatility, forward 3-6 month Equity returns look significantly positive and asymmetric.
My plan is to build a medium-term allocation which I’ll be holding for a minimum window of 3-6 months, and prepared to take an initial drawdown. I’ve been fortunate to sidestep a significant amount of the volatility so far (though not all), and am in position to increase exposure accordingly.
IF the market follows historical patterns and residual selling is seen on Monday’s cash open: if there’s a gap down of 2-5% and big support levels are tested (as highlighted in today’s charts), I will automatically begin buying using VWAP program from the open to the close. I don’t care about the exact bottom tick, only the day’s average price.
My goal is to take U.S. Equity (Tech, Growth, Quality) exposure up to 60-70%, and if a reversal is seen, build more from there.
Additionally, I’ll be looking to add to Silver and Bitcoin back to full size (if possible).
I’ll be in touch on subscriber chat and publish Alerts as conditions develop — good luck to you next week.
Thanks for reading.
Onwards and upwards, -MC