
Global Markets – Weekly Review 39
全球市场 - 每周评论39
Perfect setups are very rare — but this could be it.

“When you get a range expansion, the market is sending a loud, clear signal it’s ready to move in the direction of that expansion.”
“当范围扩大时,市场正在发出响亮而明确的信号,它已准备好朝着扩大的方向发展。”
— Paul Tudor Jones - 保罗都铎·琼斯(Paul Tudor Jones)

110+ updated Charts & Commentary on all major Markets — for your weekend reading.
110 多个关于所有主要市场的更新图表和评论 - 供您周末阅读。
“Don’t start the week without it”
“没有它就不要开始新的一周”
NEW DEVELOPMENTS 新事态发展
STOCKS: A textbook rally — now comes the tricky part.
股市:教科书般的反弹——现在是棘手的部分。International Markets charging ahead — upending consensus.
国际市场向前推进——颠覆共识。Full list of Buy setups + Key levels for next week.
下周购买设置 +关键水平的完整列表。
RATES & FX: A huge week for our Core thesis — what’s next?
利率与外汇:对于我们的核心论文来说,这是重要的一周——接下来会发生什么?METALS: Perfect setups are very rare — but this could be it.
金属:完美的设置非常罕见——但这可能就是这样。Complete review of key Market Signals.
对关键市场信号的完整审查。Full Charts & Commentary:
完整图表和评论:Core Models 核心模型
Global Equities & Sectors
全球股票和行业Volatility 挥发性
Rates & Credit 费率和积分
Currencies 货币
Commodities 商品
Bitcoin 比特币
Let’s get started: 让我们开始吧:
SECTION 1 第 1 节
CORE MODELS & DATA 核心模型和数据
Core Risk is still following the ideal sequence.
核心风险仍然遵循理想的顺序。
There’s room to move higher.
还有上升空间。The risk of a bigger correction remains *relatively low* at this time.
目前,出现更大幅度调整的风险仍然“相对较低”。

Put/Call Ratios are back to complacent levels, and *beginning* to draw the ideal divergence pattern — as proposed recently.
看跌期权/看涨期权比率回到了满意的水平,并且“开始”绘制理想的背离模式——正如最近提出的那样。
In order to to develop a bigger Top, this divergence should last a FEW more weeks — ideally into late February / early March.
为了形成更大的顶部,这种背离应该再持续几周——最好持续到二月底/三月初。We remain constructive on Stocks and emphasize it’s probably still too early to turn negative.
我们对股市仍持建设性态度,并强调现在转为负面可能还为时过早。For new subscribers, our Core 2025 Strategy was published in December’s Special Report.
对于新订阅者,我们的核心 2025 战略已在 12 月的特别报告中发布。

High-Low Oscillators remain on active Buy signals and are still rising sharply.
高低振荡器仍然处于活跃的买入信号,并且仍在大幅上涨。
*Reiterating: our base case is a rally back to the overbought zone into later Q1 (stay tuned).
*重申:我们的基本情况是在第一季度晚些时候反弹回到超买区域(敬请关注)。


S&P MACD Profile is constructive and continues to expand — with room to move higher.
标准普尔 MACD 曲线具有建设性,并继续扩大——有走高的空间。
*Note the Buy triggered on JAN 14 — the day after the bottom.
*请注意,买入于 1 月 14 日触发——触底后的第二天。
*We’re monitoring this within Core Signal tracking going forward.
*我们正在通过核心信号跟踪来监控这一点。

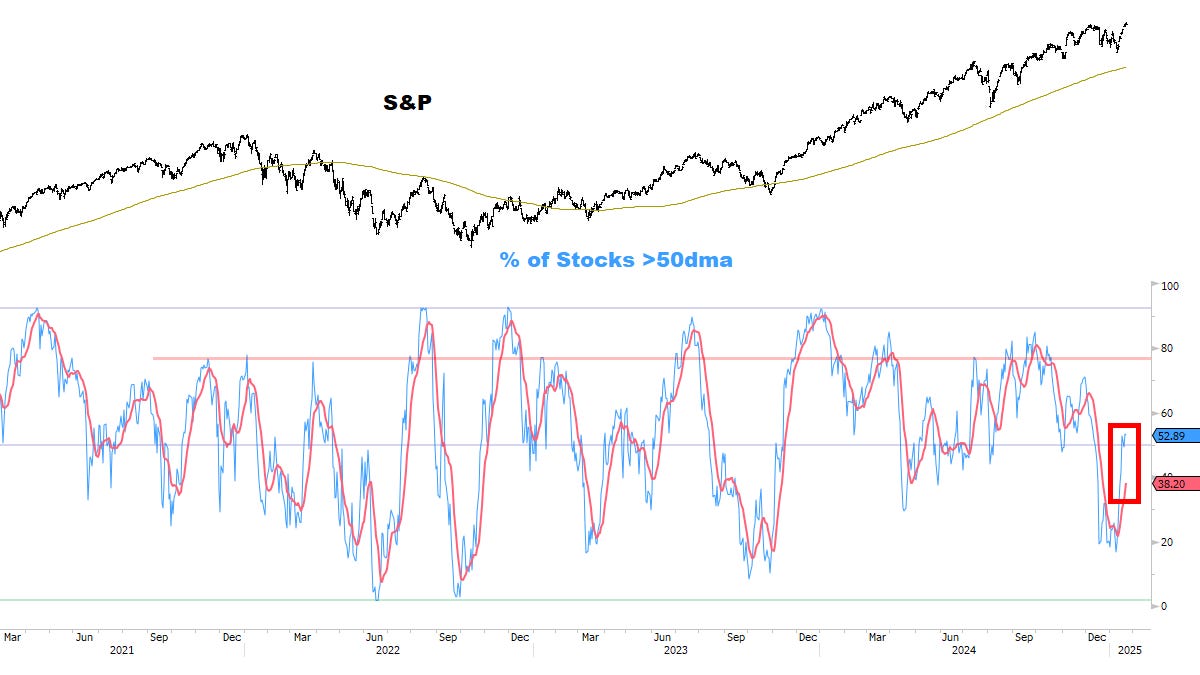
S&P 50dma Breadth continues to recover after the Buy signal.
买入信号后,标普 50 日均线广度继续恢复。
*Reiterating: our base case is a rally back to the overbought zone into later Q1.
*重申:我们的基本情况是在第一季度晚些时候反弹回到超买区域。
S&P 20dma Breadth is Short-Term overbought:
标准普尔20DMA广度是短期购买的:
After a torrid 2-week rally, this could lead to a pause.
经过2周的torrid 2周的集会,这可能会导致停顿。Note however — the moving average is still rising and has room to get more overbought — another vote for staying constructive here.
但是请注意 - 移动平均线仍在上升,并且有空间可以获得更多的过分买卖 - 在这里保持建设性的另一票。

Similarly, the McClellan Oscillator has a classic oversold-to-overbought pattern:
同样,McClellan振荡器具有经典的超售出模式:
Coming after a Tactical low, this can sometimes lead to a pullback or consolidation.
以战术低点的速度,这有时会导致回调或巩固。Note the similarity with August 2024 (RED BOX) — a common pattern:
注意与2024年8月(红色框)的相似性 -一种常见模式:At the time, Stocks also rallied “straight to the highs” — then S&P pulled back over the next weeks, retesting and filling open gaps for an optimal Buy/Add point.
当时,股票也集会了“直接到高点”,然后在接下来的几周内退缩,重新测试并填补了开放的空白,以获得最佳的购买/添加点。In Section 2, we’ll show what this scenario could look like — and IF seen, would move us to Tactically “Buy the dip”.
在第2节中,我们将展示这种情况的外观 - 如果看到的话,将使我们在战术上“购买蘸酱”。

Summation Index remains on a Buy signal — another important vote for staying constructive here.
总和指数仍然存在于买信号 - 在此保持建设性的另一个重要投票。

CTA Equity Positioning capitulated at ideal levels and has just turned up (CTAs buying Stocks again).
CTA股权定位以理想的水平下降,并且刚刚出现(CTA再次购买股票)。
*This remains an important vote for staying constructive here (“Buy the dips” if seen). If history is a guide, CTAs could be chasing the Market for *at least* a few weeks longer.
*这仍然是在这里保持建设性的重要投票(如果看到的话,“购买蘸酱”)。如果历史是指导,CTA可能会将市场追赶至少 *至少几个星期。

S&P Sentiment has room to recover back to the 80-90% range — and the moving average is still just turning UP.
Feels like the Bulls have time on their side here as well.

VIX Sentiment was a major “tell” at the January bottom, after reaching panic levels.
*Reiterating: Volatility expectations have room to drop significantly from here (a tailwind for Stocks).

CTA Rates Positioning turned last week from “Max Short Bonds” — and *essentially pinpointed* the Top in Yields.
*This continues to track as a potential major inflection point. Bias remains to Buy dips in Bonds & look for optimal Add levels (more on this in Section 2).

Bond Sentiment also continues tracking a potential major inflection point — at the ideal confluence of Time and Price.
Everything in its right place, so far…

BIG PICTURE: ISSUES REMAIN
As discussed before, many imbalances are likely to impact Stocks this year:
Speculative Option Volume is tied with NOV 2021 and beginning to “stall” — suggesting Stocks should (at best) remain in this range for a while.

Speculation Index.
Another important signal suggesting Stocks should remain rangebound — and *eventually* a correction could take hold.
As before, we’ll continue to monitor Sectors / Stocks for evidence of a bigger turn — and when confirmed, we’ll respond accordingly.
For now — as we’ll show in Section 2, most Sector charts remain constructive.


Option Skews and Gamma convey a similar message:
Don’t expect “runaway returns” from U.S. Equities this year (and for the first time in a while, finally we could see opportunities elsewhere).


Long-Term Breadth continues to deteriorate:
If/when Breadth breaks down, it would likely trigger a large correction.
As discussed in the December Special Report, our core plan for opportunistic Shorts will focus on the weakest areas which develop bounce failures early this year — potentially signaling the year’s biggest decliners.
As before, and until the bigger picture changes, we remain Bullish.


SECTION 2
KEY TECHNICAL CHARTS
STOCKS
A textbook rally — now comes the tricky part:


International Markets charging ahead — upending consensus.
International Stocks tend to do well when mood hits rock-bottom and things improve “just a little”.
Just a month ago, BofA’s Fund Manager survey had everyone on board for “U.S. #1” in 2025 (again).
Fast forward to today, Europe is up nearly +10% YTD including EUR (which is up +1.4%).
European Banks & Luxury Stocks are up +10-15% — our “go-to” Luxury Stocks (LVMH and Hermes) are the two best-performing Euro Stoxx 50 names this year.
And January isn’t even done yet…


The potential is clear — International Markets could significantly outperform the U.S. this year.
Meanwhile, China hasn’t fully joined the rally yet — but could it finally be gearing up?


Japan — the exception: as before, continue to view Japan as a potential laggard this year.


RATES
A huge week for our Core thesis — what’s next?


CURRENCIES
A huge week for our Core thesis — what’s next?


OIL & ENERGY
Concerns building.


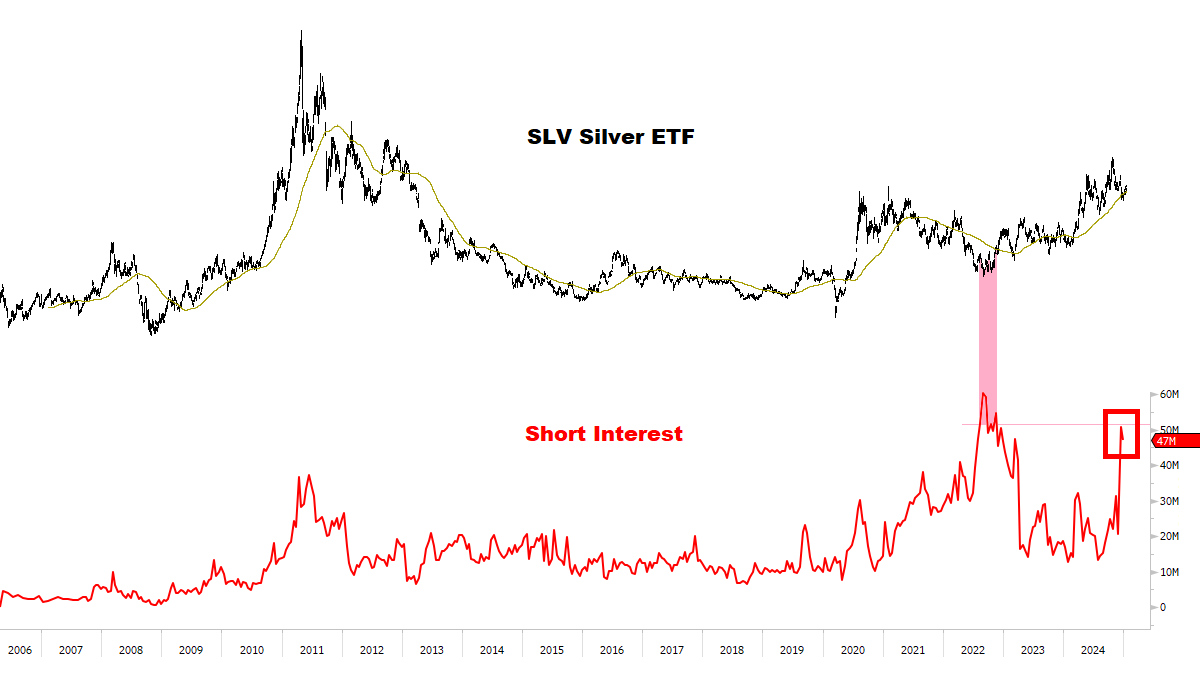
METALS
Perfect setups are very rare — but this could be it.


BITCOIN

FINAL THOUGHTS
Precious Metals, Bitcoin, Rates and Currencies continue to build enormous potential energy.
If prices push a bit further, Momentum could quickly dominate.
In Physics, this is Potential Energy becoming Kinetic Energy.
In Markets, this is Trend Acceleration / Range Expansion.
“When you get a range expansion, the market is sending a loud, clear signal it’s ready to move in the direction of that expansion.” (Paul Tudor Jones)
Conditions are still in flux — but the opportunity could be massive.
We’ll continue to focus on this closely — and be 100% ready if/when the moment comes.
Thanks for reading.
Onwards and upwards, -MC


Terrific post. Easy on the eyes (limited ital for special emphasis = effective). Edge of our seats for next chapter.