We would like to thank Peter Tang for all his work on SLICK, and for helping us write this post!
我们要感谢Peter Tang在SLICK上的所有工作,以及在撰写这篇文章时对我们的帮助!
To support the people and communities who use our apps and products, we need to stay in constant contact with them. We want to provide the experiences we offer reliably. We also need to establish trust with the larger community we support.
为了支持使用我们的应用和产品的人民和社区,我们需要与他们保持持续联系。我们希望可靠地提供我们所提供的体验。我们还需要与我们支持的更大社区建立信任。
This can be especially challenging in a large-scale, quickly evolving environment like Meta, with thousands of engineers frequently deploying code, prototyping features, and iterating over changes. We need to have clear expectations for each product, feature, and service.
在像Meta这样的大规模、快速发展的环境中,这可能特别具有挑战性,Meta拥有数千名工程师频繁部署代码、原型功能和迭代变更。我们需要对每个产品、功能和服务有明确的期望。
With these, we can better visualize the desired experience for the people using our services and analyze any bottlenecks or complex interactions between our systems.
通过这些,我们可以更好地展现使用我们服务的人所期望的体验,并分析我们系统之间的任何瓶颈或复杂的交互。
We started looking at service-level indicators (SLIs) and service-level objectives (SLOs) as a way to set expectations and measure performance of services against those expectations. To provide tooling support for this, we built SLICK — a dedicated SLO store.
我们开始关注服务水平指标(SLIs)和服务水平目标(SLOs),作为设定期望并衡量服务表现的方式。为了提供工具支持,我们建立了SLICK - 一个专门的SLO存储。
With SLICK, we are able to centralize SLI and SLO definitions to easily find and understand another service’s reliability; provide service owners with insights using high-retention, full granularity data for key service metrics not found in other tools; and integrate SLOs with various other workflows at the company to ensure that SLOs become a part of day-to-day work.
通过SLICK,我们能够将SLI和SLO的定义集中起来,以便轻松找到和理解其他服务的可靠性;使用高保留度、完整细节的关键服务指标数据为服务所有者提供洞察力,这些数据在其他工具中找不到;并将SLO与公司的各种其他工作流程集成,以确保SLO成为日常工作的一部分。
Before SLICK, SLOs and other performance metrics were stored in custom dashboards, documents, or other tools. If you wanted to locate a team’s SLOs, it could take an hour of searching or asking people to find something.
在SLICK之前,服务水平目标(SLO)和其他性能指标被存储在定制的仪表板、文件或其他工具中。如果你想要找到一个团队的SLO,可能需要搜寻一个小时或询问他人才能找到。
In addition, our previous systems didn’t retain these metrics at full granularity for more than a few weeks. This made it nearly impossible to analyze an SLO over longer periods of time. With SLICK, we are now able to:
此外,我们之前的系统无法在几周以上的时间内保留这些指标的完整细节。这几乎使得在较长时间内分析服务水平目标变得不可能。有了SLICK,我们现在能够:
- Define SLOs in a unified way for our services
为我们的服务以统一的方式定义服务水平目标(SLOs) - Have up to per-minute granularity metric data with up to two years of retention
具有最高每分钟粒度的测量数据,并保留长达两年的时间 - Have standard visualizations and insights for SLI/SLO metrics
具有SLI/SLO指标的标准可视化和洞察力 - Send periodic reliability reports to internal groups, allowing teams to use them for reliability reviews
定期向内部团队发送可靠性报告,供团队用于可靠性审查
Discoverability 发现性
SLICK defines a standard model, which enables everyone in the company to speak the same language when it comes to reliability. This makes it seamless for new service owners to follow company-wide standards.
SLICK定义了一个标准模型,使得公司内的每个人在谈到可靠性时都能使用相同的语言。这使得新的服务所有者能够无缝地遵循公司的标准。
It also lets them think about service expectations at the early stages of inception and design of the service.
它还让他们在服务的构思和设计早期阶段考虑服务期望。
SLICK can help us locate metric and performance data regarding the reliability of a specific service just by knowing its name.
SLICK可以通过知道特定服务的名称来帮助我们定位有关其可靠性的度量和性能数据。
It does this by building an index of onboarded services that link to dashboards with standard visualizations to analyze and assess the service reliability. So, with a single click, it becomes possible to know whether a service currently meets or doesn’t meet user expectations.
通过构建一个包含已登记服务的索引,使其链接到标准可视化仪表板以分析和评估服务的可靠性。因此,只需一次点击即可了解服务是否当前符合用户期望。
We can then start asking why.
我们可以开始问为什么。
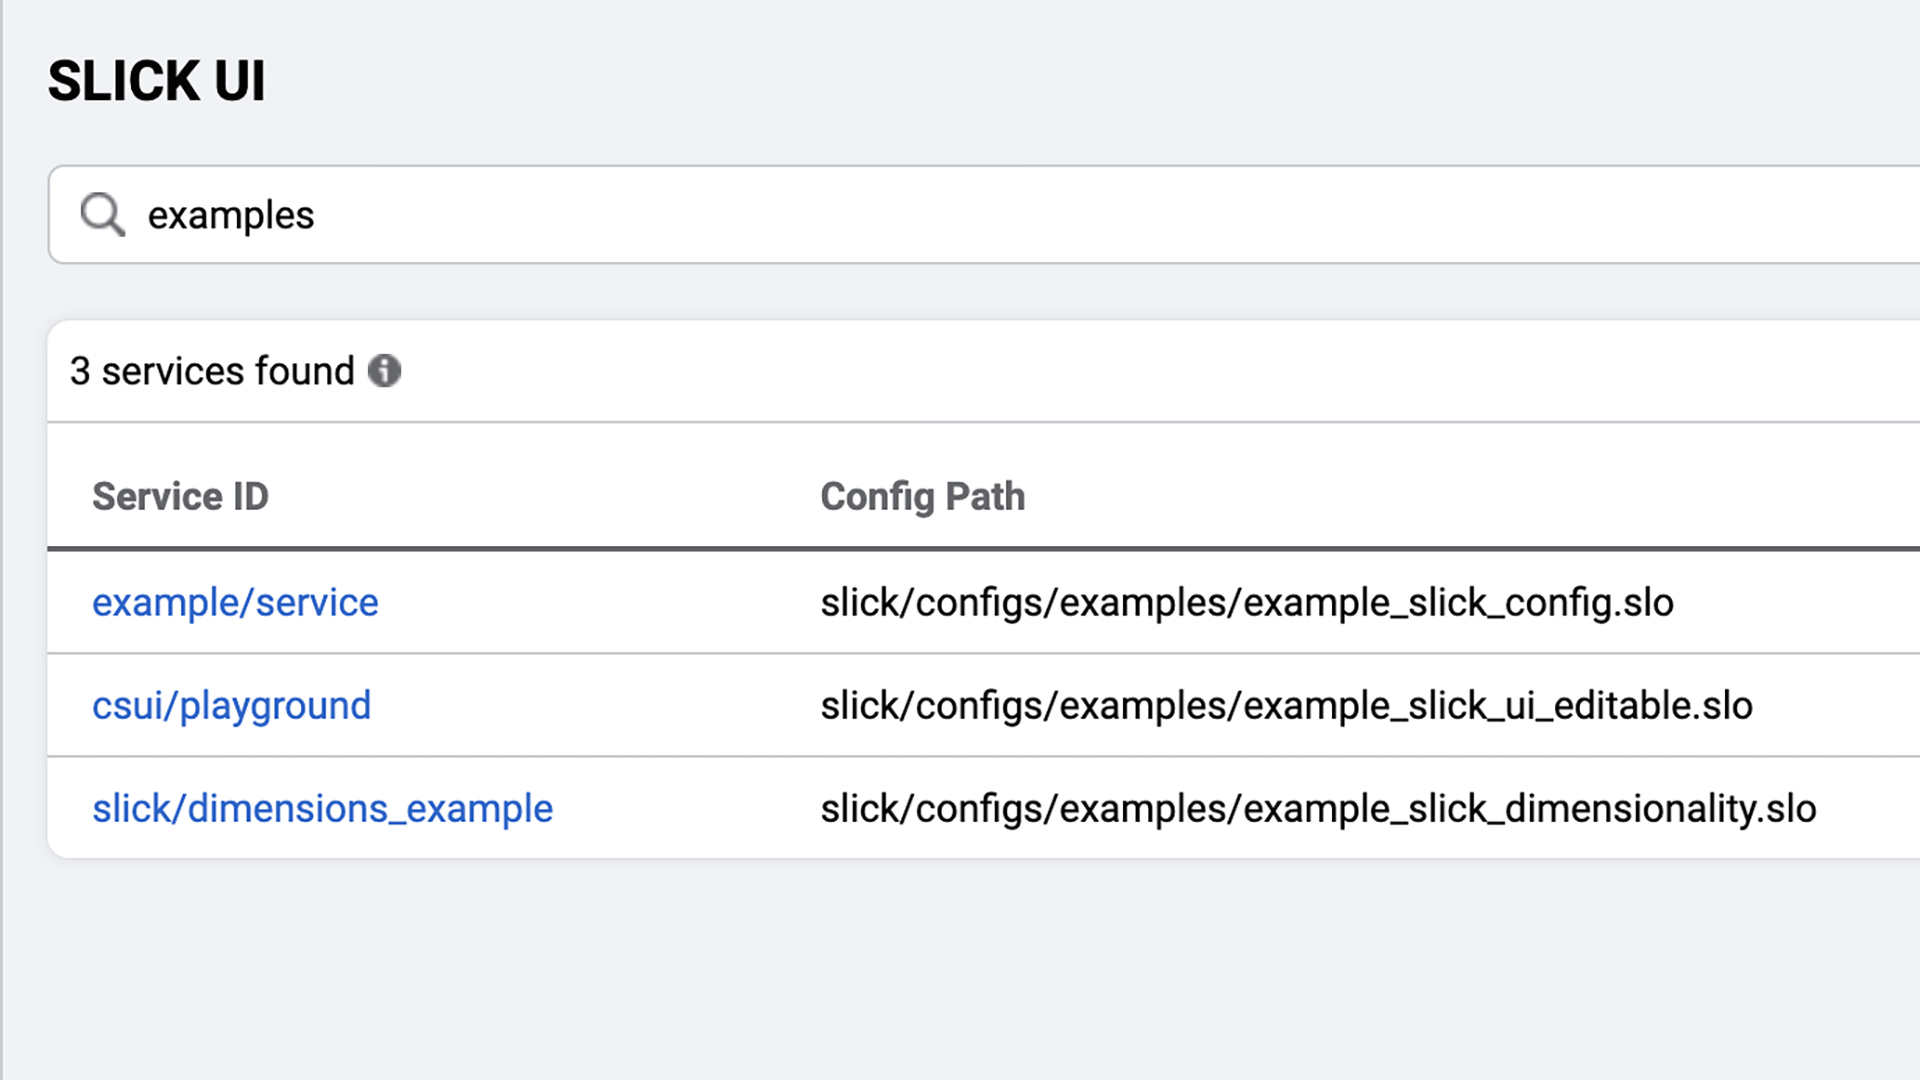
SLICK的SLO索引中的一个示例搜索。
Long-term insights 长期的洞察力
Questions about service reliability can be extremely complex. In some cases, a single bad deployment or piece of code can make a service suddenly regress. While in other cases, small, incremental changes could creep in as the service evolves.
关于服务可靠性的问题可能非常复杂。在某些情况下,一个糟糕的部署或代码片段可能会导致服务突然退化。而在其他情况下,随着服务的发展,小的渐进性变化可能会逐渐出现。
SLICK allows service owners to consume full granularity metric and performance data with up to two years of retention.
SLICK允许服务所有者使用高精度的度量和性能数据,并保留长达两年的数据。
The storage process in SLICK occurs periodically via a data pipeline that runs every hour, capturing all of the SLI time series’ data and storing them in a sharded MySQL database. The system then analyzes these to form consumable insights. This
SLICK中的存储过程定期发生,通过每小时运行的数据管道捕获所有SLI时间序列数据,并将其存储在分片的MySQL数据库中。然后系统分析这些数据以形成可消费的见解。 enables everyone — from engineers to TPMs to leadership — to understand trends over time that might reveal a regression in service reliability that otherwise might go unnoticed.
使每个人——从工程师到TPM到领导层——能够了解随时间变化的趋势,这些趋势可能揭示出服务可靠性的退化,否则可能会被忽视。
Workflows 工作流程
To amplify the value and help us use new long-term insights to drive decision-making, SLIs and SLOs need to be in a language everyone understands and uses while planning and assessing impact. To enable this, we have integrated SLOs into common workflows.
为了增加价值并帮助我们利用新的长期洞察力来推动决策,SLIs(服务水平指标)和SLOs(服务水平目标)需要用每个人都能理解和使用的语言来进行规划和评估影响。为了实现这一点,我们已经将SLOs整合到常见的工作流程中。
When a large-scale incident happens, service owners can evaluate side-by-side how it affected overall user experience. They can do so by looking at SLOs in our on-call tooling.
当发生大规模事件时,服务所有者可以通过查看我们的值班工具中的SLOs来同时评估其对整体用户体验的影响。
On the flip side, we can also use SLOs to drive the process of declaring when a large incident has occurred. We initiate this by using SLOs as criteria for incidents within the company. Many of our systems use these criteria to get alerted about problems that their users see.
另一方面,我们也可以利用SLOs来推动宣布发生重大事故的过程。我们通过将SLOs作为公司内部事故的标准来启动此过程。我们的许多系统使用这些标准来警报用户所遇到的问题。
In essence, integrating SLIs and SLOs into other tooling creates easy pathways to onboard onto SLICK (for a service not yet onboarded) or to get effective insights in accessible and easy-to-consume ways.
本质上,将SLI和SLO整合到其他工具中,为尚未接入的服务提供了便捷的途径,或以易于访问和消化的方式获得有效的洞察。
SLICK onboarding 顺畅的入职流程
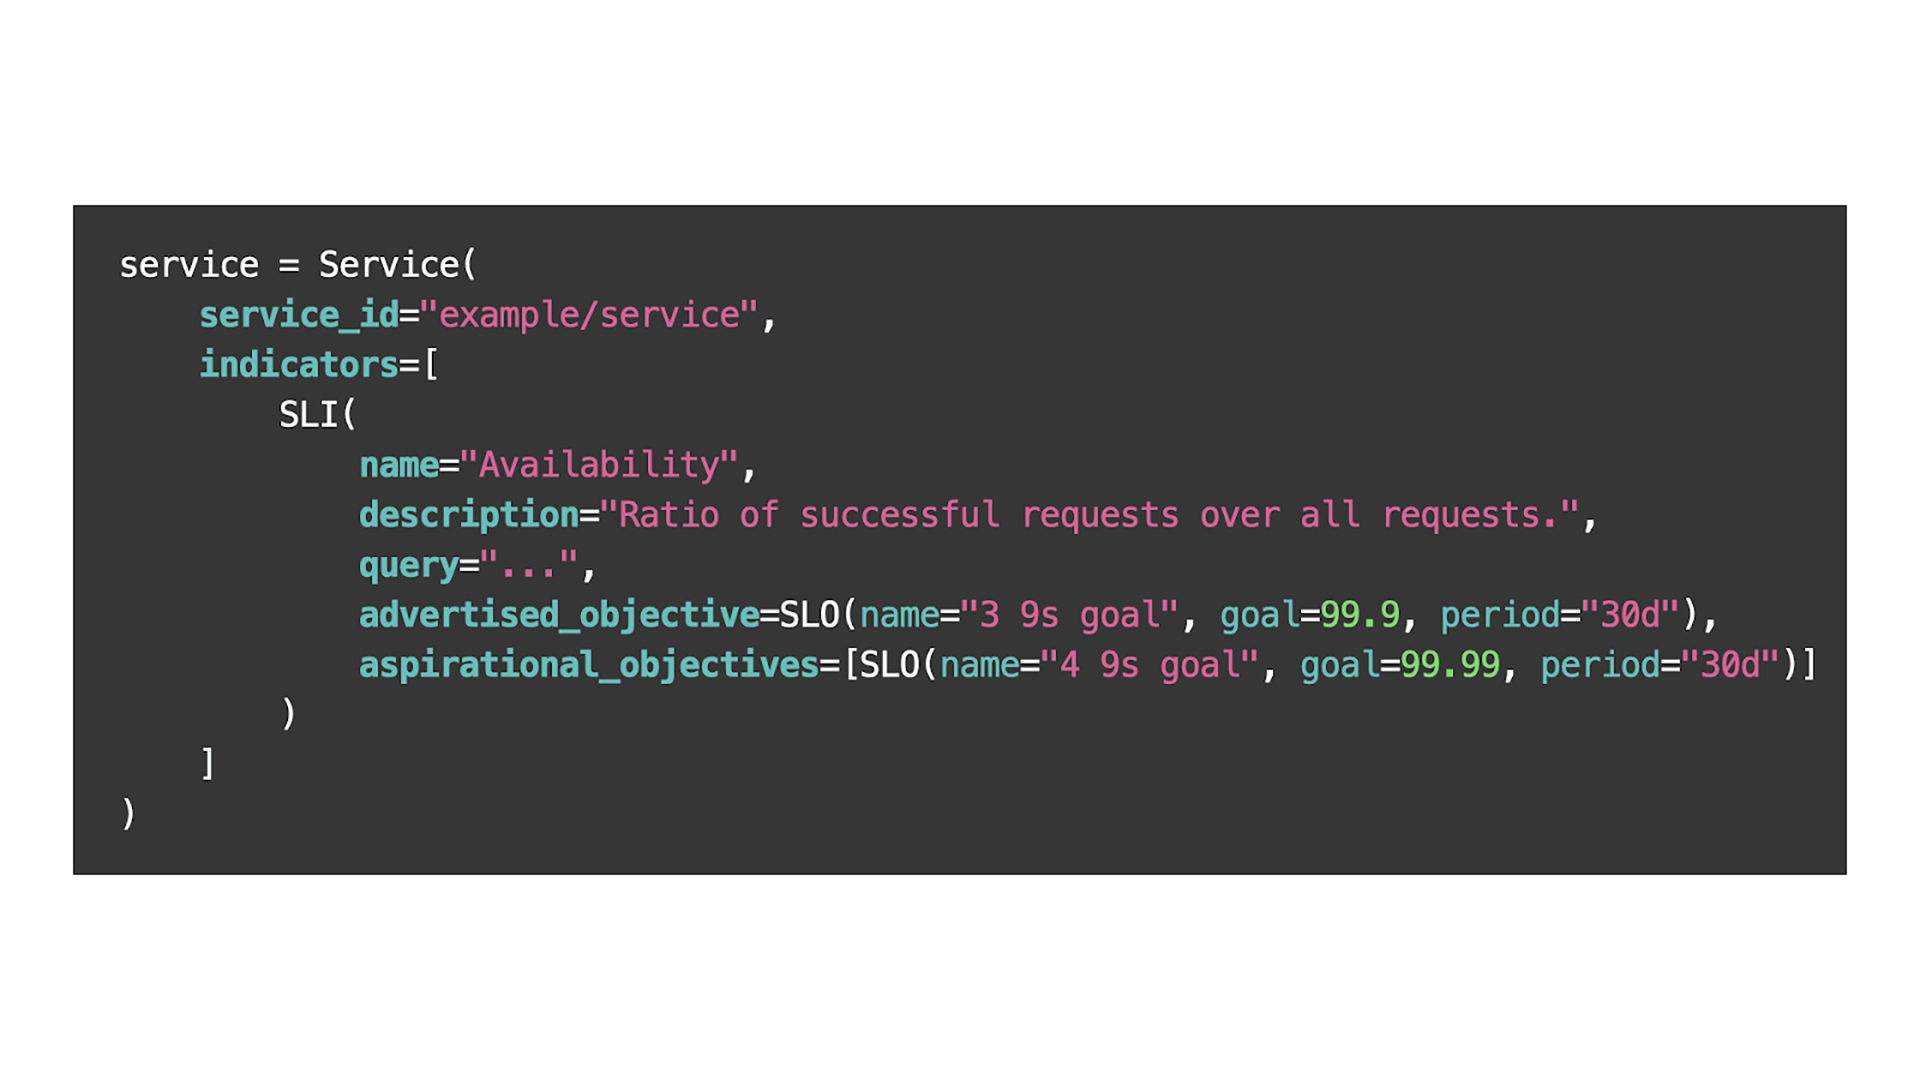
Our service owners onboard to SLICK by using an editing UI or by writing a simple configuration file, which follows a DSL with information such as the name of the service, and queries for the SLI time series along with the respective SLOs.
我们的服务所有者通过使用编辑界面或编写简单的配置文件来接入SLICK,该配置文件遵循包含服务名称和SLI时间序列查询以及相应SLO的DSL。
用户测试并提交配置后,SLICK会自动将服务添加到其索引中。然后,它会生成一个特定于服务的仪表板,并开始收集长期洞察的数据。从这一点开始,所有的集成都会立即开始工作。
Using SLICK 使用SLICK
1) Dashboards 仪表板
SLICK dashboards provide service owners with the ability to monitor real-time SLI data as well as historical trends based on high-retention, long-term data.
SLICK 仪表板为服务所有者提供了实时监控服务水平指标(SLI)数据以及基于高保留、长期数据的历史趋势的能力。
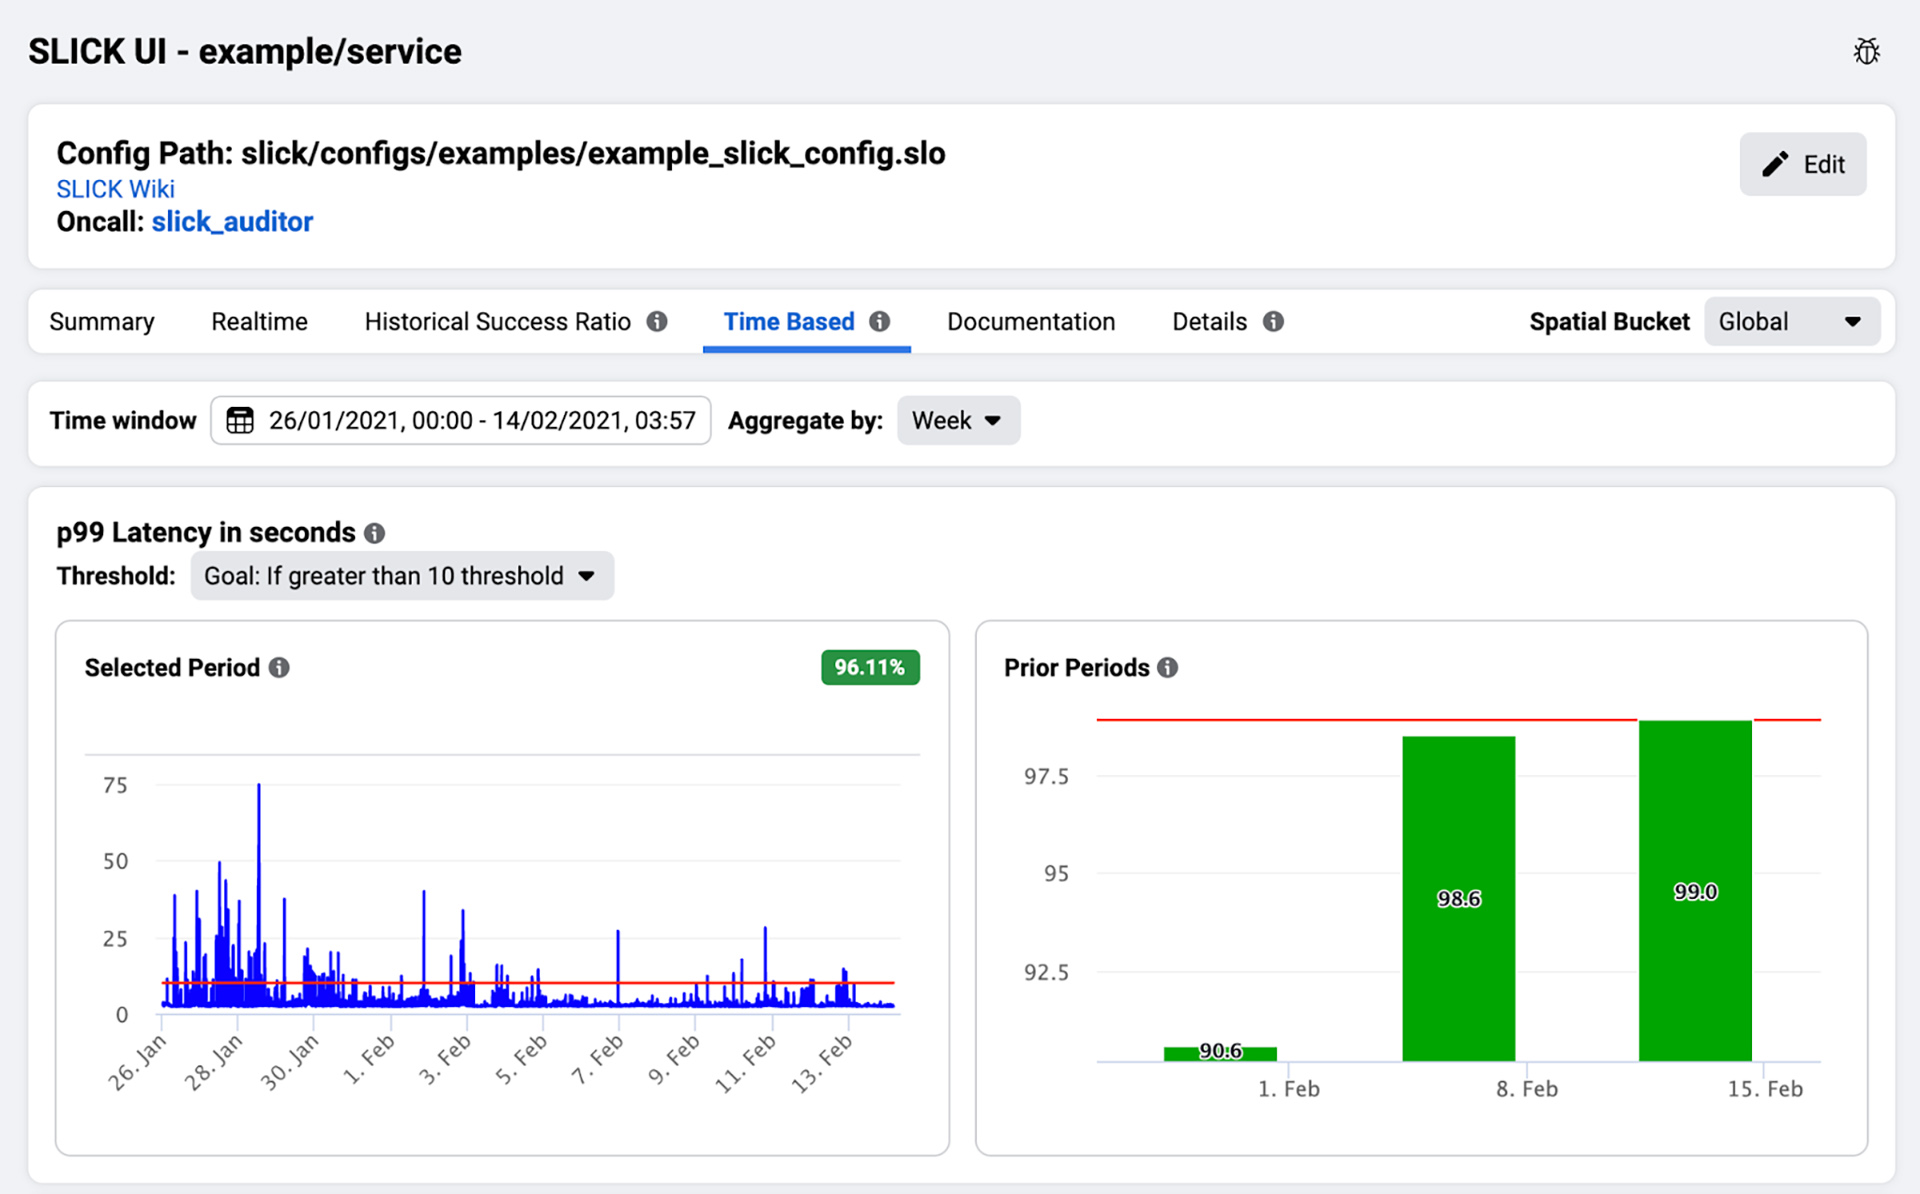
左侧展示了完整粒度的SLI时间序列。右侧显示了SLI值按周进行时间聚合,并与SLO进行比较。
2) Periodic reports 定期报告
SLICK provides engineers with the ability to receive reports with summaries of their SLO performance. These reports get posted periodically to internal groups. The reports serve as an easy way for service owners to keep an eye on regressions and conduct retrospectives.
SLICK为工程师提供了接收SLO性能摘要报告的能力。这些报告定期发布到内部群组。这些报告为服务所有者提供了一种简便的方式来关注回归并进行回顾。
We’ve often seen service owners brainstorm about reliability in the comments of these posts.
我们经常在这些帖子的评论中看到服务提供者对可靠性进行头脑风暴。
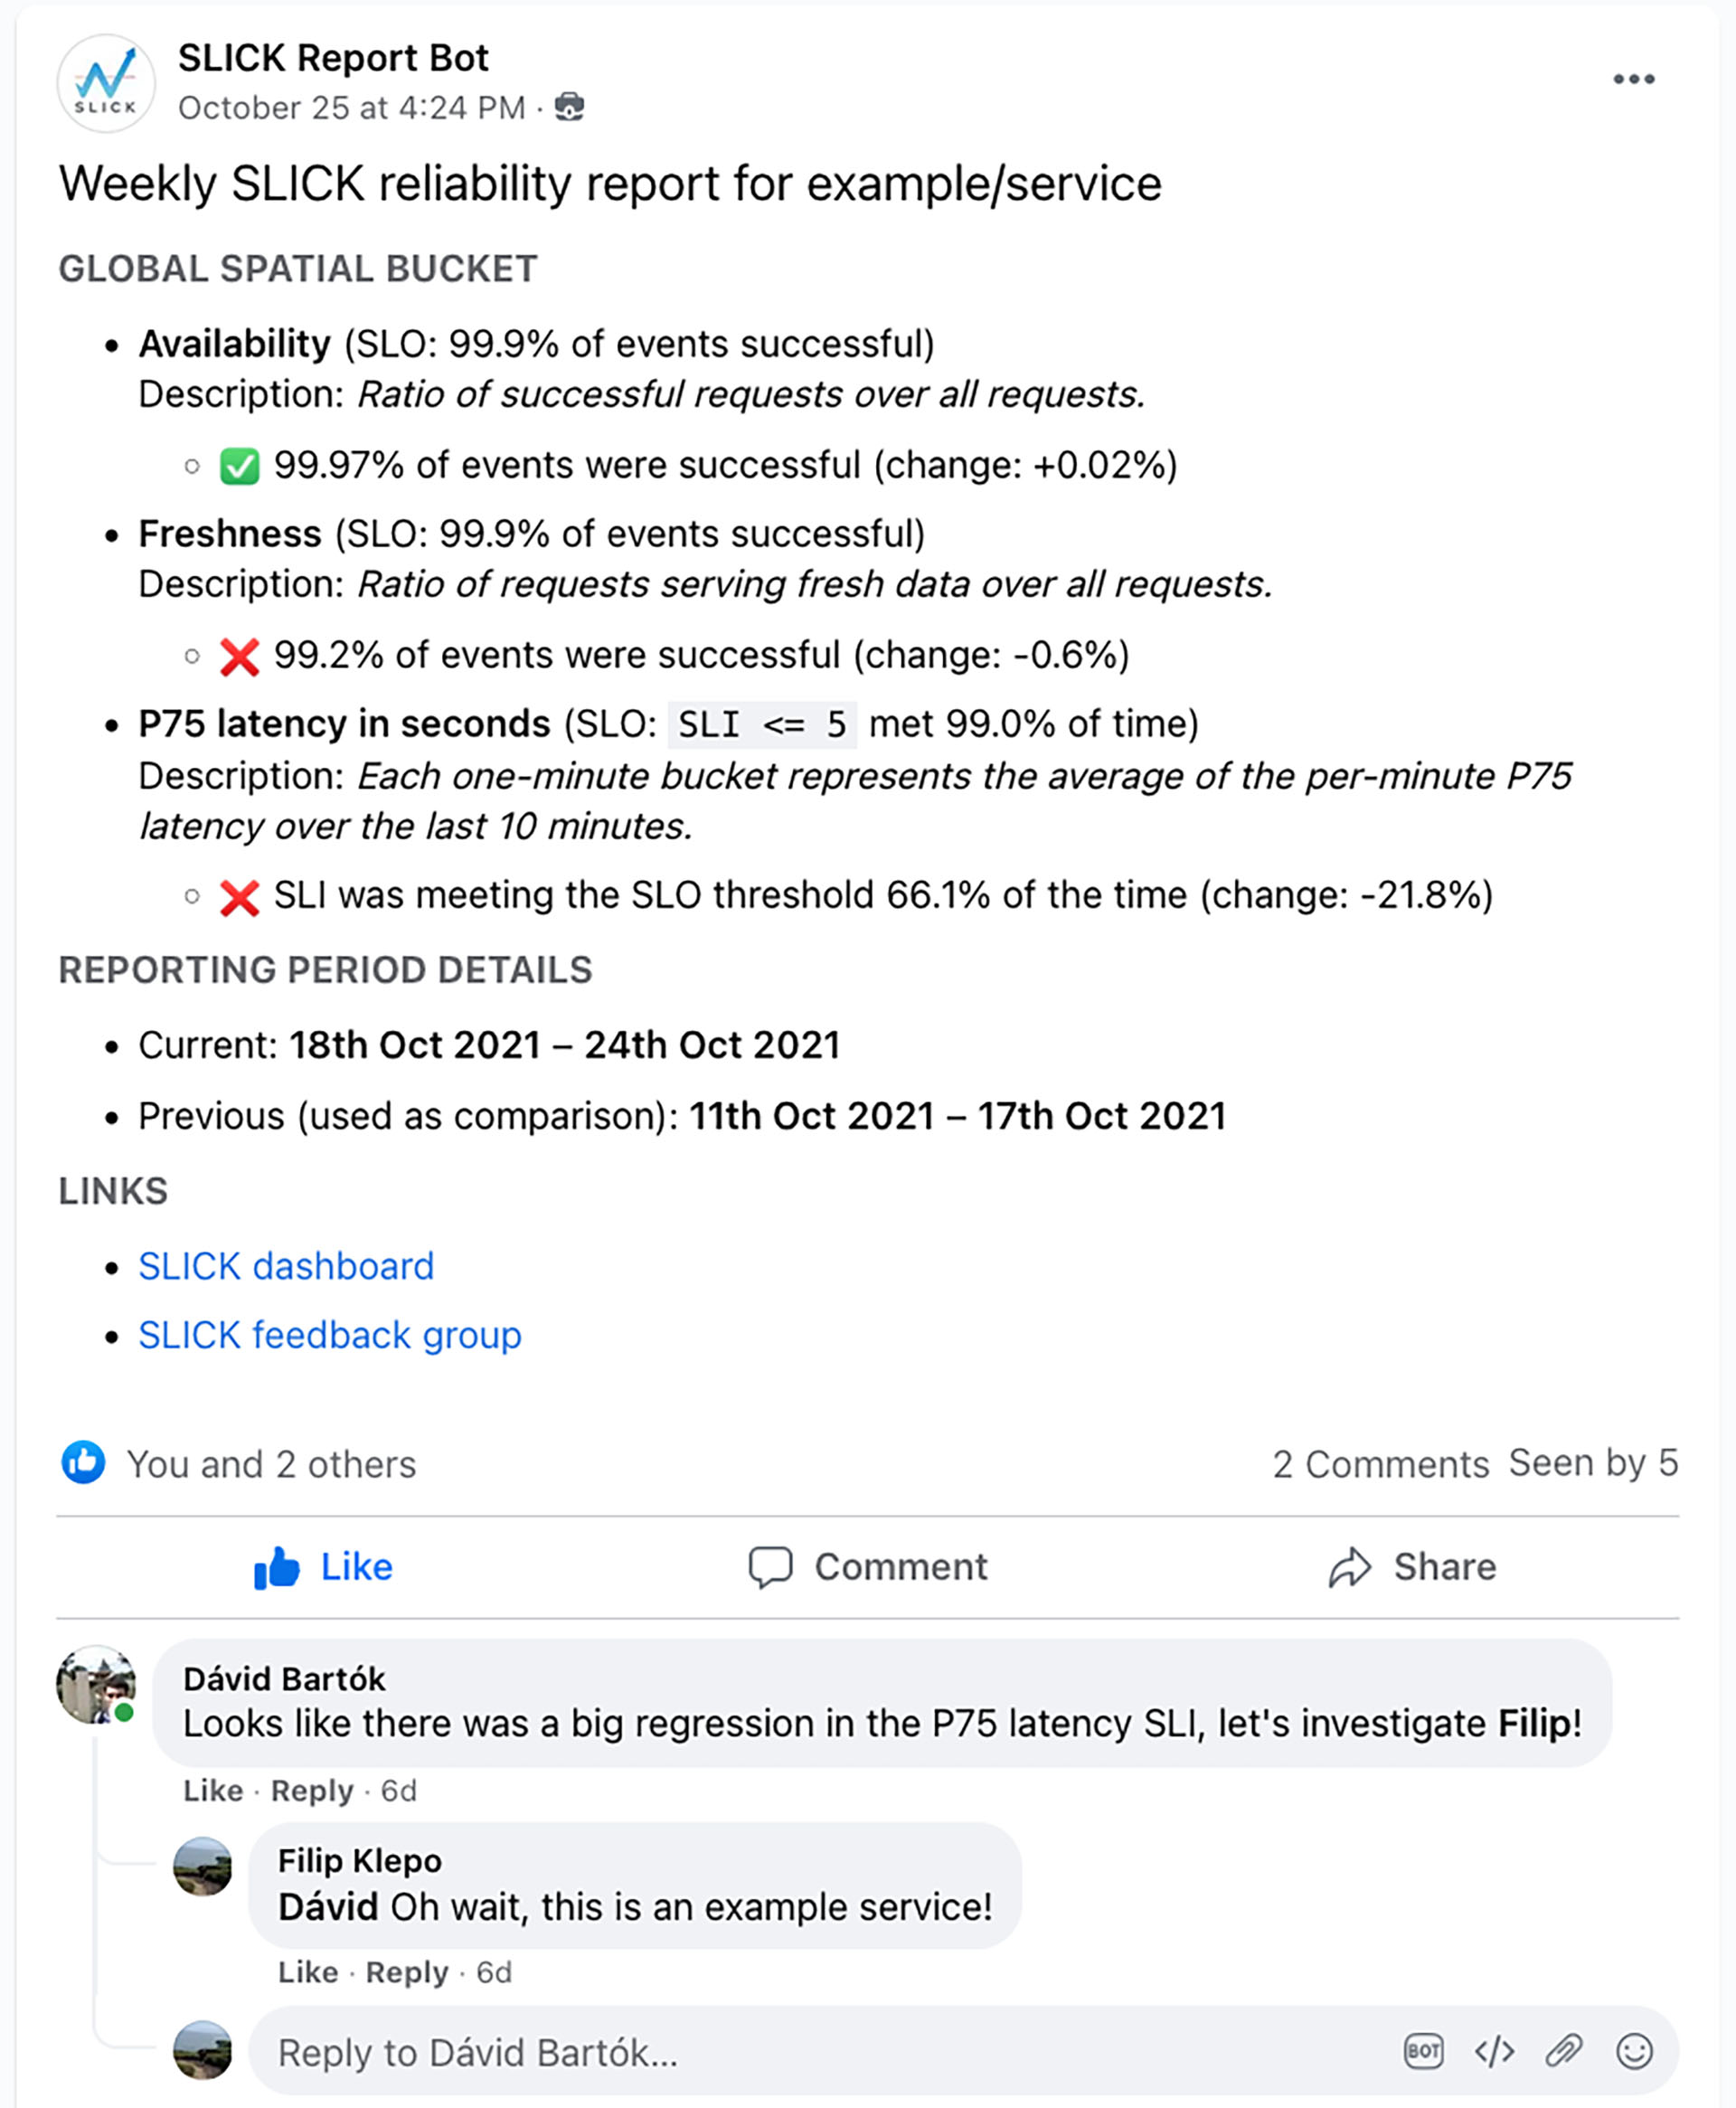
一个展示一周内SLO性能的样本SLICK报告。
3) CLI 3) 命令行界面
SLICK provides a command line interface that enables service owners to perform a few operations, such as backfilling data, generating a report on demand, or testing the effect of changes on SLICK configs.
SLICK提供了一个命令行界面,使服务所有者能够执行一些操作,例如回填数据,按需生成报告,或测试对SLICK配置的更改的影响。
SLICK architecture SLICK架构
Overall architecture 总体架构
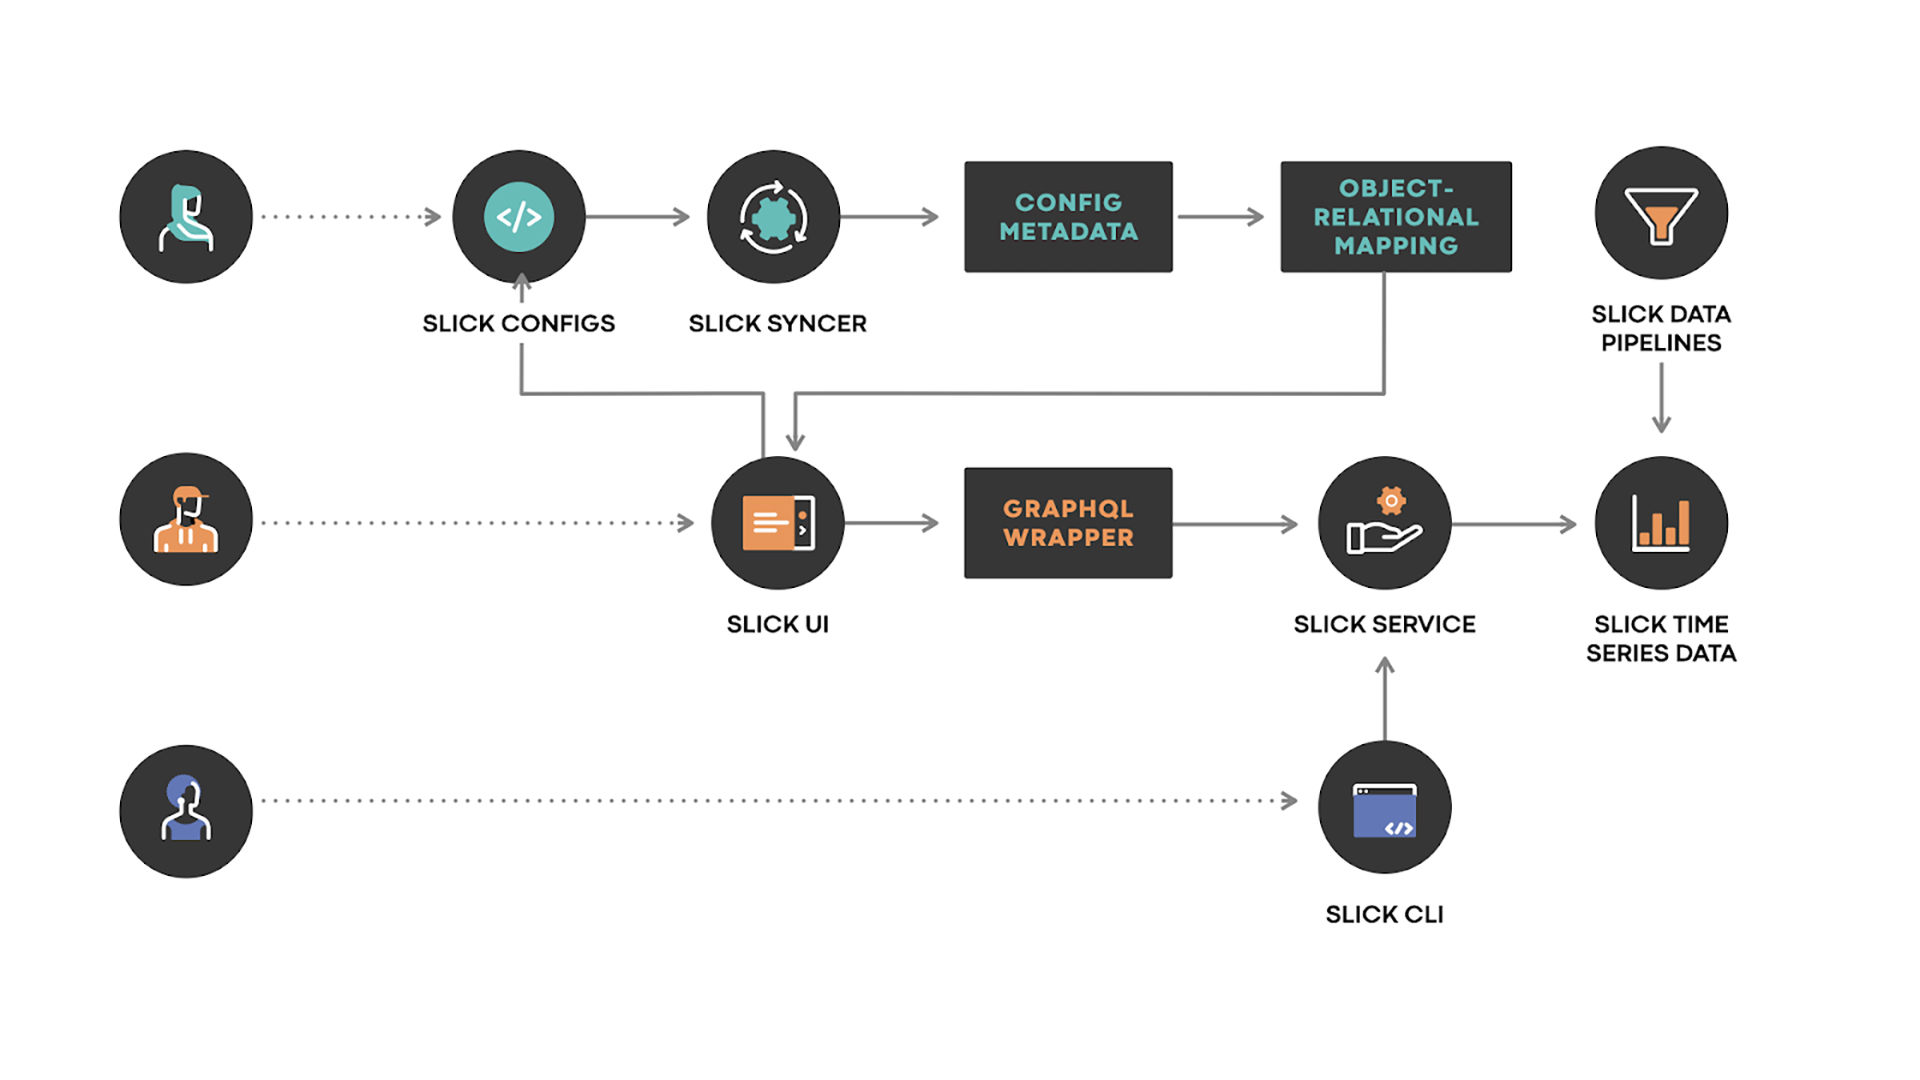
- SLICK Configs: A config file written using SLICK’s DSL, committed by the user to the SLICK config store.
SLICK配置:使用SLICK的DSL编写的配置文件,由用户提交到SLICK配置存储库。 - SLICK Syncer: A service that synchronizes changes made to SLICK configs into SLICK’s config metadata storage.
SLICK Syncer:将对SLICK配置所做的更改同步到SLICK的配置元数据存储中的服务。 - SLICK UI: These are the generated SLICK dashboards for every service. The SLICK UI also provides the index mentioned previously.
这些是为每个服务生成的SLICK仪表板。SLICK UI还提供了之前提到的索引。 - SLICK Service: A server that provides an API that is able to answer queries such as “How to compute the SLO for a specific visualization?”.
SLICK服务:提供一个API的服务器,能够回答诸如“如何计算特定可视化的SLO?”的查询。
The server allows us to abstract away all the details around data placement and sharding, and it enables the caller to easily find the data needed.
该服务器允许我们将数据放置和分片的所有细节抽象化,并使调用者能够轻松找到所需的数据。 - SLICK Data Pipelines: Pipelines that periodically run in order to capture SLI data over the long term.
SLICK数据管道:定期运行的管道,以便长期捕获SLI数据。
Zooming in on the data ingestion
数据摄入的放大
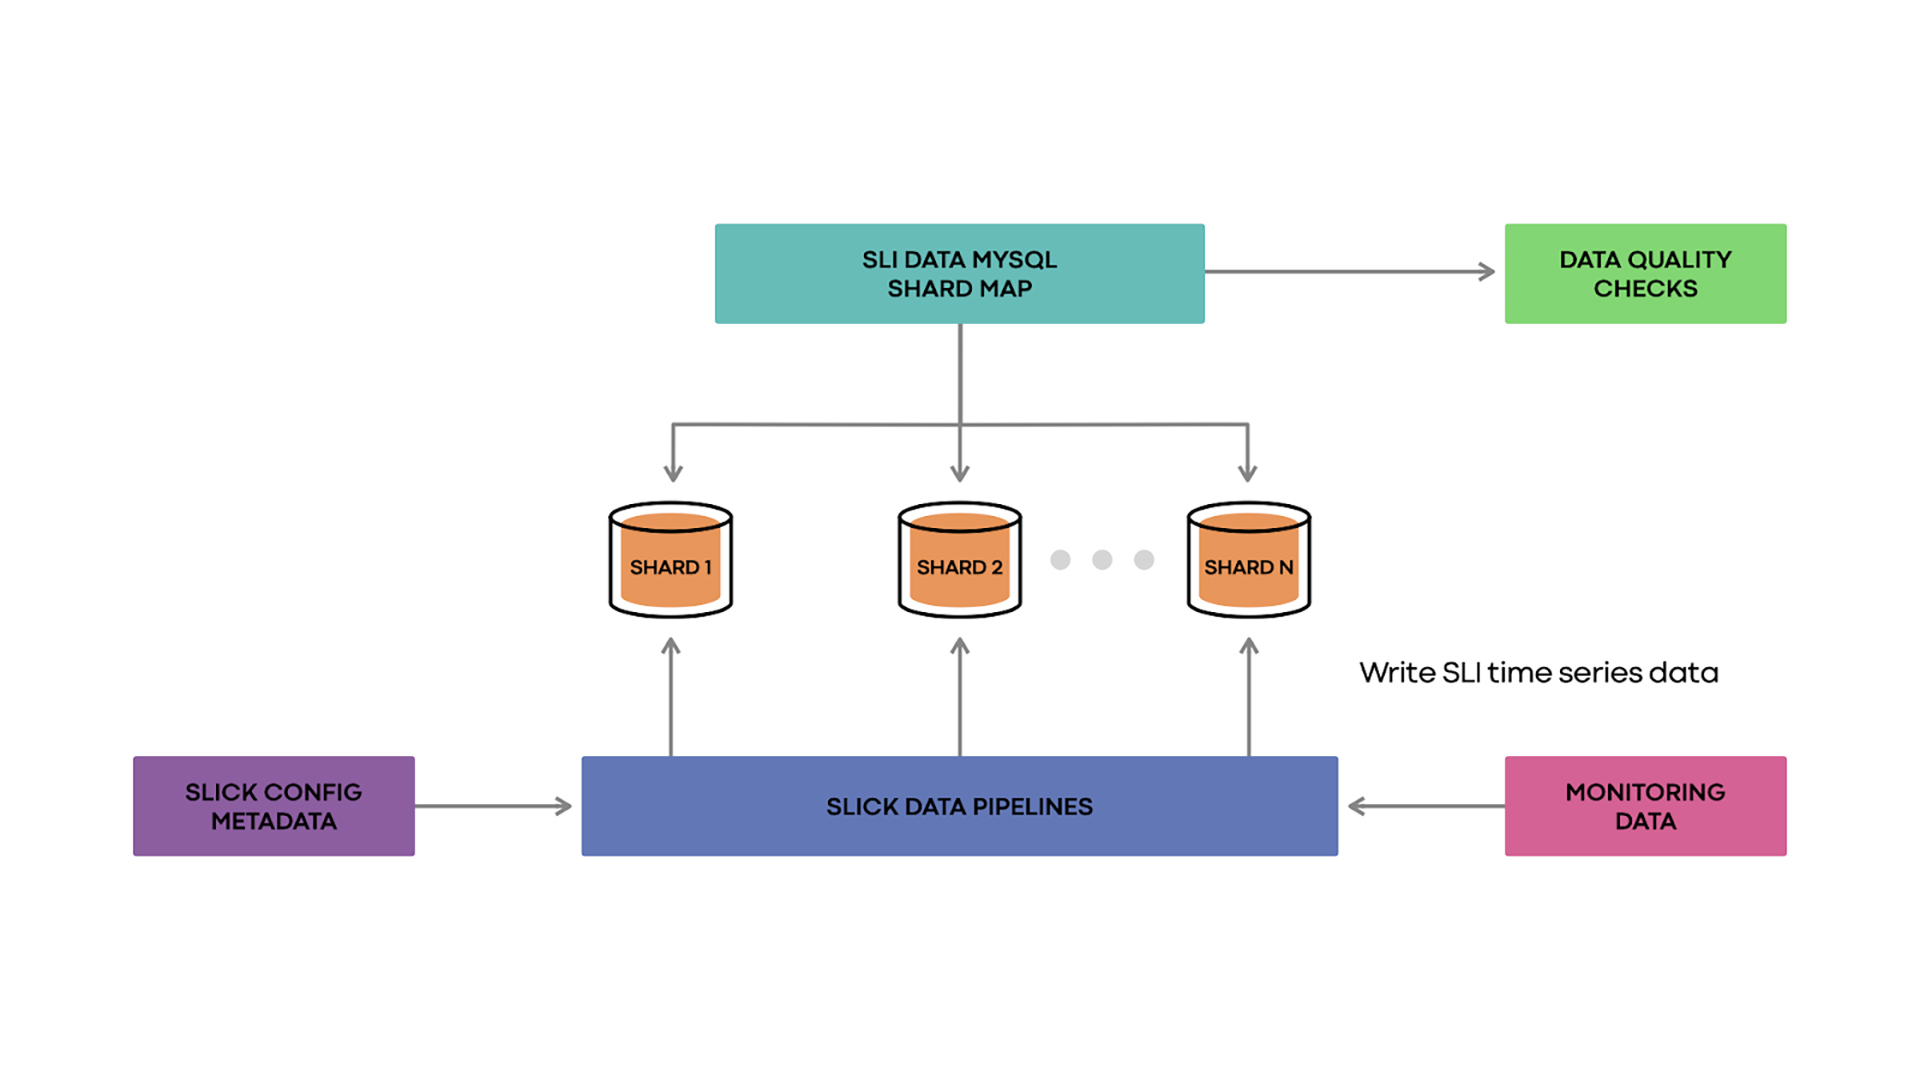
SLICK has data pipelines, which run every hour. These pipelines find the queries for all SLIs by consulting SLICK’s config metadata storage.
SLICK拥有数据管道,每小时运行一次。这些管道通过查询SLICK的配置元数据存储来找到所有SLI的查询。
The pipelines execute all the needed queries against our monitoring data sets to get the raw time series data for each of those SLIs for the hour, with a one-minute granularity.
管道对我们的监控数据集执行所有必要的查询,以获取每个服务级别指标(SLI)在每小时的原始时间序列数据,精确到一分钟。
The pipelines then consult the SLICK shard map to identify where every SLI’s data should be placed, and proceed by bulk inserting the data to the appropriate shard.
然后,管道会查询SLICK分片映射,确定每个SLI的数据应该放在哪里,并通过批量插入数据到相应的分片。
In addition, we have data quality checks to give us confidence in the way our data pipelines operate and to quickly catch correctness bugs. The data quality checks run against a set of deterministic testing time series.
此外,我们还进行数据质量检查,以确保我们的数据管道运行正常,并快速发现正确性错误。数据质量检查针对一组确定性测试时间序列运行。
We treat these deterministic time series just like real SLIs, i.e., we run the pipelines against them, and they get inserted into the sharded DB. We then compare the rows in the DB with the expected time series to verify the system’s behavior.
我们将这些确定性时间序列视为真实的SLI,即我们对它们运行流水线,并将其插入分片数据库。然后,我们将数据库中的行与预期的时间序列进行比较,以验证系统的行为。
Current state of SLOs at Meta with SLICK
Meta在SLICK方面的SLOs的当前状态
After building SLICK in 2019, we saw adoption company-wide by 2021, with more than 1,000 services onboarded to SLICK. We’ve also observed many reliability success stories around the company and have shared a couple of these below.
在2019年建立了SLICK之后,到2021年,我们看到公司范围内的采用率,已有超过1,000个服务接入了SLICK。我们还观察到了许多关于可靠性的成功案例,并在下面分享了其中的一些。
Please note that the charts below use mocked data in order to preserve confidentiality, i.e., we’ve removed the dates and slightly altered the values, but the overall shape of the charts remains unchanged.
请注意,下面的图表使用模拟数据以保护机密性,即我们已删除日期并稍微改变了数值,但图表的整体形状保持不变。
LogDevice: Detecting and fixing regressions (example)
LogDevice:检测和修复回归(示例)
LogDevice is our distributed log storage system. Using SLICK, the service owners could identify a regression in read availability. The team then fixed the issues causing the regression and confirmed via SLICK that the fixes restored the service levels for read availability.
LogDevice是我们的分布式日志存储系统。使用SLICK,服务所有者可以识别出读取可用性的回归。团队随后修复了导致回归的问题,并通过SLICK确认修复措施恢复了读取可用性的服务水平。
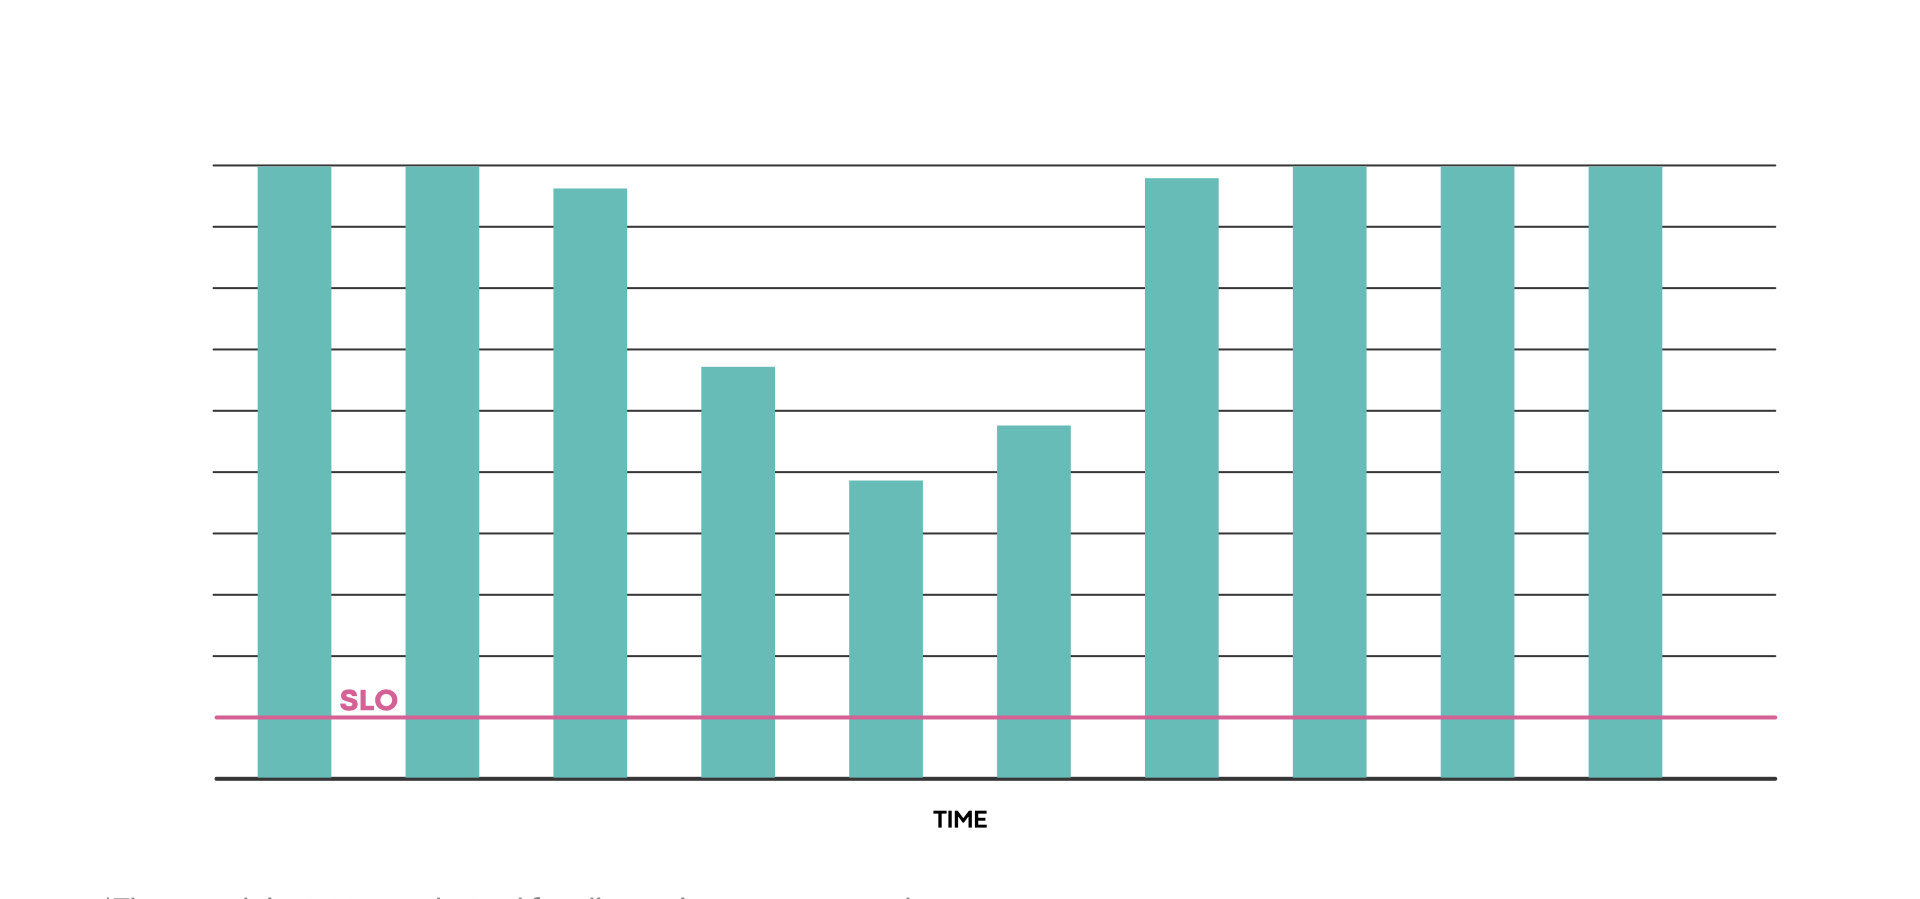
日志设备的可靠性(读取可用性)。图表不按比例绘制,仅供讨论使用。
Back-end ML service reliability example
后端机器学习服务可靠性示例
One of the critical back-end ML systems at Meta started experiencing a significant reliability regression in 2020. This involved one of the ML services that affects our end users across our apps.
Meta的一个关键后端机器学习系统在2020年开始出现了显著的可靠性退化。这涉及到了一个影响我们应用程序中最终用户的机器学习服务之一。
The SLICK data showed that they were consistently not meeting their SLO, enabling the service team to identify this regression. This data helped kick-start a reliability review, which in turn helped them investigate, find, and fix the root cause of the reliability issues.
SLICK数据显示他们始终未能达到SLO,使得服务团队能够识别出这种退化。这些数据帮助启动了可靠性审查,进而帮助他们调查、找到并修复了可靠性问题的根本原因。
The team addressed the root cause, and the service went back to meeting its SLO again.
团队解决了根本原因,服务再次达到了SLO。
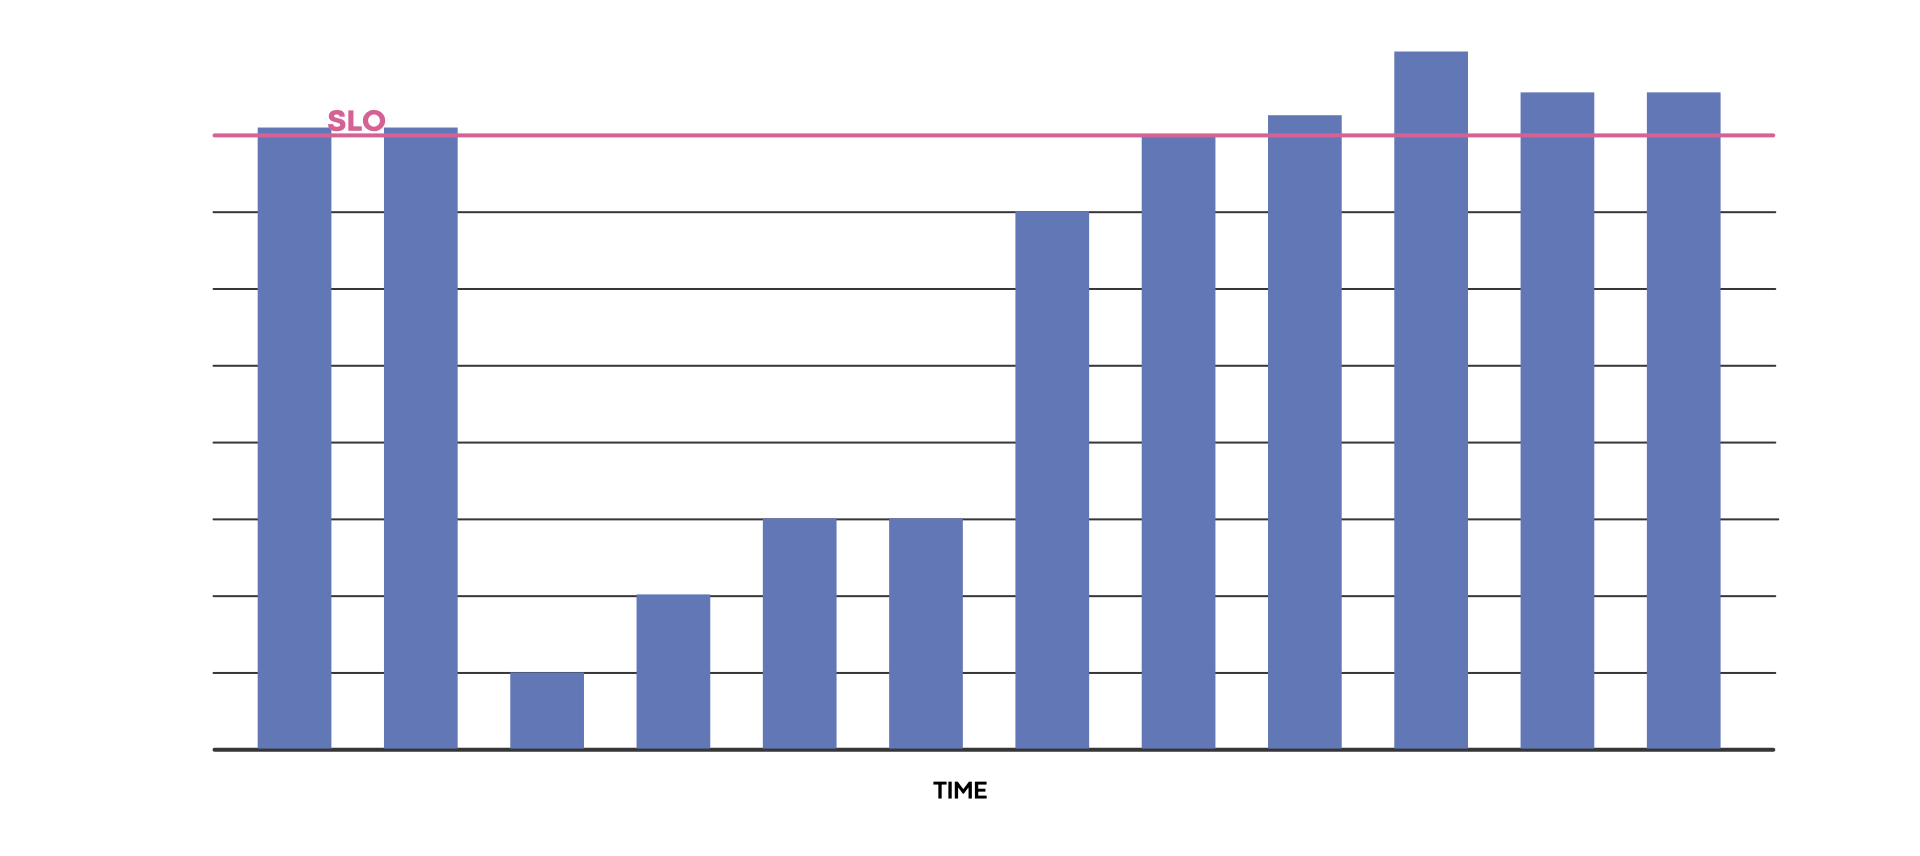
后端机器学习服务的可靠性(可用性)。图表不按比例绘制,仅供讨论使用。
Takeaways from our journey
我们旅程的收获
We have come a long way in our journey with SLOs, and we’ve learned a few lessons along the way:
我们在SLO的旅程中走了很长一段路,也学到了一些经验教训
- Long-term tracking capability is extremely valuable, as it helps us understand trends. We can then plan for reliability work over a longer period.
长期跟踪能力非常有价值,因为它帮助我们了解趋势。然后我们可以计划在较长时间内进行可靠性工作。 - SLOs must live at the center of the engineering culture, both in strategic reliability planning and day-to-day conversations.
SLOs必须在工程文化的中心生活,无论是在战略可靠性规划还是日常对话中。 - Introducing SLOs helped strengthen the overall reliability of our services.
引入SLOs有助于增强我们服务的整体可靠性。
The SLICK team will continue to work on evolving the platform to provide more value. In particular, we hope to invest in the following areas:
SLICK团队将继续努力发展平台,提供更多价值。特别是,我们希望在以下领域进行投资:
- Aligning services’ SLOs with their dependencies’ SLOs. This will allow teams to understand how their dependencies affect their performance. It will also help us surface mismatched expectations between services across the stack that could trigger cascading failures.
将服务的SLO与其依赖的SLO进行对齐。这将帮助团队了解它们的依赖如何影响其性能。它还将帮助我们发现堆栈中服务之间的期望不匹配,这可能会引发级联故障。 - Provide service owners with feedback and suggestions on how to improve their services’ reliability.
提供服务所有者关于如何提高其服务可靠性的反馈和建议。
We would like to use our past experience with improving reliability to provide actionable insights to service owners in order to help them boost their reliability and meet their SLOs.
我们希望利用过去改善可靠性的经验,为服务所有者提供可行的见解,以帮助他们提高可靠性并达到他们的SLOs。 - Significantly scaling up SLICK. We hope to onboard more teams and services onto SLICK. In order to do this, SLICK needs to stay reliable and scalable (we’ll need to meet our own SLOs!).
显著扩大SLICK。我们希望将更多团队和服务引入SLICK。为了做到这一点,SLICK需要保持可靠和可扩展(我们需要满足自己的服务水平目标!)。


")
")


