GO INTO THE LIGHT 进入光明
The BEST & WORST opportunities on my screens (1ST EDITION).
我屏幕上最佳和最差的机会(第一版)。
I have long believed consistent Investing is equal parts:
我长期以来相信,持续投资等同于:
focus on the Best opportunities in Markets (a strong OFFENSE).
专注于市场中的最佳机会(强大的进攻)。avoid crowded/classic Traps (a strong DEFENSE).
避免拥挤/经典陷阱(强大的防御)。
If I had to pick one, Defense gets the edge:
如果让我选一个,国防占优势:
Losses hurt more, so protecting against them is more important.
损失带来的痛苦更深,因此保护自己免受损失更为重要。“The deeper the hole, the harder it is to climb out…” (a 20% loss needs a 25% gain to recover, for example).
“洞越深,爬出来就越难……”(比如,20%的损失需要 25%的收益才能恢复。)
As Bear Bryant once said, “Offense wins games… but Defense wins championships.”
正如贝尔·布赖恩特曾经说过的:“进攻赢得比赛……但防守赢得冠军。”
In this new recurring series, we’ll discuss the Best & Worst charts on my screens, the signals I’m watching, and the potential medium-term/long-term implications.
在这个新的系列中,我们将讨论我屏幕上最好的和最差的图表、我正在关注的信号,以及潜在的中期/长期影响。
It’s been a strong year for opportunistic, global investing — now entering the final stretch, it seems 2024 may still have some big surprises… Some of which could last well into 2025 (or beyond).
这是一个机会主义全球投资的强劲年——现在进入最后阶段,似乎 2024 年仍可能有一些重大惊喜……其中一些可能会持续到 2025 年(或更久)。
Let’s get started: 让我们开始吧:
GO INTO THE LIGHT 走进光明
Starting with *unequivocally* my Top contender here:
毫无疑问,我在这里的首选是:
BITCOIN 比特币
On team OFFENSE: 在进攻队伍中:
I’m a Trend trader looking for big moves — wherever they may be, however far they may go.
我是一个趋势交易者,寻找大的波动——无论它们在哪里,无论它们会走多远。
In the last 2-3 reports, I’ve flagged Bitcoin’s chart with great interest — most recently:
在最近的 2-3 份报告中,我对比特币的图表表示了极大的兴趣——最近:
The potential here could be significant — and Weekly is now on the cusp of Buy confirmation:
这里的潜力可能很大——而 Weekly 现在即将确认买入:
Daily already triggered on Monday’s rally — I’m Long *initial* size, looking to add on Weekly confirmation and/or a pivot structure just under the breakout.
每日已经在周一的反弹中触发——我持有*初始*仓位,寻求在每周确认和/或突破下方的转折结构时增仓。I’m drawing a potential pivot structure in the Daily chart below, but it may or may not develop. Need to be flexible here.
我正在下方的日线图中绘制一个潜在的支撑结构,但它可能会发展,也可能不会。在这里需要保持灵活。IF confirmed, a breakout would target a minimum chart projection of nearly ~$90k Bitcoin (almost +35% from current levels). But if history is a guide, stay open-minded as it could be even higher than that.
如果确认,突破将目标至少达到近$90,000 的比特币(几乎比当前水平上涨 35%)。但如果历史能够提供指导,保持开放的心态,因为它可能会更高。My focus is exclusively on Bitcoin here — although, imagine the euphoria this would spark in Alt-coins, Meme-coins and even Meme Stocks (GME?) — although these aren’t things I would trade necessarily, it’s important to be aware of the speculative implications potentially in play here (i.e. don’t be Short, to say the least).
我在这里的重点完全是比特币——然而,想象一下这会在山寨币、迷因币甚至迷因股票(GME?)中引发的狂热——虽然这些不一定是我会交易的东西,但了解这里可能存在的投机影响是很重要的(即,至少不要做空)。
Further, some interesting data-points on Bitcoin at this time:
此外,关于比特币的一些有趣数据点:
“MVRV z-score shows the market value's relative position to realized value. MVRV going high means Bitcoin is overvalued; going low means undervalued.” (source: MacroMicro)
“MVRV z-score 显示市场价值相对于实现价值的位置。MVRV 上升意味着比特币被高估;下降则意味着被低估。” (source: MacroMicro)This metric suggests Bitcoin remains on the lower end of its historical valuation, despite being near its highs — i.e. most of the excess since 2021 has been unwound.
这一指标表明,比特币仍处于其历史估值的低端,尽管接近其高点 — 即 自 2021 年以来的大部分过剩已经被消化。Below, red/green horizontal lines & red box annotations are mine for reference:
下面,红色/绿色水平线和红色框注释是我用作参考的:
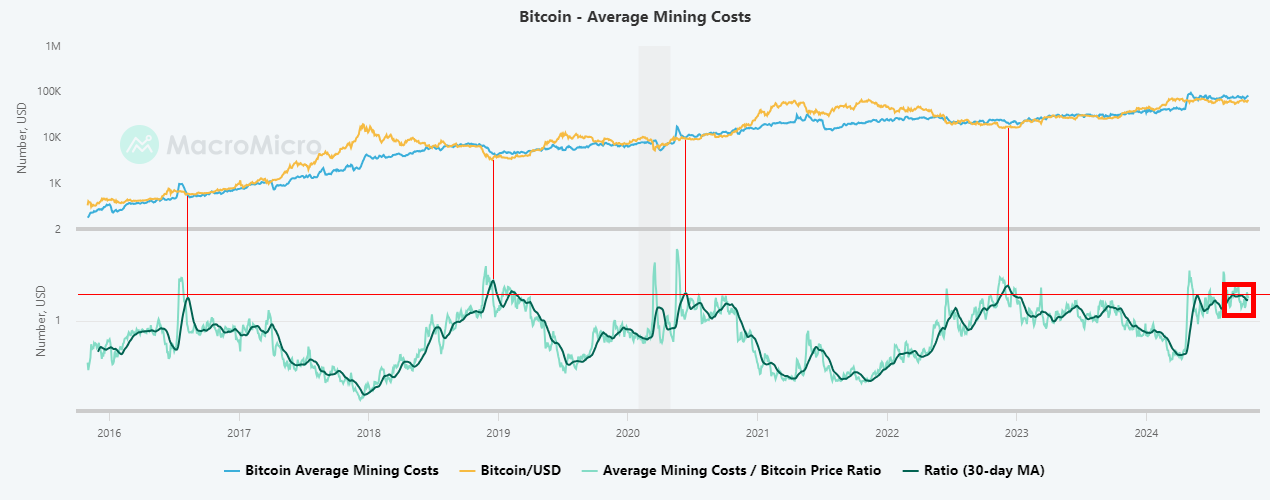
In addition, Bitcoin mining costs are extremely high right now:
此外,比特币挖矿成本目前非常高
“Through observing consumption of electricity and daily issuance of bitcoin, provided by Cambridge University, we can find out the average mining costs of bitcoin. When mining costs are lower than bitcoin's market value, more miners will join. When mining costs are higher than miner's revenue, number of miners will decrease.” (source: MacroMicro)
“通过观察剑桥大学提供的电力消耗和每日比特币发行,我们可以找出比特币的平均挖矿成本。当挖矿成本低于比特币的市场价值时,会有更多的矿工加入。当挖矿成本高于矿工收入时,矿工数量将减少。” (source: MacroMicro)Right now it costs 22% more to mine a Bitcoin than it can be sold for.
现在挖掘一个比特币的成本比其售价高 22%。This reduces the number of miners and removes Bitcoin supply at the margin. The recent halving was an important factor in this.
这减少了矿工数量,并在边际上减少了比特币供应。最近的减半是这一点的重要因素。Historically, when mining costs were this high, Bitcoin prices were near a bottom (vertical lines I’ve added below) — and forward 12-24 month returns were essentially “excellent”.
历史上,当采矿成本如此高时,比特币价格接近底部(我在下面添加的垂直线)——并且未来 12-24 个月的回报几乎是“优秀”的。Could history repeat again?
历史会重演吗?
SUMMARY 总结
IF Weekly momentum Buy signals are confirmed, Bitcoin has the potential to launch a new, Major multi-month uptrend.
如果周度动量买入信号得到确认,比特币有潜力启动新的主要多个月上升趋势。
It makes me wonder (1) “what’s the driver?” for such a move, and (2) what would Asset classes such as Stocks, Bonds, Precious Metals and Currencies be doing in sympathy?
这让我想知道(1)“是什么驱动因素?”促成这样的举动,以及(2)股票、债券、贵金属和货币等资产类别将会如何反应?
It’s possible we’ll find out soon — as Markets begin to bet on the approaching U.S. Election, and everything that comes after.
我们可能很快就会知道——随着市场开始押注即将到来的美国选举以及其后的所有事情。
STEP AWAY FROM THE DARKNESS
远离黑暗
On team DEFENSE: 在团队 DEFENSE:
Moving to possibly my biggest concern for U.S. Stocks heading into 2025 and beyond…
转向我对美国股票在 2025 年及以后可能最大的担忧……
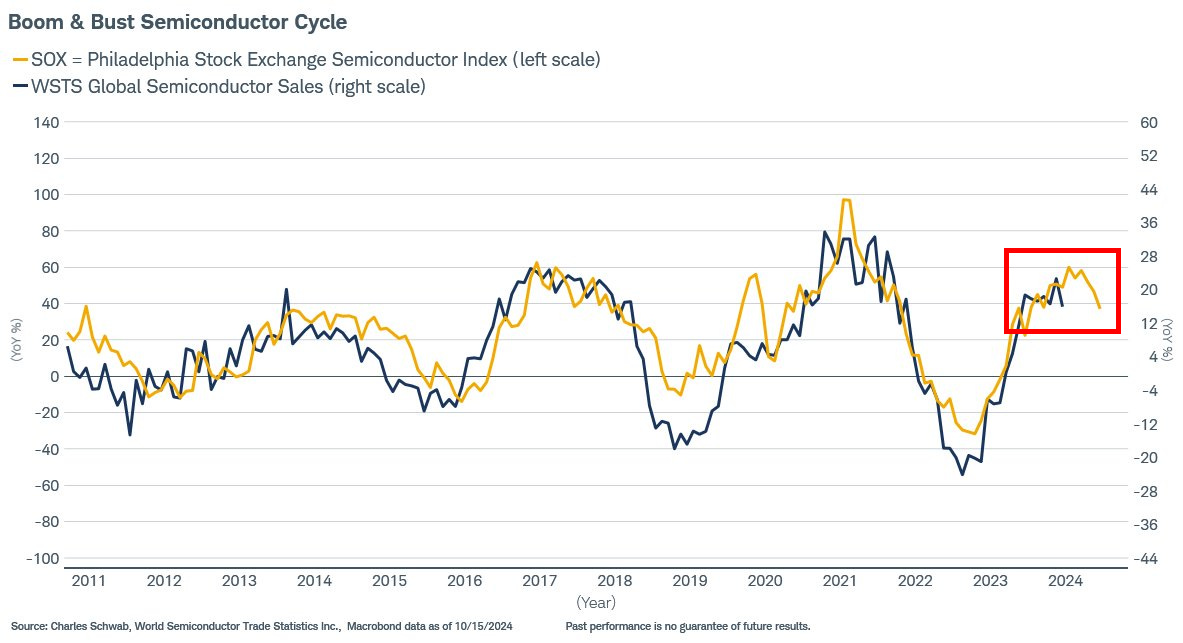
Since the beginning of time, Semiconductors have been a cyclical industry:
自古以来,半导体行业一直是一个周期性行业:
This chart from Jeff Kleintop at Schwab (@JeffreyKleintop on Twitter), shows the historical swings in the group.
这张图表来自于施华洛的杰夫·克莱因托普(@JeffreyKleintop 在 Twitter 上),展示了该组的历史波动。The chart is aptly named… “Boom & Bust Semiconductor Cycle”.
图表恰当地命名为……“繁荣与衰退半导体周期”。The current capex cycle has lasted roughly the same as every cycle before it.
目前的资本支出周期大致与之前的每个周期持续的时间相同。Are Sales rolling over again — or has AI changed everything?
销售再次下滑了吗——还是说人工智能改变了一切?It’s a Trillion-dollar question — and a timely one — as just yesterday, one of the leading suppliers (ASML) had one of its largest one-day declines in history, after reporting a 50% drop in bookings.
这是一个万亿美元的问题——也是一个恰逢其时的问题——就在昨天,领先供应商之一(ASML)在报告预订量下降 50%后,出现了历史上最大的一天跌幅之一。I don’t think yesterday’s news was a one-off — if history is a guide, odds are high that the next 12+ months lead to a cyclical downswing for the group.
我认为昨天的新闻不是一次性的——如果历史可以作为指导,那么接下来的 12 个月以上很可能会导致这个群体的周期性下行。Historically, Semiconductors were among the worst Stock groups to own in a cyclical downswing — and worse, after an epic 2-year run they now make up a significant portion of U.S. market cap.
历史上,半导体在周期性下滑中属于最糟糕的股票群体之一——更糟的是,在经历了史诗般的两年涨幅后,它们现在占据了美国市值的一个重要部分。In summary — where the Semis go, the S&P / NDX will likely follow.
总之——半导体走到哪里,标普/纳斯达克可能会紧随其后。
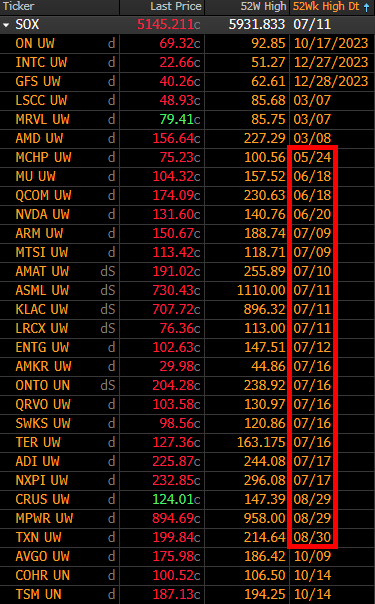
Even worse — like most Semiconductor names ASML topped more than 3 months ago.
更糟的是——像大多数半导体公司一样,ASML 在三个月前达到高峰。
Note that most are still in double-digit drawdowns, despite new highs almost every day in the broader market Indexes.
请注意,尽管大盘指数几乎每天都创下新高,但大多数仍处于双位数的回调中。
SOX’s Daily chart needs more development for me to get outright Bearish / Short:
SOX 的日线图需要更多的发展,我才能完全看空/做空:
The key MAs are still rising, and Daily momentum is still in an uptrend for now.
主要移动平均线仍在上升,日线动量目前仍处于上升趋势。Nevertheless, yesterday’s reversal/failure at key resistance MAY be the initial sign of a bigger turn worth monitoring.
尽管如此,昨天在关键阻力位的反转/失败可能是值得关注的更大转折的初步迹象。This is especially true with earnings season approaching — and it remains to be seen how many more Semis have outlook “surprises” in store.
随着财报季的临近,这一点尤其如此——而我们仍需观察还有多少半导体公司会有“意外”的展望。
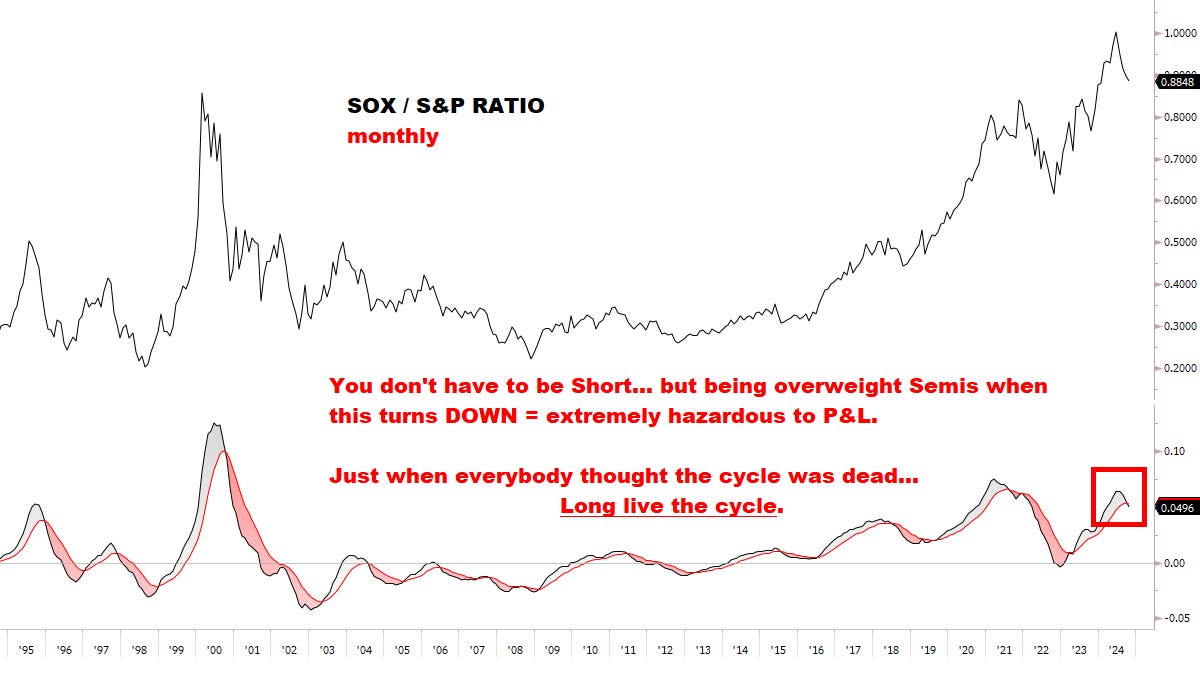
The relative chart continues to deteriorate — and may have already turned.
相对图表继续恶化——可能已经转变。
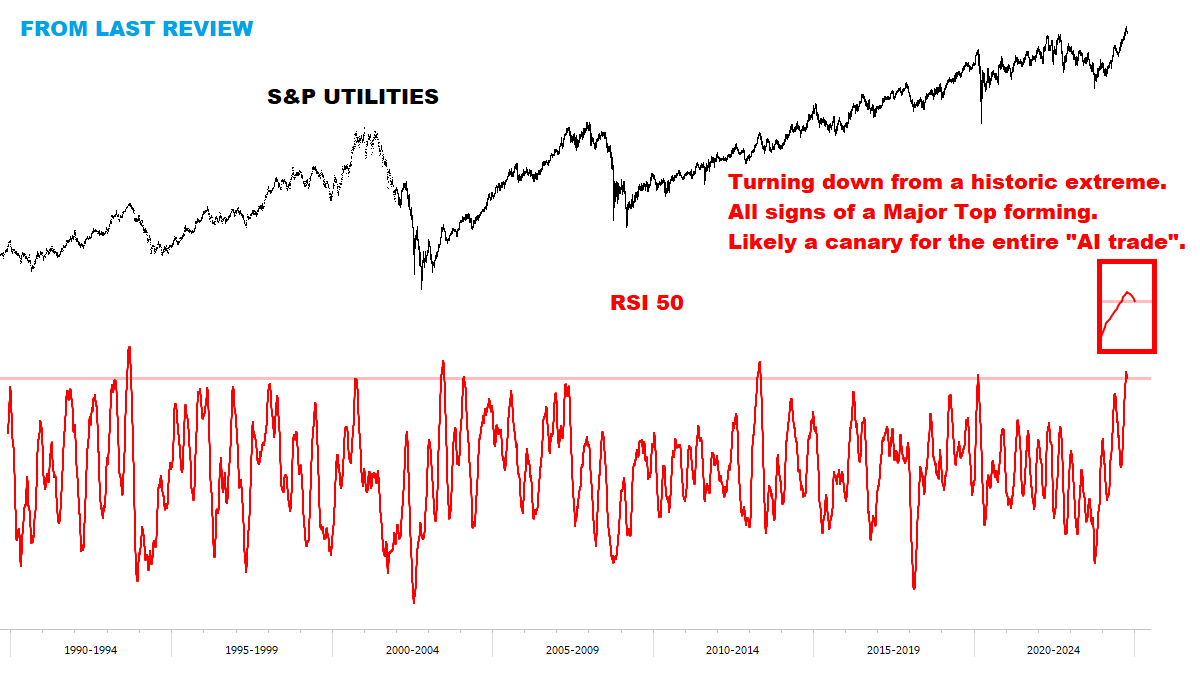
Lastly, even the Utilities “AI TRADE” may have topped — as I flagged recently:
最后,连公用事业的“AI 交易”也可能达到了顶峰——正如我最近提到的:
SUMMARY 总结
First the clear question — “how can you be Bullish Bitcoin and Bearish Semis — aren’t they highly correlated”?
首先明确的问题是——“你怎么可以看涨比特币却看跌半导体——它们不是高度相关吗”?
Answer: 答案:
I’m Bullish/Bearish two markets that have the potential to go UP/DOWN respectively, based on Trend momentum on the cusp of confirming Buy/Sell signals on multiple time frames for each market individually.
我对两个市场持看涨/看跌态度,基于趋势动量即将确认每个市场个体在多个时间框架上的买入/卖出信号,有潜力上涨/下跌。Both markets have potentially clean signals and multi-month chart structures developing… so my goal is to listen to the market, follow the signals and act accordingly.
两个市场都有潜在的清晰信号和多月图表结构正在形成……所以我的目标是倾听市场,遵循信号并相应行动。Lastly on the topic of correlations — I ran various historical studies and was stunned by some of the results:
最后关于相关性的主题——我进行了各种历史研究,对一些结果感到震惊:Looking back to inception, Bitcoin has traded with a 90-day correlation of LESS THAN 0.10 to the SOX for slightly more than 50% of all of Bitcoin’s history. That’s extremely low.
回顾其诞生,Bitcoin 在超过 50%的历史中,与 SOX 的 90 天相关性低于 0.10。这是极其低的。Since January 2020, the 3-month, 6-month and 1-year correlations of Bitcoin vs. SOX have averaged in the low 0.30s. Not that high either.
自 2020 年 1 月以来,比特币与 SOX 的 3 个月、6 个月和 1 年相关性平均在 0.30 低位,也不是很高。
With Semis estimates priced to perfection, could even a small turn trigger major disappointment?
随着半导体预测的价格完美无缺,哪怕是小幅波动也会引发重大的失望吗?
And could Semiconductor Stocks be anticipating a fundamental cyclical downturn, as they anticipated before? Follow the charts, always…
半导体股票是否可能正在预期一场根本性的周期性下滑,就像它们之前预期的那样?始终关注图表……
Playing DEFENSE here may be the best approach — at least until the odds turn back in favor.
在这里采取防守策略可能是最好的方法——至少在情况转向有利之前。
Thanks for reading. 谢谢阅读。
Onwards and upwards, -MC 向前走,向上走,-MC








I dont agree regarding semis going down and taking the market with it. Hard to see market down when financials are ATH (and other crap sectors too), so my view is that semis are going up (have my own technical analysis and like it going up). BUT thats why I pay for MC research, to have another point of view, a professional one that challenge my own. MC make me think, that theres another view and maybe I'm wrong, so have to be alert and awake!
Excellent new series MC! Much appreciated.