Datadog - Web application's Monitoring
You have no instance yet for this lesson.
Launching new machine may take time.
Datadog
VII - Web application monitoring
a - Introduction
Application monitoring is one of the most important elements of any system design. It helps us examine and analyze our servers for operations-related tasks such as availability, metrics, containers, running processes, performance, networks, logs, traces, security and so on. Since the health of the application depends to a large extent on the health of the underlying server, it's essential to use good server monitoring tools, which give us the capabilities mentioned.
The DataDog Application Performance Monitoring (APM) agent is a technology that provides end-to-end distributed monitoring from browser and mobile applications to databases and individual lines of code. By seamlessly correlating distributed traces with frontend and backend data, this technology monitors service dependencies and health metrics, reduces latency and eliminates errors.
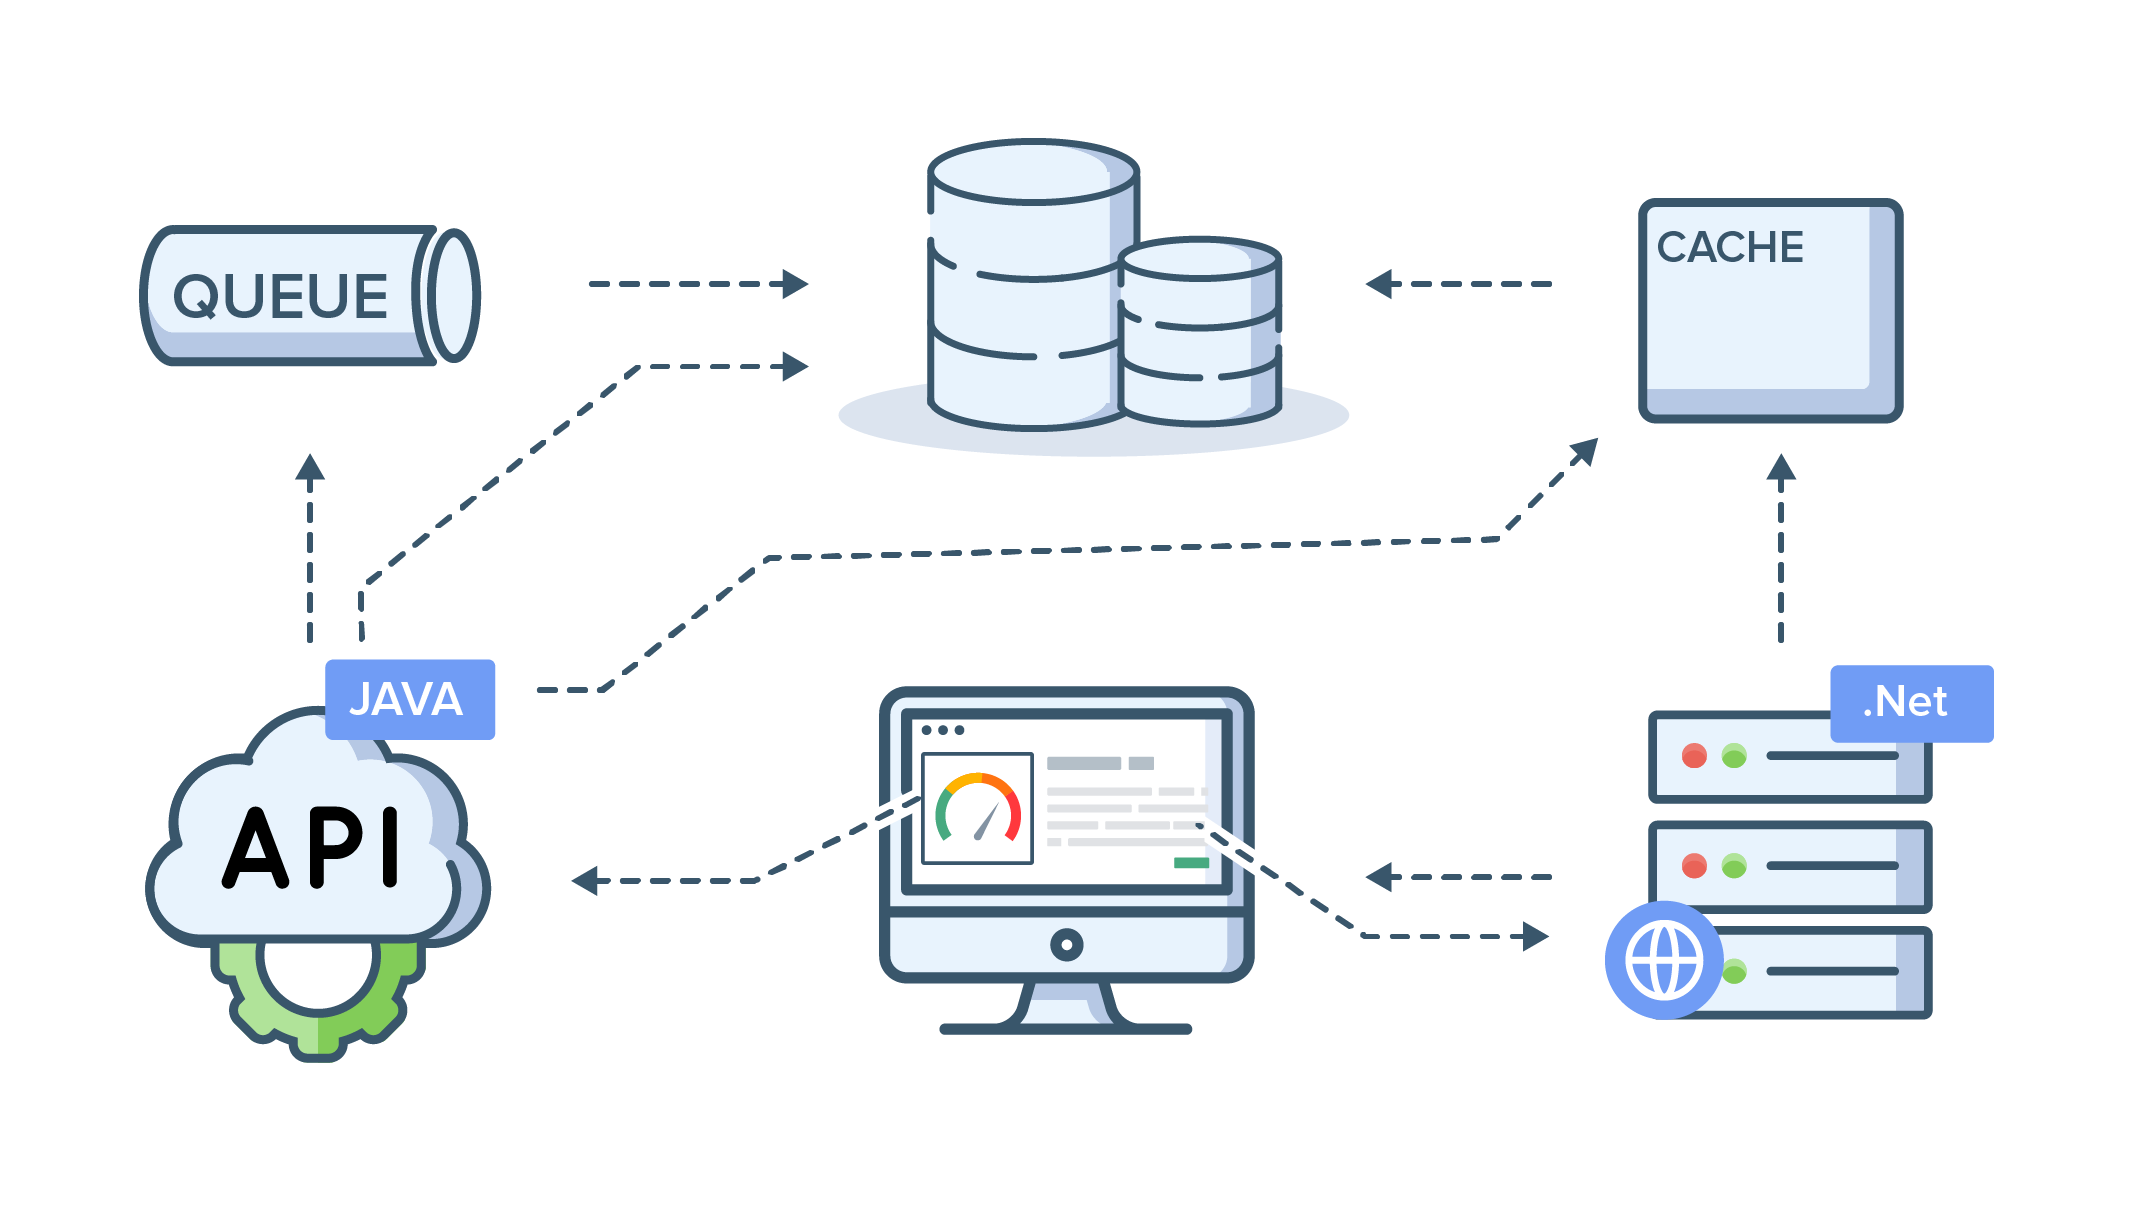
It's very common these days for organizations to want to create native cloud solutions that are easy to deploy on any cloud platform. By evolving towards a microservices architecture, the biggest change is that the monolithic application has been split into several independent processes (or services), as a result, a method call between software modules now becomes a remote procedure call passing through several services.
The MicroServices are the most important tools in this process.
Microservices are an architectural style that structures an application as a collection of small, autonomous services, modeled around a business domain. For each component, different services are created to separate responsibility.
b - What is distributed tracing?
Distributed tracing, also known as distributed application tracing, is a powerful tool for IT and DevOps teams. It is primarily used to monitor microservices-based applications.
Let's take a closer look at what it involves.
Understanding tracing
This method goes beyond simple monitoring. It helps locate faults and identify the causes of poor performance. It requires developers to add special instrumentation to the application code to provide the data needed for performance analysis and debugging.
This method goes beyond simple monitoring.
Query tracking and metrics
Query tracking is a fundamental practice in software engineering. Using portions of instrumentation code, developers can track and obtain metrics on various essential behaviors within the application code. It's a lot like application performance management (APM), but with a focus on tracking the individual requests that pass through the system, creating a "picture" (mapping) of the software's behavior.
Request tracking faces serious challenges when used in distributed software architectures with multiple functional modules or services. Services evolve independently, resulting in numerous iterations of the same function, potentially running on different host systems or even different environments.
Tracking in distributed environments
Distributed tracing makes sense in environments where services operate independently. In these contexts, tracking a single request can prove complex due to the many iterations of the same function spread across different systems or environments.
However, distributed tracing overcomes these challenges by tracking every request across every module or service. This gives application architects a detailed view of the performance of each function, facilitating the rapid identification and resolution of problems, such as a high latency introduced by a specific instance of a function.
c - Traces and extents
Distributed tracing relies on two key concepts: traces and extents.
A trace symbolizes the integral path taken by a request through all the services or components of a distributed system. Each trace is identified by a unique trace ID, used by tracing tools to organize, filter and retrieve specific traces.
Each trace is broken down into several extents, also known as segments. These extents represent the different operations or activities carried out within individual system services or components. Each of them has a unique extent ID and can carry specific metadata or annotations. The set of extents provides a complete view of the query path, enabling the source of a potential problem to be located.
To track a request through each extent, developers and operations staff can correlate each extent to a specific service instance and even identify the physical host system on which each extent is executed.
Trace data is not processed in real time. It is generated and stored locally before being transferred to a central location for analysis, a process similar to modern event logging and other metrics-gathering activities.
The trace data is not processed in real time.
It's worth noting that distributed tracing aims to represent the complete journey of a query, thus providing an end-to-end assessment of performance, from the point of entry at the front-end to the delivery of final results. Unlike some approaches, it generally does not apply localized tracking, focusing instead on global and integral tracking.
d - Advantages and limitations of distributed tracking
This type of tracking is often paralleled by APM (Application Performance Management) technologies. APM tools monitor and manage the performance and availability of software applications, providing data on performance problems and issuing alerts if established minimum service levels are not met.
They offer metrics illustrating the end-user experience, for example average response time during a peak of activity. These tools also highlight the resources used by the application, helping to identify potential bottlenecks. However, they are not directly connected to the application's source code.
Distributed tracing is also compared to event logging. Although both processes require a certain level of instrumentation to monitor and report key software activities, they differ in several respects. Logging records high-level information about events, such as when a predefined threshold is exceeded for a given resource.
It is designed to prevent the occurrence of events that could have a significant impact on the software.
It aims to avoid redundancy and often follows a standardized format to facilitate data aggregation and analysis. In contrast, request tracking can harvest a large amount of low-level information in a variety of formats.
Distributed tracing is particularly suited to debugging and monitoring contemporary distributed software architectures, including microservices. It proves indispensable when requests need to transit across multiple services and systems, or even different sites.
Distributed tracing is the ideal tool for debugging and monitoring contemporary software architectures, including microservices.
It enables precise and detailed identification of problems, facilitating their resolution. Nevertheless, it requires additional instrumentation integrated into the code base in production. In addition, tools dedicated to tracing data search and visualization can be complex to configure and use optimally.
e - Setting up distributed tracing with python
To put distributed tracing into practice with Datadog , we need to retrieve some existing code that will serve as our application. We'll be using Git because the application code can be found on Datascientest's git repository.
git clone https://github.com/datascientest/apm-datadog.git
cd apm-datadog
The repository contains a multiservice Python application preconfigured to run in Docker containers. The sample application is a basic notes application with a REST API for adding and modifying data.
Here we'll use Docker to containerize our application and Docker-compose for its deployment. We will, however, use a connection between our deployment with Docker-compose and our agent installed directly on the Datascientest physical machine so that it (our application) can send our traces to our Datadog instance via this Datadog linux agent.
Let's have a look at the files retrieved from the apm-datadog repository from the Datascientest Github account.
docker-compose.yml: This allows us to deploy our application.
cat docker-compose.yml
Output display:
# Fall Lewis YOMBA - fall-lewis.y@datascientest.com
#
# This product includes software developed at Datascientest (https://www.datascientest.com/)
# Copyright 2023 Fall lewis.
version: "3"
services:
  db: # the datasbase service
    container_name: test_postgres
    image: "postgres"
    environment:
      POSTGRES_PASSWORD: password
      POSTGRES_DB: testdb
      POSTGRES_HOST_AUTH_METHOD: trust
  notes_app: # the note service
    container_name: notes
    restart: always
    build:
      context: . #
      dockerfile: Dockerfile.notes # the dockerfile to build the note image
    ports:
      - "8080:8080"
    depends_on:
      - db
    extra_hosts: # Linux only configuration
      - host.docker.internal:host-gateway" # Linux only configuration
    environment:
      - DB_HOST=test_postgres # References the Postgres container
      - CALENDAR_HOST=calendar # References the calendar container
      - DD_AGENT_HOST=datadog
  calendar_app: # the calendar service
    container_name: calendar
    restart: always
    build:
      context: .
      dockerfile: Dockerfile.calendar # the dockerfile to build the calendar image
    ports:
      - "9090:9090"
  datadog: # the datadog service
    container_name: dd-agent
    image: "gcr.io/datadoghq/agent:latest"
    environment:
        - DD_API_KEY=xxxxxxxxxxxxxxxxxxxxxxxxxxxxxxx
        - DD_SITE=us5.datadoghq.com # Default. Change to eu.datadoghq.com, us3.datadoghq.com, us5.datadoghq.com as appropriate for your org
        - DD_APM_ENABLED=true # Enable APM
    volumes:
        - /var/run/docker.sock:/var/run/docker.sock:ro
        - /proc/:/host/proc/:ro
        - /sys/fs/cgroup/:/host/sys/fs/cgroup:ro
This file allows us to declare 3 services that we will run:
The first service is
dbwhich allows us to deploy a PostgreSQL database in order to store the data that will be used by thenotesandcalendarservices which are two other services deployed by Docker-compose.We have the final
Datadogservice, which will be the agent used to send traces to our Datadog instance. We pass it connection parameters through environment variables such as the api key with fieldDD_API_KEY, the Datadog site with fieldDD_SITEor whether the APM module is enabled on the agent with fieldDD_APM_ENABLEDto which we pass the valuetrue.We allow the Datadog service to mount read-only volumes (
rofor Read Only) on our Datascientest machine so that it can communicate with the Docker socket thanks to the line- /var/run/docker.sock:/var/run/docker.sock:ro. We do the same with the processes of thedatadog serviceand the processes of our Datascientest machine with the line- /proc/:/host/proc/:ro.
We also do the same with the line /sys/fs/cgroup/:/host/sys/fs/cgroup:ro which allows us to mount the CGROUP of the Datascientest machine within our Datadog service.
In the notes_app service section, we have the DD_AGENT_HOST environment variable which allows us to specify the location in which we'll find the Datadog agent, which is none other than the local Docker instance:
environment:
  - DD_AGENT_HOST=host.docker.internal
The constraint under Linux requires us to also add a extra_host field with the value host.docker.internal to our notes-app service to enable communication over Docker's internal network.
Let's make sure our agent is configured to receive trace data from containers. Let's open the configuration file and make sure that the apm_config: field is uncommented (line 1158 of the file) and that the field below it called enabled is set to true.
Let's also make sure that the apm_non_local_traffic field is uncommented and set to true (line 1184 of the file).
sudo nano /etc/datadog-agent/datadog.yaml
ddtrace is the library we'll need to trace our various applications. It is available for many languages such as Python, PHP, Ruby, Go, Java , etc. Our applications are coded in Python using the well-known Flask framework, which implies that we can install it with pip3 which is therefore our application dependency manager.
For this, we have a file called requirements.txt in which we've declared all the application dependencies we'll need in order to trace our applications. We can see the contents of this file as follows:
cat requirements.txt
Output display:
flask==2.2.2
psycopg2-binary==2.9.6
requests==2.28.1
ddtrace
We need to restart the Datadog Agent on our machine:
sudo systemctl restart datadog-agent
We can now execute the command to run our Docker-compose stack:
docker-compose up -d
output display:
Creating dd-agent ... done
Creating calendar ... done
Creating test_postgres ... done
Creating notes ... done
We can also check that our containers are running:
docker ps
Output display:
CONTAINER ID IMAGE COMMAND CREATED STATUS PORTS NAMES
df29de22722d apm-datadog_notes_app "python -m notes_app..."   58 seconds Up 58 seconds 0.0.0.0:8080->8080/tcp, :::8080->8080/tcp notes
7bcd40630fce gcr.io/datadoghq/agent:latest "/bin/entrypoint.sh" 59 seconds Up 59 seconds (healthy) 8125/udp, 8126/tcp dd-agent
15d9bd218d77 postgres "docker-entrypoint.s..." 59 seconds Up 59 seconds 5432/tcp test_postgres
ac0c459978a3 apm-datadog_calendar_app "python -m calendar_..."   59 seconds Up 58 seconds 0.0.0.0:9090->9090/tcp, :::9090->9090/tcp calendar
b92d0210fa8c datascientest/fastapi:1.0.0 "/bin/sh -c 'uvicorn..."   59 seconds Up 12 days 0.0.0.0:8000->8000/tcp, :::8000->8000/tcp fastapi_sentiment
We can then execute several commands just to send a few traces to our Datadog instance. Let's already run the query that allows us to retrieve the list of notes on the /notes path:
curl -X GET 'localhost:8080/notes'
Output display:
{}
Let's then execute a POST command that allows us to fill in a Datascientest note:
curl -X POST 'localhost:8080/notes?desc=Datascientest'`
Output display:
(1, Datascientest)
We can then check the list of our notes:
curl -X GET 'localhost:8080/notes'
Output display:
{
  "1": "datascientest"
}
We can add a new note:
curl -X POST 'localhost:8080/notes?desc=DevUniversity'`
Output display:
(2, DevUniversity)
We can once again check the list of our notes:
curl -X GET 'localhost:8080/notes'
Output display:
{
  "1": "Datascientest",
  "2": "DevUniversity"
}
We can add a new note:
curl -X POST 'localhost:8080/notes?desc=CyberUniversity'`
Output display:
(3, CyberUniversity)
We can once again check the list of our notes:
curl -X GET 'localhost:8080/notes'
Output display:
{
  "1": "Datascientest",
  "2": "CyberUniversity",
  "3": "DevUniversity"
}
We can add a new note:
curl -X POST 'localhost:8080/notes?desc=Datadog'`
Output display:
(4, Datadog)
We can once again check the list of our notes:
curl -X GET 'localhost:8080/notes'
Output display:
{
  "1": "Datascientest",
  "2": "CyberUniversity",
  "3": "DevUniversity",
  "4": "Datadog"
}
We can modify our last entry Datadog with the value Monitoring:
curl -X PUT 'localhost:8080/notes?id=4&desc=Monitoring'`
We can once again check the list of our notes:
curl -X GET 'localhost:8080/notes'
Output display:
{
  "1": "Datascientest",
  "2": "CyberUniversity",
  "3": "DevUniversity",
  "4": "Monitoring"
}
We can now delete our last entry:
curl -X DELETE 'localhost:8080/notes?id=4'`
We can once again check the list of our notes:
curl -X GET 'localhost:8080/notes'
Output display:
{
  "1": "Datascientest",
  "2": "CyberUniversity",
  "3": "DevUniversity"
}
the universal service tags identify services tracked in different versions and deployment environments, so they can be correlated in Datadog, and we can use them to search and filter. The three environment variables used for unified service tagging are DD_SERVICE, DD_ENV and DD_VERSION. They are therefore added as environment variables in the Dockerfile of the notes service:
ENV DD_SERVICE="notes"
ENV DD_ENV="test"
ENV DD_VERSION="1.10.0"
We also add Docker tags that correspond to universal service tags. This also allows you to get Docker metrics once our application is running.
LABEL com.datadoghq.tags.service="notes"
LABEL com.datadoghq.tags.env="dev"
LABEL com.datadoghq.tags.version="0.1.0"
We can verify that our agent is running and sending data to Datadog by accessing the search button.
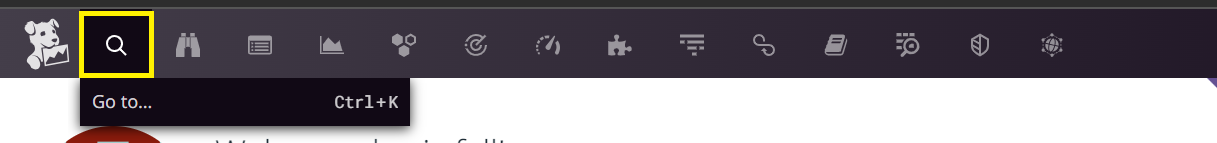
We're going to fill in the Event value in the search field.
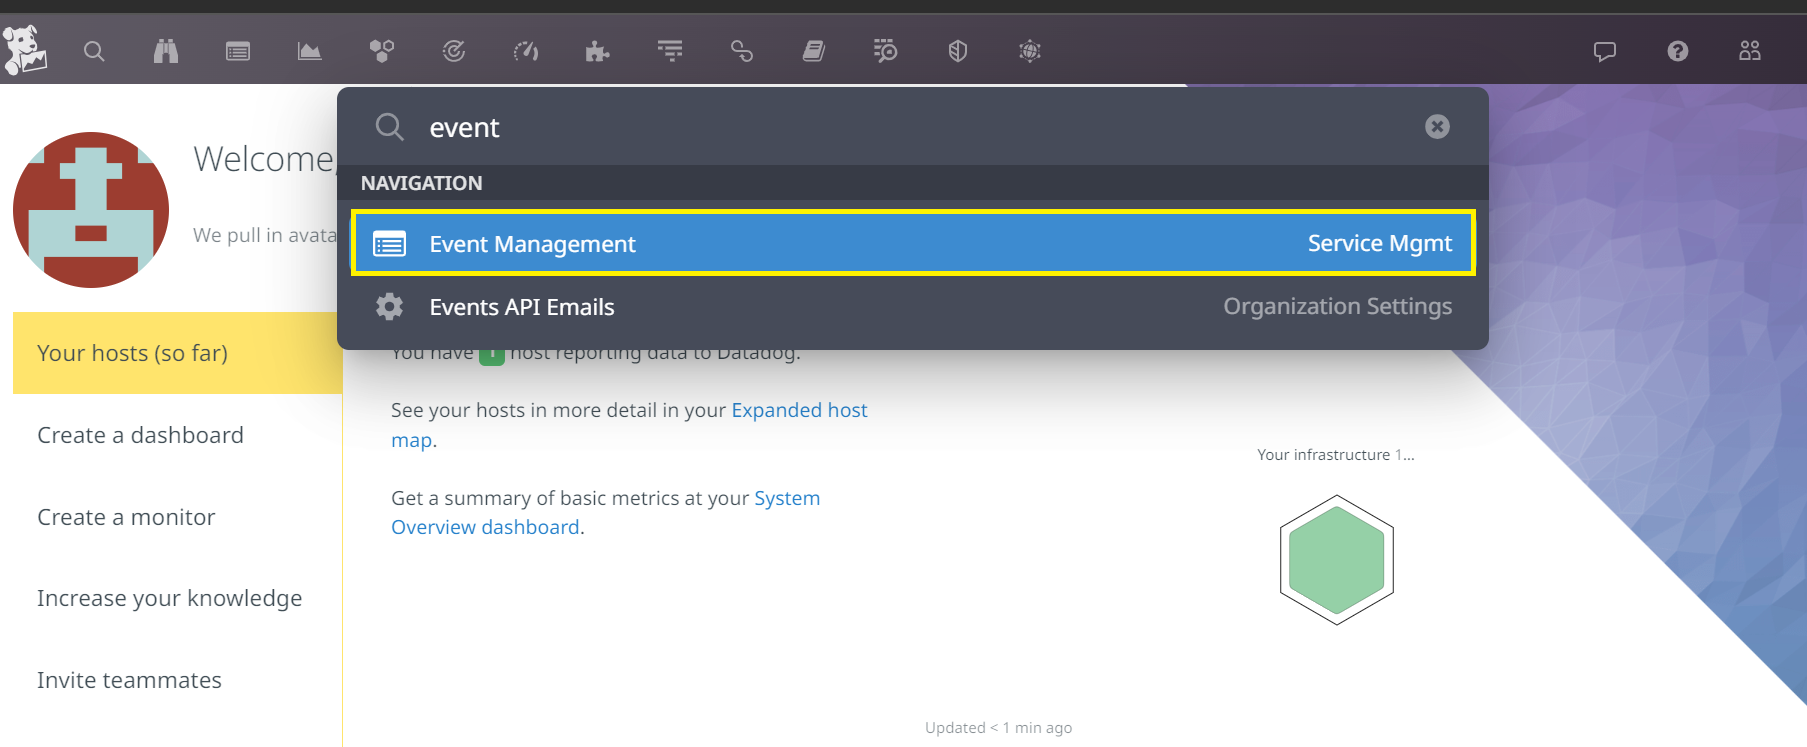
Let's click on the first menu in the results to access the Datadog event explorer.
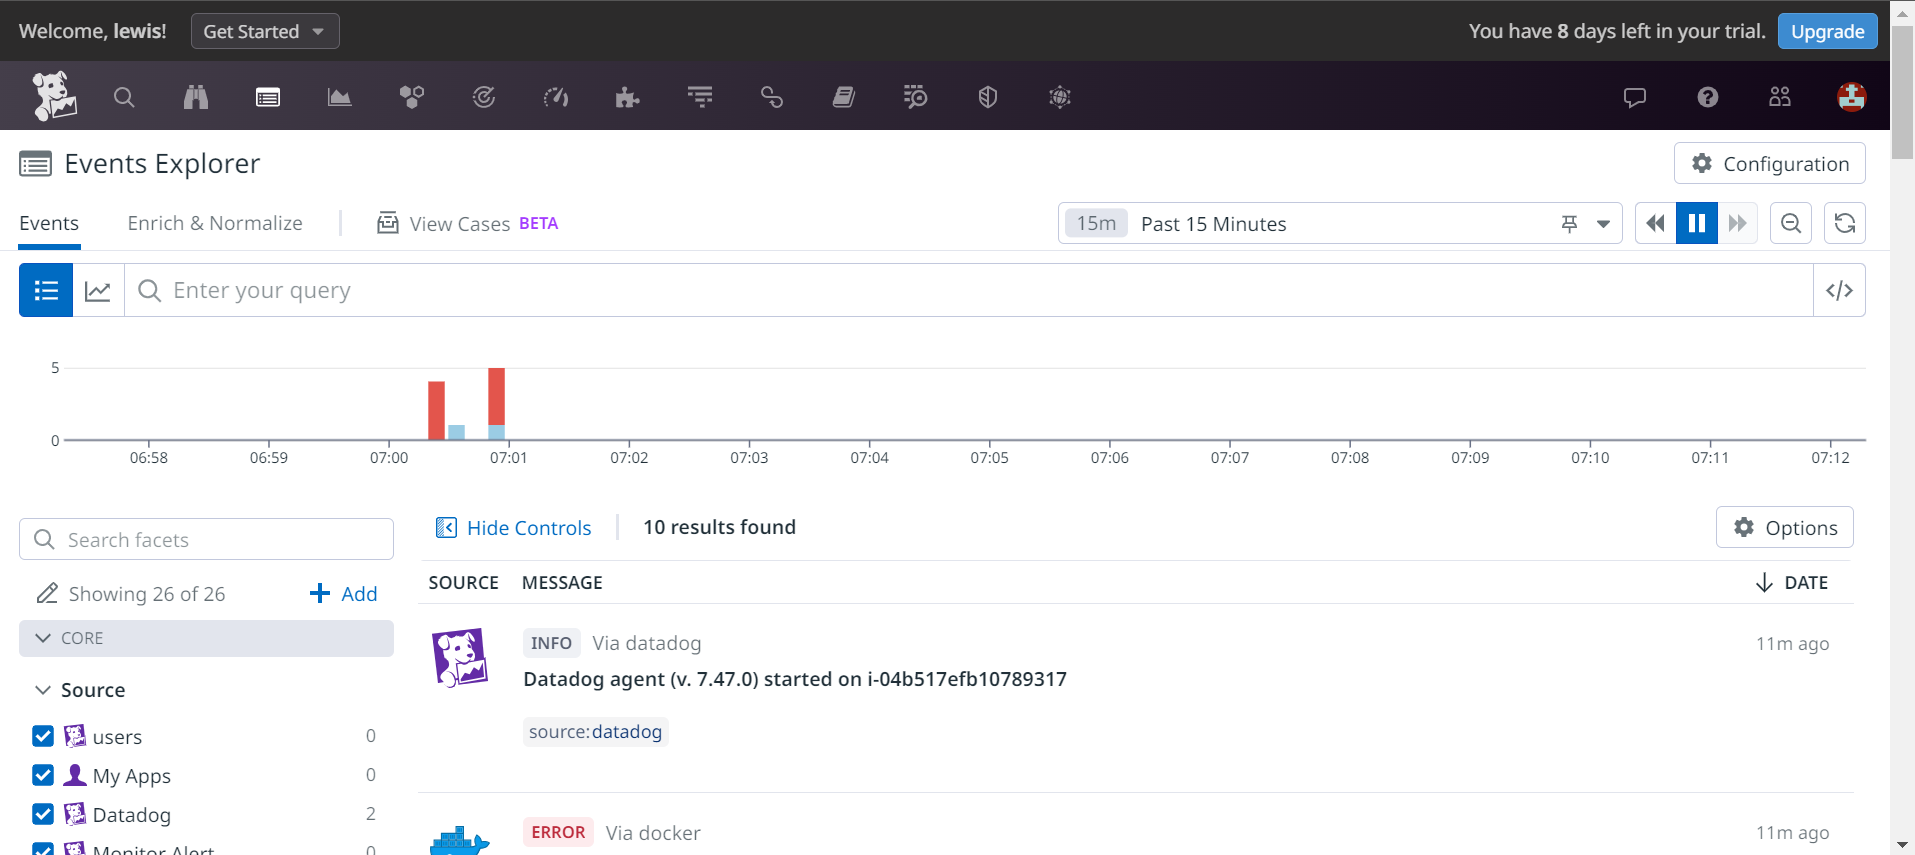
As we can see, events from our machine are indeed sent to the event explorer. All the actions implemented are therefore listened for within our Datadog instance.
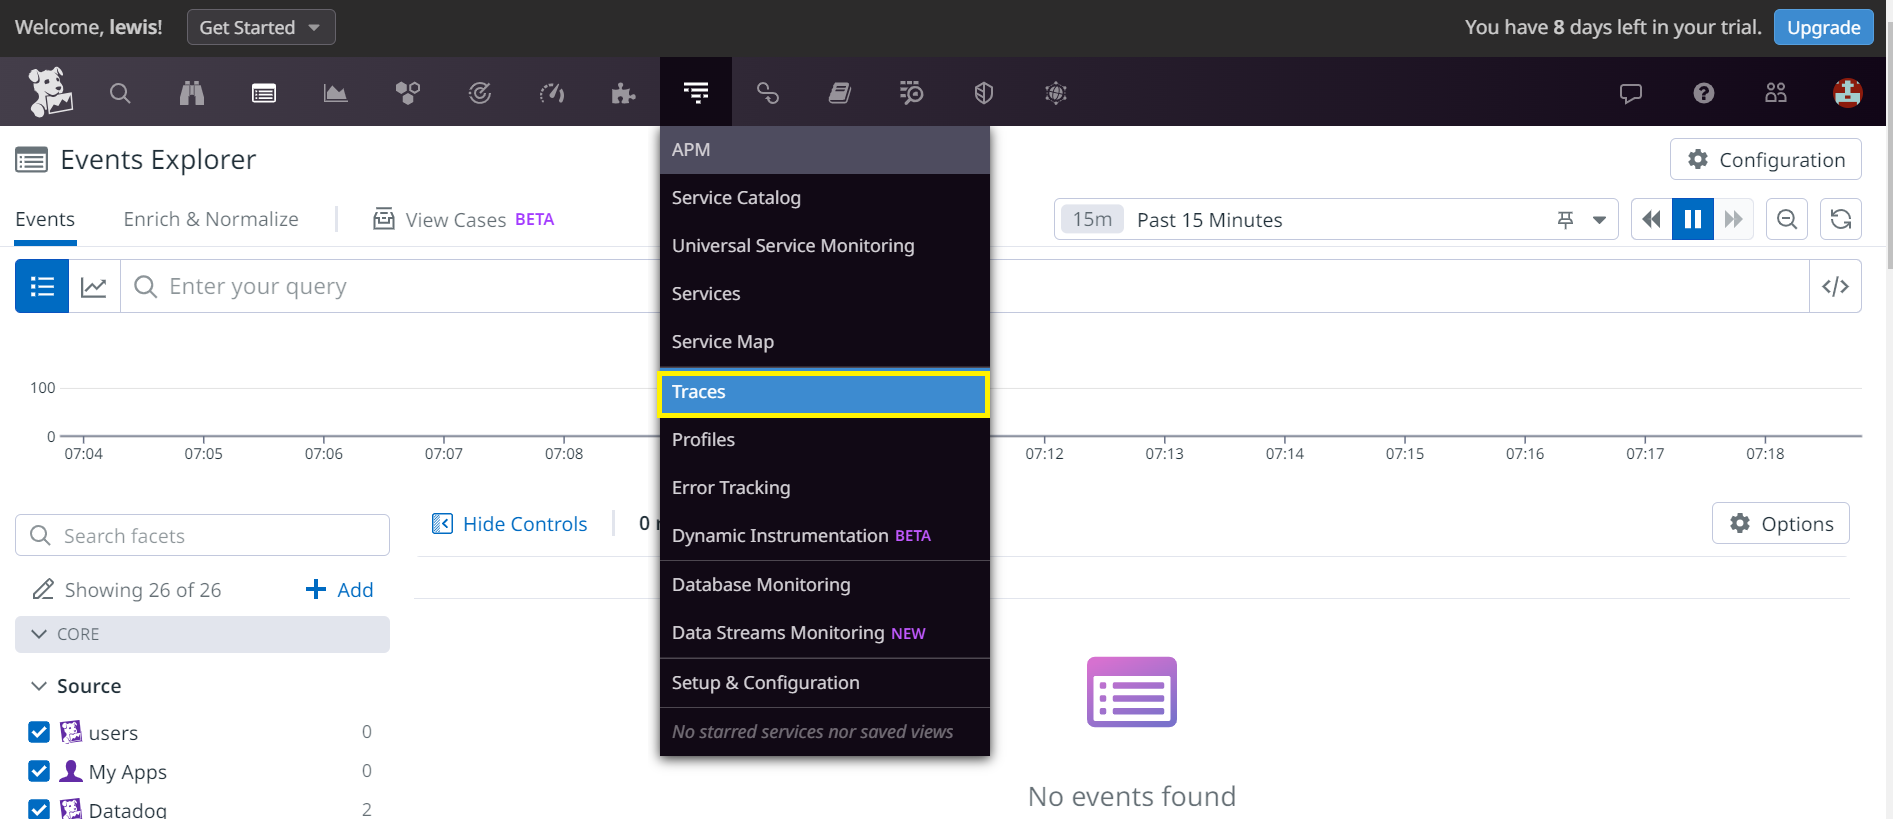
We can therefore connect to the APM menu and the Traces sub-menu to view the various traces sent to our Datadog instance.
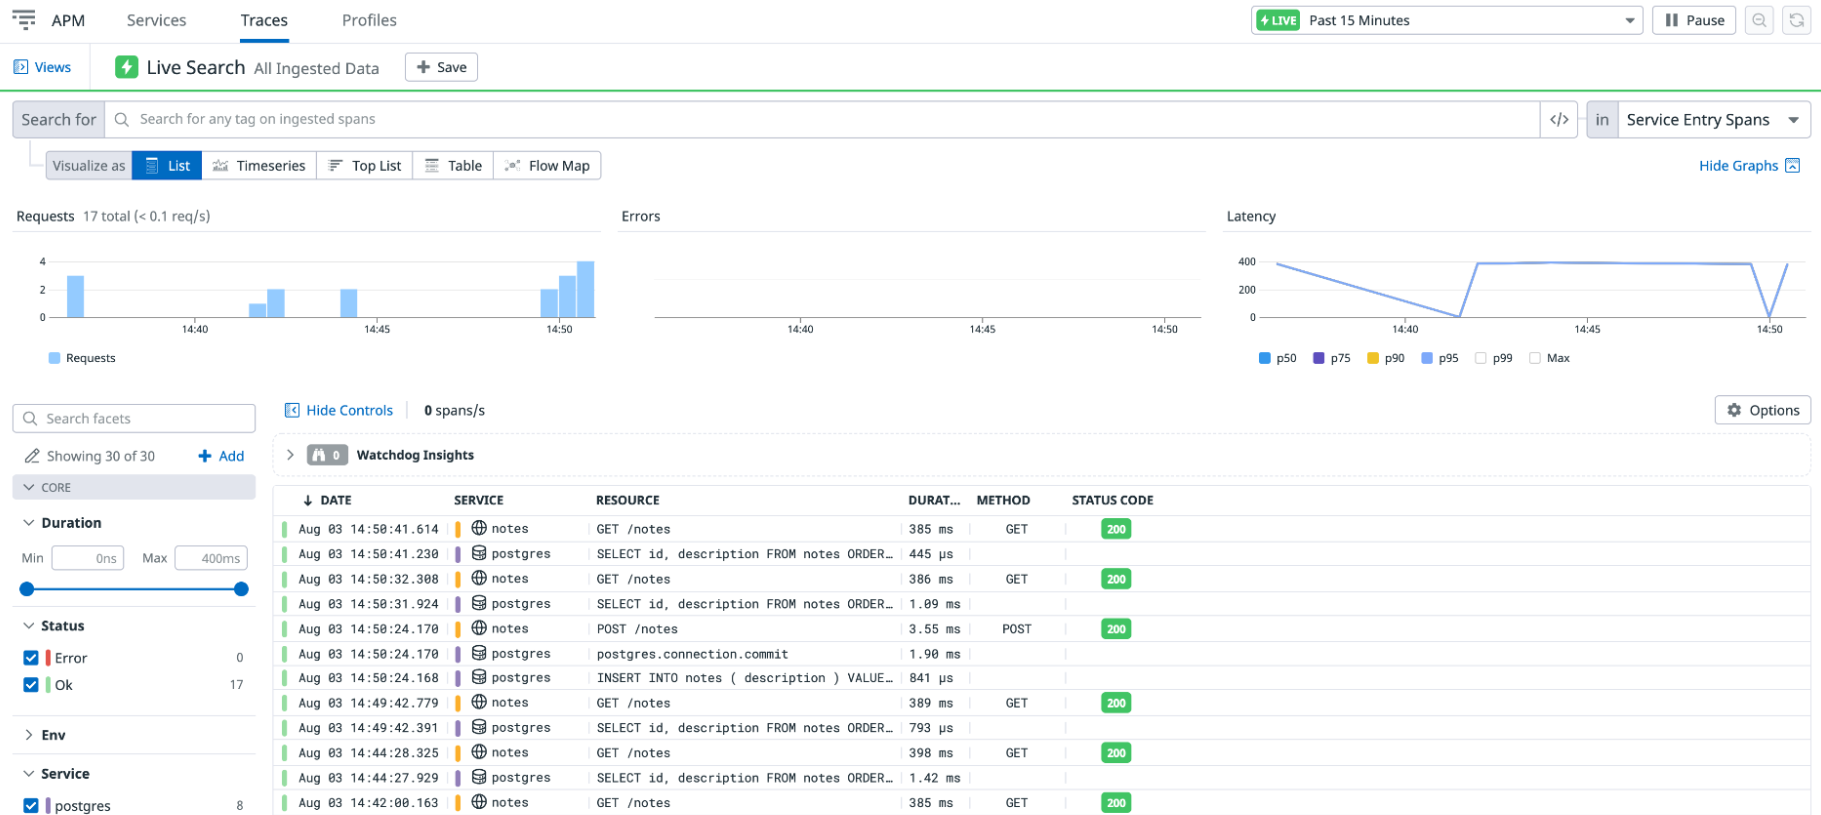
We can see a list of traces corresponding to your API calls:
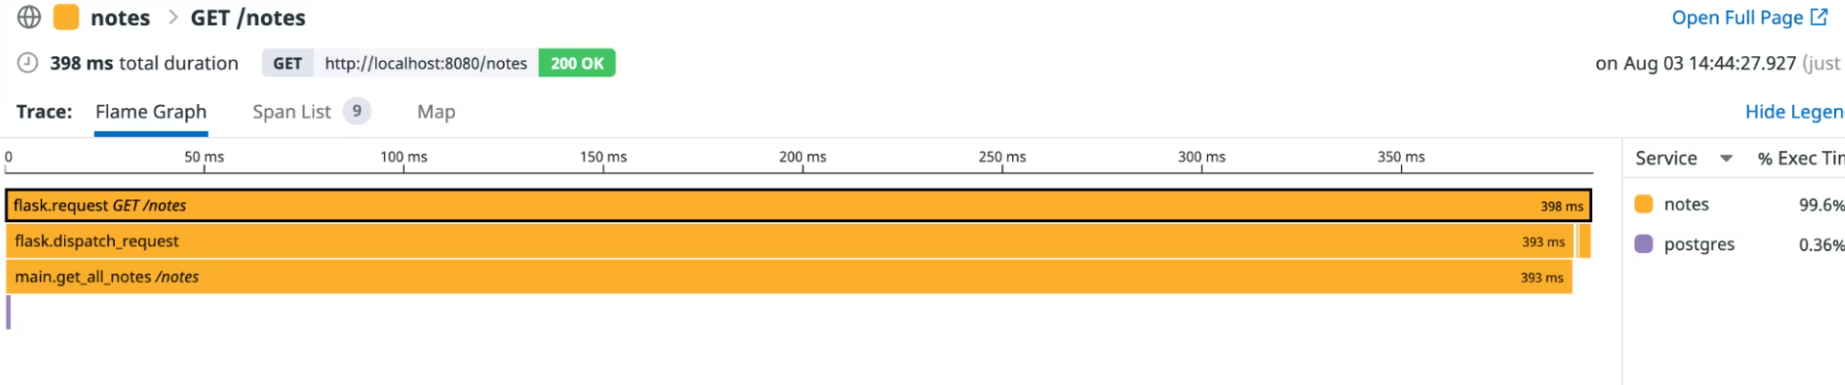
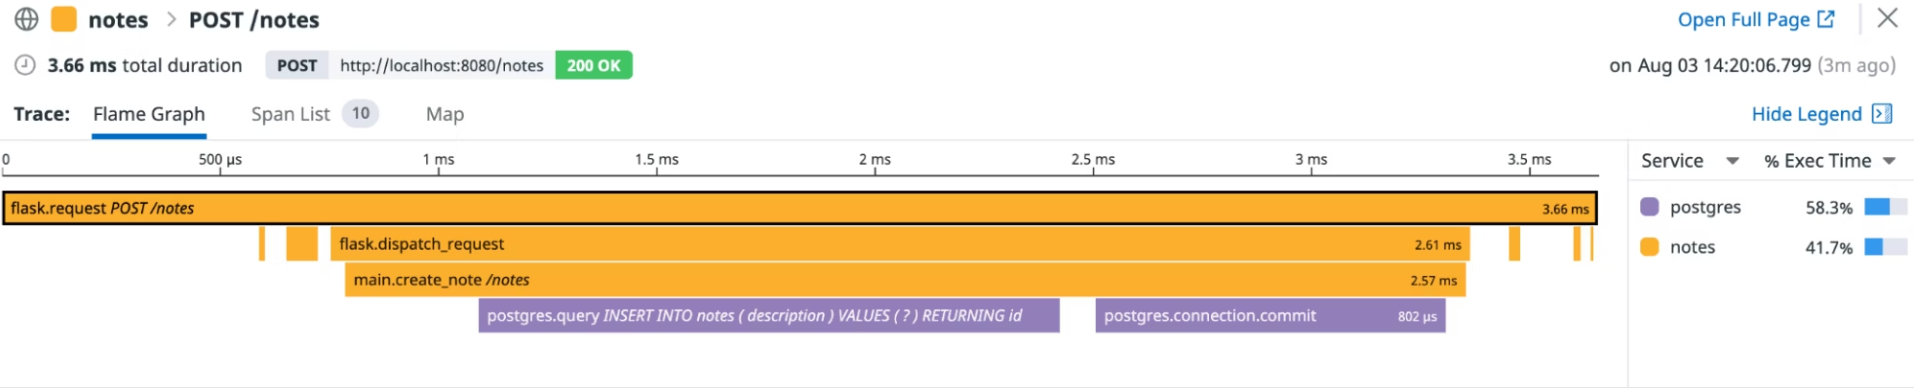
On the Traces page, let's click on a tracePOST /notes to display a graph that shows us the duration of each action and what other actions occurred before an action ended. The bar at the top of the graph corresponds to the duration we selected on the previous screen (in this case, the initial entry point into the Notes application).
The width of a bar indicates the time it took to complete. A bar at a lower depth represents an action that completes within the lifetime of a bar at a higher depth.
The graph for a trace is shown at the bottom of the chart.
The graph for a trace of typePOST is therefore as follows:
Similarly, by clicking on a GET trace, we have the following result: