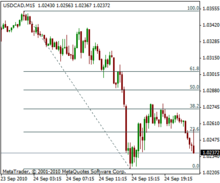
Fibonacci retracement 斐波那契回調

美元/加幣貨幣對上顯示的斐波納契回撤水準。在這種情況下,價格在繼續下跌之前回調了大約 38.2% 的幅度。
In finance, Fibonacci retracement is a method of technical analysis for determining support and resistance levels.[1] It is named after the Fibonacci sequence of numbers,[1] whose ratios provide price levels to which markets tend to retrace a portion of a move, before a trend continues in the original direction.
在金融領域,斐波那契回檔法是一種確定支撐位和阻力位的技術分析方法。 [1] 它是以斐波納奇數字序列命名的, [1] 斐波納奇數字序列的比率提供了價格水平,市場傾向於在趨勢沿原方向繼續發展之前回調部分走勢。
A Fibonacci retracement forecast is created by taking two extreme points on a chart and dividing the vertical distance by Fibonacci ratios. 0% is considered to be the start of the retracement, while 100% is a complete reversal to the original price before the move. Horizontal lines are drawn in the chart for these price levels to provide support and resistance levels. Common levels are 23.6%, 38.2%, 50%, and 61.8%. The significance of such levels, however, could not be confirmed by examining the data.[2] Arthur Merrill in Filtered Waves determined there is no reliably standard retracement.[3]
斐波那契回撤預測是透過在圖表上取兩個極端點,然後用斐波那契比率除以垂直距離得出的。 0% 被認為是回調的開始,而 100% 則是完全反轉移動前的原始價格。在圖表中為這些價格水平繪製水平線,以提供支撐和阻力水平。常見的水平線有 23.6%、38.2%、50% 和 61.8%。不過,這些水平的重要性無法透過檢查數據來確認。 [2] 亞瑟-梅里爾在《過濾波浪》一書中確定沒有可靠的標準回撤。 [3]
The appearance of retracement can be ascribed to price volatility as described by Burton Malkiel, a Princeton economist in his book A Random Walk Down Wall Street.
普林斯頓大學經濟學家伯頓-馬爾基爾(Burton Malkiel)在其著作《華爾街漫步》(A Random Walk Down Wall Street)中描述了價格波動的原因,回調的出現可以歸因於此。
Common uses 常見用途[edit]
Fibonacci retracement is a popular tool that technical traders use to help identify strategic places for transactions, stop losses or target prices to help traders get in at a good price. The main idea behind the tool is the support and resistance values for a currency pair trend at which the most important breaks or bounces can appear.[4] The retracement concept is used in many indicators such as Tirone levels, Gartley patterns, Elliott wave principle, and more. After a significant movement in price (be it up or down) the new support and resistance levels are often at these lines.
斐波那契回檔是技術交易者常用的工具,用於協助確定交易、停損或目標價的策略位置,以幫助交易者在好的價位入場。該工具背後的主要理念是貨幣對趨勢的支撐和阻力值,在這些值上可能出現最重要的突破或反彈。 [4] 回撤概念用於許多指標,如 Tirone 水平、Gartley 模式、艾略特波浪原理等。在價格發生重大波動(無論是上漲還是下跌)之後,新的支撐位和阻力位往往就在這些線上。
Unlike moving averages, Fibonacci retracement levels are static prices. This allows quick and simple identification and allows traders and investors to react when price levels are tested. Because these levels are inflection points, traders expect some type of price action, either a break or a rejection. The 61.8% (0.618) Fibonacci retracement that is often used by financial analysts corresponds to the golden ratio.[1]
與移動平均線不同,斐波那契回撤水準是靜態價格。這樣可以快速簡單地識別,並讓交易者和投資者在價格水平受到測試時做出反應。由於這些水平是拐點,交易者會期待某種類型的價格行動,要么突破,要么拒絕。金融分析師經常使用的 61.8% (0.618) 斐波那契回撤與黃金分割率相對應。 [1]
Criticism 批評[edit]
Extensive backtests of Fibonacci retracement over thousands of stocks have shown that the retracements values of 38%, 50%, and 62% had been no likelier to appear than any other of the possible retracement values.[3][5]
對數千隻股票進行的大量斐波那契回調回測表明,38%、50% 和 62% 的回檔值並不比任何其他可能的回檔值更容易出現。 [3] [5]
See also 另見[edit]
References 參考資料[edit]
- ^ Jump up to: a b c Aspray, Tom (August 13, 2011). "Fibonacci analysis – Master the basics". Forbes. Retrieved October 24, 2016.
Aspray、Tom(2011 年 8 月 13 日)。 「斐波那契分析--掌握基礎」。福布斯》。Retrieved October 24, 2016. - ^ Kempen, René (2016). "Fibonaccis Are Human (Made)" (PDF). IFTA Journal.
Kempen, René (2016)."Fibonaccis Are Human (Made)" (PDF).IFTA 期刊。 - ^ Jump up to: a b Merrill, Arthur (1977). Filtered Waves: Basic Theory: a Tool for Stock Market Analysis. Analysis Press. ISBN 0911894365.
Merrill, Arthur (1977).Filtered Waves:基本理論:股市分析工具。分析出版社。 ISBN 0911894365. - ^ "Fibonacci Retracement Levels Are a Powerful Forex Tool of a Technical Analysis". EarnForex.com. Retrieved September 19, 2022.
"斐波納契回檔位是強大的外匯技術分析工具"。 EarnForex.com.Retrieved September 19, 2022. - ^ I tested Fibonacci Trading Strategy 100 TIMES to find the truth about Fibonacci Retracements, retrieved March 3, 2024
我測試了 100 次斐波納奇交易策略,以找出斐波納奇回呼的真相,檢索 March 3, 2024
