}
\author{
Juan de Oña ${ }^{a}$, Rocío de Oña ${ }^{a}$, Laura Eboli ${ }^{\text {b,*, Gabriella Mazzulla }{ }^{b}}$ \\ a TRYSE Research Group, University of Granada, Department of Civil Engineering, SeveroOcho s/n, Granada 18071, Spain \\ ${ }^{\mathrm{b}}$ University of Calabria, Department of Civil Engineering, Via Pietro Bucci, Rende 87036, Italy
}
\section*{A R T I C L E I N F O}
Available online 7 August 2013
Keywords:
Bus transit service
Overall Service Quality
Passengers' perceptions
Structural Equation Modelling
\begin{abstract}
A B S T R A C T
This paper proposes a methodology for evaluating the quality of service perceived by users of a bus transit service. A Structural Equation Model (SEM) approach is used to reveal the unobserved latent aspects describing the service and the relationships between these aspects with the Overall Service Quality. Data from a Customer Satisfaction Survey conducted by the Transport Consortium of Granada (Spain) are analyzed. A total of 1200 surveys were collected, and two passengers' statements about the Overall Service Quality were gathered: the first one when passengers have not reflected on the attributes describing the service, and the second one after they have thought about them. This is the first time that the Overall Service Quality of a public transport system has been jointly explained by these two overall evaluations when a SEM approach is adopted.
Some interesting results have been obtained. Three latent variables were identified representing the main characteristics of the service. The unobserved latent construct obtaining the highest weight on Overall Service Quality is Service, while Comfort and Personnel have little influence. The passengers' evaluation better explaining the Overall Service Quality is the evaluation made when passengers have reflected on the service.
The findings of this research can provide operating companies and transport managers valuable information for designing appropriate transport policies attracting new passengers and retaining the current ones.
\end{abstract}
(C) 2013 Elsevier Ltd. All rights reserved.
\section*{1. Introduction}
Nowadays the success of a public transport system depends on the number of passengers which the system is able to attract and retain. For this reason, the quality of a service becomes an issue of maximum importance because it is known that an improvement in the level of quality of the service leads to a higher satisfaction of the passengers and to an increase of the use of the system.
Service quality is related to a series of attributes describing the Public Transport (PT) service. Berry et al. $(1990)$ point out that "customers are the sole judges of service quality", and many authors have also supported this theory. Therefore, if service quality is measured from the customer's perspective, transit quality depends on the passengers' perceptions about each attribute characterizing the service.
In order to design appropriate transport strategies, operating companies monitor the perceptions of the users about the service every year or with a 6-month frequency. These perceptions are usually
\footnotetext{
* Corresponding author. Tel./fax: +39 0984496784.
E-mail address: laura.eboli@unical.it (L. Eboli).
}
measured by customer satisfaction surveys, and the data collected are used for developing indices providing useful information about the global quality of service and its evolution along the time. However, for determining these measures, they need not only to know the perceptions about the attributes of quality, but also to identify which attributes have the highest influence on the global assessment of the service. Asking customers to rate each attribute on an importance scale is the method mostly used by the operating companies.
However, previous studies showed that the factors affecting the global evaluation of the passengers about the service can vary when they are provoked into thinking about some attributes of the service which they did not consider before. dell'Olio et al. (2010) demonstrated that passengers may change his overall evaluation when they are made to reflect on the attributes characterizing the service, and de Oña et al. (2012) discovered that the key factors influencing the perception of the passengers about a bus transport service are different before and after their reflection.
So, asking customers to state the importance of each service attribute can lead to erroneous estimation, because some attributes can be rated as important even though they have little influence on overall quality, or they are important only in one of the moments of the assessment (before or after thinking).
For this reason, derived importance methods, which determine the importance of the attribute by statistically testing the strength of the relationship of individual attributes with overall satisfaction, are preferred by researches because of their numerous advantages (Weinstein, 2000), although they are not very used because of their high complexity.
In the field of public transportation and based on customer satisfaction surveys, the derived importance approaches mostly used for investigating on customer satisfaction and transit service quality have been: regression analysis (e.g. Aksoy et al., 2003; Dell'Olio et al., 2010; Huse and Evangelho, 2007; Kim and Lee, 2011; Tyrinopoulos and Aifadopoulou, 2008; Tyrinopoulos and Antoniou, 2008; Weinstein, 2000) and methods based on factor analysis, as Principal Component Analysis (PCA) (e.g. Ching-Chiao et al., 2009; Chin-Shan, 2007; Kolanovic, 2008; Lai and Chen, 2010; Pantouvakis, 2010; Rahaman and Rahaman, 2009; Sezhian et al., 2011), Confirmatory Factor Analysis (CFA) (e.g. Changa and Chen, 2007; Yu and Lee, 2011) or Structural Equation Models (SEM) (e.g. Andreassen, 1995; Eboli and Mazzulla, 2007, 2012; Irfan Syed et al., 2011; Karlaftis et al., 2001; Ngatia et al., 2010; Stuart et al., 2000).
\hline & & $x_{2}$ & Punctuality (Item2) & 1.459 & 0.121 & 0.000 & 0.591 \\
标准
公交服务中的感知服务质量:结构方程方法
胡安·德·奥尼亚,罗西奥·德·奥尼亚,劳拉·埃博利
西班牙格拉纳达大学土木工程系 TRYSE 研究小组,地址:Severo Ocho s/n,格拉纳达 18071
卡拉布里亚大学,土木工程系,意大利雷恩德皮耶特罗布奇大街 87036 号
文章信息
2013 年 8 月 7 日在线可用
关键词:
公交运输服务
整体服务质量
乘客的感知
结构方程模型
摘要
本文提出了一种评估公交服务用户感知服务质量的方法。采用结构方程模型(SEM)方法揭示描述服务的未观察到的潜在因素以及这些因素与整体服务质量之间的关系。对西班牙格拉纳达交通联盟进行的客户满意度调查数据进行了分析。共收集了 1200 份调查问卷,并收集了两个乘客关于整体服务质量的陈述:第一个是在乘客没有考虑描述服务的属性时,第二个是在他们考虑了这些属性之后。这是首次采用 SEM 方法共同解释公共交通系统整体服务质量的这两个整体评估。
已获得一些有趣的结果。识别出了三个潜在变量,代表了服务的主要特征。在整体服务质量上获得最高权重的是服务这个未被观察到的潜在构建,而舒适度和人员对其影响较小。乘客对整体服务质量的评价更好地解释了乘客在反思服务时所做的评价。
这项研究的发现可以为运营公司和运输管理者提供有价值的信息,以设计吸引新乘客和保留现有乘客的适当交通政策。
(C)2013 Elsevier Ltd. 版权所有。
介绍
现如今,公共交通系统的成功取决于该系统能够吸引和保留的乘客数量。因此,服务质量成为一个极其重要的问题,因为众所周知,服务质量的提高会导致乘客的更高满意度和系统使用量的增加。
服务质量与描述公共交通(PT)服务的一系列属性相关。贝里等人指出“顾客是服务质量的唯一评判者”,许多作者也支持这一理论。因此,如果从顾客的角度衡量服务质量,交通质量取决于乘客对描述服务的每个属性的感知。
为了设计合适的运输策略,运营公司每年或每 6 个月频率监测用户对服务的感知。这些感知通常是
通过客户满意度调查来衡量,收集的数据用于开发提供有关全球服务质量及其随时间变化的有用信息的指标。然而,为了确定这些指标,他们不仅需要了解对质量属性的感知,还需要确定哪些属性对服务的整体评估具有最高影响力。询问客户对每个属性进行重要性评分是运营公司主要使用的方法。
然而,先前的研究表明,影响乘客对服务的整体评价的因素可能会因为他们被迫思考一些之前没有考虑过的服务属性而发生变化。dell'Olio 等人(2010)证明,当乘客被要求反思服务的特征属性时,他们可能会改变对整体评价的看法;而 de Oña 等人(2012)发现,在乘客反思之前和之后,影响他们对公交运输服务感知的关键因素是不同的。
因此,要求客户评估每个服务属性的重要性可能会导致错误的估计,因为一些属性可能被评为重要,即使它们对整体质量的影响很小,或者它们只在评估的某个时刻(思考之前或之后)非常重要。
由于其众多优点(Weinstein,2000),研究人员更喜欢使用派生重要性方法来确定属性的重要性,这些方法通过统计测试个体属性与整体满意度之间的关系强度。尽管由于其高复杂性,这些方法并不常用。
在公共交通领域,基于客户满意度调查,用于调查客户满意度和交通服务质量的主要派生重要性方法有:回归分析(例如 Aksoy 等,2003 年;Dell'Olio 等,2010 年;Huse 和 Evangelho,2007 年;Kim 和 Lee,2011 年;Tyrinopoulos 和 Aifadopoulou,2008 年;Tyrinopoulos 和 Antoniou,2008 年;Weinstein,2000 年)和基于因子分析的方法,如主成分分析(例如 Ching-Chiao 等,2009 年;Chin-Shan,2007 年;Kolanovic,2008 年;Lai 和 Chen,2010 年;Pantouvakis,2010 年;Rahaman 和 Rahaman,2009 年;Sezhian 等,2011 年),验证性因子分析(例如 Changa 和 Chen,2007 年;Yu 和 Lee,2011 年)或结构方程模型(例如 Andreassen,1995 年;Eboli 和 Mazzulla,2007 年,2012 年;Irfan Syed 等,2011 年;Karlaftis 等,2001 年;Ngatia 等,2010 年;Stuart 等,2000 年)。
SEM 方法学已广泛应用于多个研究领域,近年来在公共交通服务质量领域中开始被最频繁地使用。这是因为服务质量是一个复杂、模糊和抽象的概念(Carman, 1990; Parasuraman et al., 1985),取决于一系列观察和未观察到的变量。这些未观察到的变量通常被称为维度。这些维度用于更好地理解客户如何感知各种服务属性,通过将它们分组成代表相似属性的因子。
当这些维度没有事先确定时,可以使用统计方法来确定它们。最流行的方法是因子分析,它分析大量属性是否与较少的未观察变量呈线性相关。各种作者在他们的研究中使用了这种方法,作为先前步骤中使用其他统计方法分析服务质量的方法,例如 Aksoy 等人(2003)在预测航空公司满意度之前应用了这种方法进行判别分析;Eboli 和 Mazzulla(2007)使用因子分析和结构方程模型评估公交运输方面对全球客户满意度的影响;Kim 和 Lee(2011)和 Weinstein(2000)在因子分析之后使用多元线性回归技术。Kim 和 Lee(2011)评估了韩国国内航空公司的质量,Weinstein(2000)研究了旧金山地区快速交通的服务因素对乘客整体满意度的相对重要性。
因此,本研究的主要目的是确定一系列描述公交运输服务质量的特征对整体服务质量(OSQ)的影响。本文的另一个目的是揭示哪些未观察到的潜在方面代表了服务的主要特征,这些特征由描述服务质量的属性所描述。在这项工作中,没有使用因子分析,而是采用结构方程模型(SEM)方法。提出了四种不同的模型,并找到了更好的拟合结构。这是首次使用 SEM 分析公共交通中的 SQ,使用两个不同的乘客对服务的整体评价(在反思服务属性之前和之后)作为解释 OSQ 的观察变量。考虑这两个关于 SQ 的评价可以帮助更好地理解 OSQ 的概念。在 Eboli 和 Mazzulla(2007)和 Eboli 和 Mazzulla(2012)中,OSQ 是通过唯一可用的满意度指标来衡量的,并且是通过一个重要性指标来不当地衡量的。拥有两个不同的整体满意度评价的可用性为更好地衡量 OSQ 的潜在构建提供了良好的机会。 此外,我们认为拥有这两种不同的判断是有优势的,因为它可以在面试的两个不同时刻对整体服务质量的评估进行有趣的研究,正如我们在实验环境部分所观察到的。
本文分为五个部分。第二部分描述了方法论的方法,然后在第三部分介绍了所使用的收集到的数据。第四部分讨论了主要结果,最后在第五部分,本文总结了对调查的一些结论。
方法论
结构方程模型(SEM)方法是一种强大的多变量分析技术,可以建立观察变量和未观察变量之间的一组关系来对现象进行建模。尽管它是在 1970 年代开始的一个相对较新的方法(Fornell 和 Lacker,1981),但它已经广泛应用于各种研究领域,包括心理学、教育、社会科学、经济学、统计学等。SEM 方法是指一系列统计技术,如因子分析、路径分析和回归模型,用于分析数据。
结构方程模型由两个组成部分组成,一个测量模型评估未观察到的潜在变量作为观察变量的线性函数,一个结构模型显示潜在变量之间的关系的方向和强度。
结构模型的基本方程定义如下(Bollen, 1989):
其中
测量模型的基本方程如下:
其中
有不同的方法来估计结构方程系统,例如最大似然法(ML),广义最小二乘法(GLS),加权最小二乘法(WLS)等。所有这些方法都基于协方差分析方法,其中最小化样本协方差与模型隐含协方差矩阵之间的差异。最流行的方法是最大似然法,然而选择适当的结构方程模型估计方法取决于对概率分布、变量的尺度特性、结构方程模型的复杂性以及样本大小的不同假设(Golob,2003)。
3. 实验背景
该研究分析了在西班牙格拉纳达市运营的都市巴士公交服务的 OSQ。这项公共交通服务由一个巴士系统提供,其中有 15 家巴士公司运营,将 32 个市镇与格拉纳达市中心连接起来。研究所使用的数据来自一份调查问卷。
2007 年由格拉纳达交通联盟进行的客户满意度调查。通过面对面问卷调查,在公交车站向用户提出了 1200 次采访。
问卷分为两个主要部分。第一部分收集了一般信息(例如运营商、线路、访谈时间、起点/终点)、人口统计特征(例如性别、年龄和职业)和旅行习惯(例如旅行原因、使用频率、车票类型、是否有私家车、到达公交车站/从公交车站移动时使用的互补方式)。
样本的特点是女性比男性多(
关于旅行的目的,乘客有不同的原因。对于
问卷的第二部分关注用户对服务的意见。这部分也分为三个主要子部分:A 部分,要求乘客说明描述服务的每个属性的重要性;B 部分,涉及对每个属性质量的感知;以及部分,收集对服务质量的整体评价。在调查过程中,最后一个问题被问了两次:第一次是在第二部分开始时(之前的评价),第二次是在问卷结束后(之后的评价),乘客在此之后对描述服务的属性进行了思考。
调查中考虑的服务属性如下:行驶频率(Frequency)、准时性(Punctuality)、行程速度(Speed)、起点/终点附近的站点距离(Proximity)、票价(Fare)、车辆清洁度(Cleanliness)、车内空间(Space)、车内温度(Temperature)、可用信息(Information)、车上安全性(Safety)、工作人员的礼貌或友好程度(Courtesy)以及上下车的便利性(Accessibility)。这些是服务运营商选择的 12 个属性。
0 到 10 的基准量表被用于衡量属性的重要性和满意度,以及对整体服务质量的后续评估,而五点语义量表(非常差,差,一般,好,非常好)被用于之前的评估。这个语义量表被编码为 5 点基准量表。评估的尺度也是由服务提供商选择的。本文使用的数据来自公交服务提供商进行的非研究导向的调查,所以我们没有决定尺度。然而,关于要求对整体服务质量进行后续和之前的评估的选择,我们认为询问用户两个不同的项目(在反思服务属性之前和之后)非常有用,因为用户可以根据认为最重要的某些方面来表达对整体服务的意见,但是如果用户考虑到调查所调查的具体方面,这个意见可能会改变。表 1 显示了
表 1
问卷的第二部分。
| 零件 | 变量 | 意思 | 标准偏差 | 规模 | ||
属性的重要性 |
项目 1 | 频率 | 9.03 | 1.54 | 卡片规模 | |
| 项目 2 | 准时 | 9.14 | 1.44 | 卡片规模 | ||
| 项目 3 | 速度 | 8.72 | 1.70 | 卡片规模 | ||
| 项目 4 | 接近 | 8.68 | 1.77 | 卡片规模 | ||
| 项目 5 | 费用 | 8.72 | 1.80 | 卡片规模 | ||
| 项目 6 | 清洁 | 8.85 | 1.47 | 卡片规模 | ||
| 项目 7 | 空间 | 8.66 | 1.71 | 卡片规模 | ||
| 项目 8 | 温度 | 8.71 | 1.62 | 卡片规模 | ||
| 项目 9 | 信息 | 8.60 | 1.72 | 卡片规模 | ||
| 项目 10 | 安全 | 8.98 | 1.52 | 卡片规模 | ||
| 项目 11 | 礼貌 | 8.74 | 1.75 | 卡片规模 | ||
| 项目 12 | 无障碍性 | 8.85 | 1.78 | 卡片规模 | ||
B. 属性满意度 |
项目 1 | 频率 | 6.80 | 2.53 | 卡片规模 | |
| 项目 2 | 准时 | 7.28 | 2.30 | 卡片规模 | ||
| 项目 3 | 速度 | 7.23 | 1.95 | 卡片规模 | ||
| 项目 4 | 接近 | 7.34 | 2.17 | 卡片规模 | ||
| 项目 5 | 费用 | 6.06 | 2.56 | 卡片规模 | ||
| 项目 6 | 清洁 | 7.43 | 1.81 | 卡片规模 | ||
| 项目 7 | 空间 | 7.14 | 2.01 | 卡片规模 | ||
| 项目 8 | 温度 | 7.37 | 1.95 | 卡片规模 | ||
| 项目 9 | 信息 | 6.62 | 2.42 | 卡片规模 | ||
| 项目 10 | 安全 | 7.65 | 1.96 | 卡片规模 | ||
| 项目 11 | 礼貌 | 7.94 | 1.80 | 卡片规模 | ||
| 项目 12 | 无障碍性 | 6.75 | 2.44 | 卡片规模 | ||
| C. 总体 SQ | 项目 13 | 以前的评估 | 3.52 | 0.83 | 5 点 | SEM 规模 |
| 项目 14 | 后期评估 | 7.07 | 1.58 | 卡片规模 |
调查的第二部分结构,评估的属性,用于衡量这些属性的尺度,以及用户对重要性和满意度率的平均值和标准差。
根据属性的重要性,乘客的判断在属性
相反,用户对感知的判断更加异质化,标准差的值(大于 1.8 且小于 2.56)高于对重要性评分的值。被评为最异质化的属性是票价,也是平均评分最低的属性(6.06)。感知评分的平均值低于重要性评分的均值。它们集中在 6 到 8 的范围内。尽管如此,这些值仍然相当不错,因为所有属性至少被感知为适当的质量,其中一些属性的质量相当好。质量水平最高的属性是礼貌、安全和温度。
通过观察之前和之后的评估平均值,它们显示出相似的平均值,根据 5 分制的评估,之前的评估平均值为 3.52(相当于 11 分制的 6.30),而之后的评估平均值为 11 分制的 7.07。因此,当用户反思了服务的不同属性后,他们评价 OSQ 更好。
4. 结果
4.1. 潜在构建的规范
在这项研究中,应用 SEM 方法来分析格拉纳达大都市区的城市巴士公交服务的 OSQ。追求两个不同的目标。第一个目标是揭示代表主要服务质量方面的未观察到的潜在构建;这些构建由描述服务的一系列属性来解释。为了实现这个目标,指定了不同的模型,并找到了最优模型。第二个目标是试图确定在用户决定使用服务时,服务的哪些方面对他们影响最大。在前一步选择的模型用于提取这些结果。
该分析所采用的策略始于一个初始候选模型,其中提出了一组服务质量的潜在方面。根据试图解释的特征,该模型在新的候选模型中重新规定,修改潜在构建的结构和数量。最后,比较提出的候选模型并选择最佳模型。最佳模型是最能识别由一系列描述服务的属性所解释的潜在构建的模型。
提出了四种不同的模型(M1、M2、M3 和 M4),揭示了不同的未观察到的潜在构建。在这些模型中,结构将外生潜在变量(即由一系列属性表示的服务的未观察到的方面)与内生潜在变量(即 OSQ)相关联。
使用 14 个观察变量来校准模型。其中 12 个涉及服务的特征(项目 1-项目 12),另外两个(项目 13 和项目 14)涉及对服务的整体评价。先前评估(项目 13)和后续评估(项目 14)用于解释潜在的内生变量(OSQ),而其他观察变量以不同的方式组合,以揭示服务的不同潜在外生变量作为未观察到的方面。这些模型是使用 Small Waters Corporation 的 AMOS 4.0 软件包(Arbuckle 和 Wothke,1995)进行校准的。
为了比较初始候选模型与其他模型,并选择最佳模型,使用了一些评估结构方程模型拟合度的指标。Hooper 等人(2008)介绍了确定模型拟合度的指导方针,其中将拟合指标分为绝对指标、增量指标和简约指标。同样的作者还提出了每个指标的可接受阈值水平。
绝对拟合指数确定某个模型与样本数据的拟合程度,并允许选择拟合程度更好的模型。与其他指数不同,绝对指数不依赖于与基准模型的比较。Hooper 等人(2008)将卡方检验、拟合优度指数(GFI)和调整拟合优度指数(AGFI)、均方根误差逼近指数(RMSEA)、均方根残差(RMR)和标准化均方根残差(SRMR)归入此类别。
增量适配指数是一组指标,用于将卡方值与基准模型进行比较,以拒绝所有变量无相关性的零假设。最常用的指标是标准化适配指数(NFI)和比较适配指数(CFI)。
简化拟合指数用于比较复杂模型,因为在这些情况下,估计过程依赖于样本数据。Mulaik 等人(1989)开发了两个简化拟合指数:简化拟合优度指数(PGFI)和简化标准化拟合指数(PNFI),分别基于 GFI 和 NFI 通过调整自由度损失而得出。对于这些指数,没有推荐的阈值水平;然而,作者指出,简化拟合指数可以达到约 0.50 的值,而其他拟合优度指数可以达到超过 0.90 的值。阿卡伊克信息准则(AIC)和其他基于贝叶斯理论的类似准则常用于比较具有相似维度的替代模型。
表 2
适配度度量。
| M1 | M2 | M3 | M4 | |
| 适配指数 | ||||
| 自由度 | 74 | 74 | 73 | 74 |
| 样本大小 | 1200 | 1200 | 1200 | 1200 |
| 参数个数 | 31 | 31 | 32 | 31 |
| 绝对适配指数 | ||||
| GFI | 0.84 | 0.85 | 0.80 | 0.86 |
| AGFI | 0.77 | 0.78 | 0.71 | 0.80 |
| RMSEA 是均方根误差逼近指数的缩写 | 0.13 | 0.13 | 0.14 | 0.12 |
| RMR | 0.94 | 0.92 | 0.99 | 0.84 |
| 增量适配指数 | ||||
| NFI | 0.64 | 0.68 | 0.59 | 0.70 |
| CFI | 0.65 | 0.68 | 0.60 | 0.71 |
| 简化适配指数 | ||||
| PGFI | 0.59 | 0.60 | 0.56 | 0.60 |
| PNFI | 0.52 | 0.54 | 0.47 | 0.57 |
| AIC | 1691.33 | 1564.27 | 1922.90 | 1404.93 |
不同数量的参数。产生这些标准最小值的模型被认为是最好的。
作者使用的描述性拟合统计量显示在表 2 中。
在第一个模型(M1)中,建立了三个潜在外生变量,分别称为服务(Service)、舒适度(Comfort)和其他(Others)(见图 1)。变量服务由五个观察变量(Item1-Item5)解释,描述了服务的表现,如“频率”、“准时性”、“速度”、“接近度”和“票价”。舒适度由三个属性(Item6-Item8)组成,描述了车内舒适度的等级,如“清洁度”、“空间”和“温度”。而变量其他由其余属性(Item9-Item12)评估,这些属性不共同代表服务的特定方面;用于解释其他的变量是“信息”、“安全性”、“礼貌”和“可访问性”。
模型卡方指示样本与拟合协方差矩阵之间的差异程度在 0.05 的水平上是不显著的,这是几位作者(Mulaik 等,1989 年;Golob,2003 年;Hooper 等,2008 年)建议的阈值值。同样的作者指出,样本大小应大于 200 才能得到可接受的模型。绝对拟合指标如 GFI 和 AGFI 的值低于建议的推荐值,即
在第二个模型(M2)中,观察变量“可达性”被用来解释潜在构建“舒适度”,而不是“其他”。原因是“可达性”指的是上下公交车的便利程度,因此乘客可以将其视为代表他们进入车辆的舒适度的一个方面。这个模型使用了与 M1 相同的三个潜在外生变量(服务、舒适度和其他),但在这种情况下,观察变量“可达性”被从潜在构建“其他”中移除,并用来解释潜在构建“舒适度”。这个第二个模型的拟合指数更好,GFI、AGFI 和 CFI 的值更高,RMSEA 的值更低。此外,通过考虑 RMR 和 AIC 指数的较低值,我们可以将该模型视为比之前的模型更好。这表明“可达性”比“其他”更好地解释了舒适度潜在变量。
在模型 3(M3)中,提出了四个潜在的外生变量。这些变量分别命名为服务(Service)、接入(Access)、舒适(Comfort)和其他(Others)。服务描述了使用四个观察变量("频率"、"准时性"、"速度"和"票价")来评估服务的表现。接入变量包含两个属性,描述了进入或离开服务的两个不同时刻:第一个是"接近度"(表示乘客需要行驶的距离,从起点到公交车站或从公交车站到目的地的距离),第二个是"可达性"(表示进入服务的最后一步,上车,或离开服务的第一步,下车)。舒适性考虑了与 M1 中相同的观察变量("清洁度"、"空间"和"温度"),其他变量包括"信息"、"安全性"和"礼貌"。该模型的拟合指标结果比之前的模型(M1 和 M2)更差,AIC 准则(1922.90)、RMR(0.99)和 RMSEA 指数(0.14)的值较高。其他拟合指标(GFI、AGFI 和 CFI)也较 M1 和 M2 小。 因此,变量 Access 被拒绝作为模型的潜在构建。
最后一个模型(M4)引入了三个潜在的外生变量,分别命名为服务、舒适和人员(图 2)。该模型将与员工相关的观察外生变量结合在一起,形成一个新的潜在构建,称为人员。这个潜在变量由与服务中涉及的人员行为相关的两个属性解释,即“安全”(与司机的行为相关)和“礼貌”(人员的友善)。服务构建的定义与 M1 中相同,但还考虑了属性“信息”作为该构建的观察变量。最后,舒适性与 M2 中的相同,因为先前证明当属性“可访问性”参与其测量模型时,这个潜在方面的解释更好。这个模型的描述性拟合统计数据是所有候选模型中最好的。每个统计数据可以根据对 M1 模型的相同观察进行评论。为了证明拟合度指数的取值,我们可以考虑当我们采用
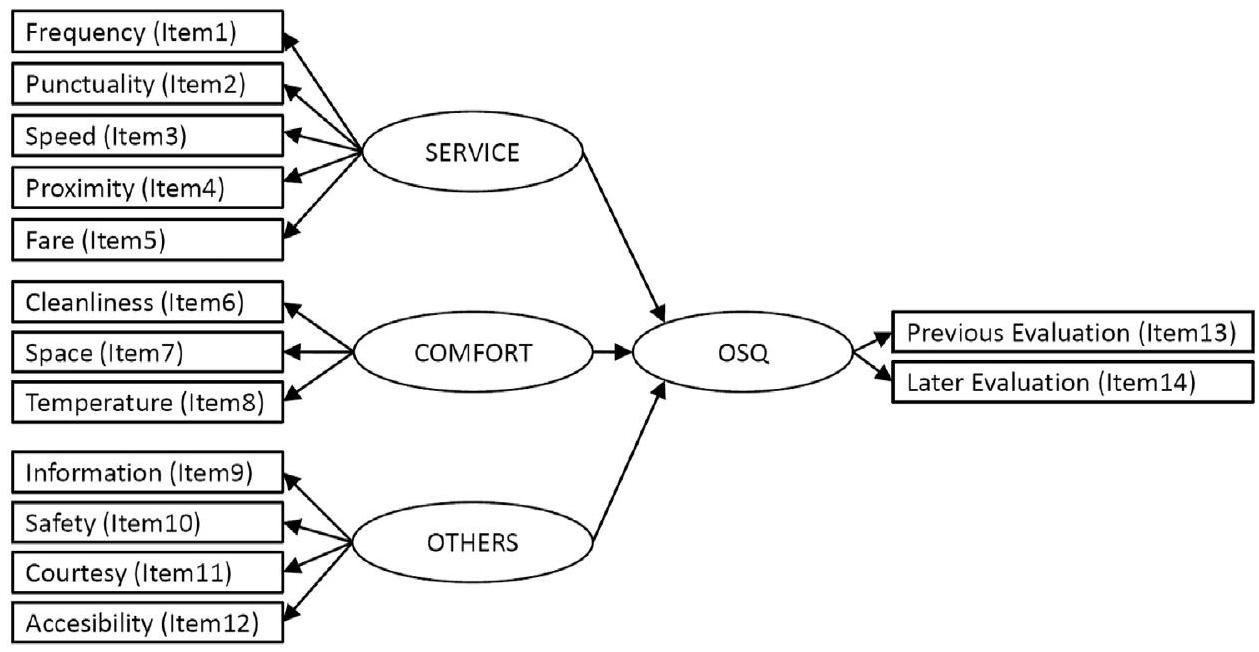
图 1. 模型 1.
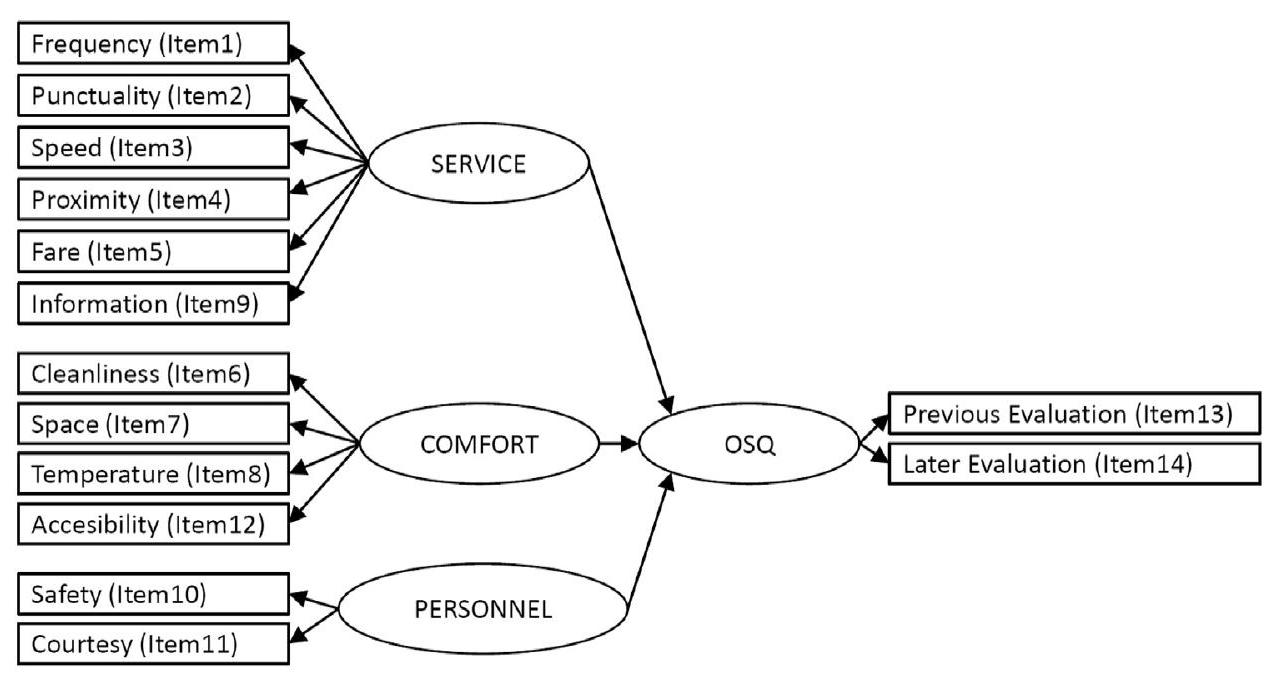
图 2. 模型 4.
在结构方程模型的方法中,发现拟议模型的拟合度较差并不罕见(Hooper 等,2008)。此外,由于服务的三个特性:无形性、异质性和不可分割性,我们可以认为服务质量的概念是复杂、模糊和抽象的(Parasuraman 等,1985)。服务质量与满意度之间的关系在文献中并不清楚,因为这两个变量的性质相似。在这种情况下,我们试图通过使用客户对服务质量的感知度量来解释这种关系。还应考虑到通过减少参数数量和解释外生潜变量的观察变量数量可以改善模型拟合度。然而,我们决定不排除任何测量指标进行分析。最终,考虑到现象的复杂性,我们认为获得的模型的统计结果仍然可以被认为是令人满意的,尽管文献中对于拥有良好模型的可接受阈值的建议。
然后,M4 是最佳选择的模型,最能识别服务中未观察到的潜在因素。该模型包括三个潜在外生变量(服务、舒适度和人员),对 OSQ 产生影响。在下一节中,揭示了最大程度影响用户对 OSQ 感知的服务方面。
4.2. 服务方面对 OSQ 的影响
所选模型(M4)的结果显示在表 3 和表 4 中。表 3 显示了参与测量模型的潜在变量和观察变量之间的关系,而表 4 显示了结构模型的潜在变量之间的关系。表格的第一列和第二列显示了模型的变量,从第二列到第六列显示了这些关系的不同统计数据:回归权重(R.W.),标准误差(S.E.),概率水平
关于测量模型,所有参数在显著性水平较高时都假设与零有统计上的显著差异。大多数回归权重都相当高(标准化回归权重超过 0.5)。只有两个权重的值较低。通过观察潜在外生变量与其观察指标之间的关系,可以得出一些有趣的结果。潜在变量“服务”最好由“速度”(0.659)、“频率”(0.615)、“准时性”(0.591)和“信息”(0.579)来解释,而“接近度”和“票价”对该变量的影响较小(分别为 0.429 和 0.483)。变量“舒适度”最好由船上的“温度”和“空间”(分别为 0.665 和 0.663)来理解,而对于“人员”这个变量,与司机行为相关的“安全性”关系最为密切(0.632)。
内生潜变量由两个观察变量很好地解释,这两个变量的标准化回归权重值较高。"后期评估"的影响
结构模型的参数也假设与零有统计上的差异。在这种情况下,潜在外生变量与 OSQ 之间的关系强度非常不同。对 OSQ 影响最大的外生潜在变量是服务,标准回归权重为 0.823。另外两个外生潜在变量对 OSQ 的影响较小,人员方面的值为 0.253,舒适度方面的值为 0.172。需要强调的是,人员方面的影响大于舒适度的影响。
5. 结论
这项研究表明,结构方程模型(SEM)方法是一种强大的工具,可以作为一种替代技术,用于找出描述服务质量的一系列属性下隐藏的潜在因素。我们认为,这种方法对于分析服务质量非常有用,但很难确定这种工具是否比其他方法更好。然而,作者选择了 SEM 方法,因为他们认为它适合描述像运输乘客对所使用服务的感知这样的复杂现象。SEM 是一种类似于回归建模但更先进的技术;事实上,它允许引入真正出现在这种现象中的潜在构建,其中存在一些潜在因素,这是由于用户感知的主观性和表征运输服务的各种属性的多样性所导致的。
表 3
测量模型。
| 潜在变量 | 观察变量 | R.W. | S.E. | 标准 R.W. | |||
| 外生变量 | |||||||
| 服务 | 频率(项目 1) | 1.668 | 0.136 | 0.000 | 0.615 | ||
| 准时性(项目 2) | 1.459 | 0.121 | 0.000 | 0.591 | |||
| 速度(项目 3) | 1.379 | 0.110 | 0.000 | 0.659 | |||
| 接近(项目 4) | 1.000 | - | - | 0.429 | |||
| 费用(项目 5) | 1.328 | 0.122 | 0.000 | 0.483 | |||
| Information (Item9) | 1.504 | 0.126 | 0.000 | 0.579 | |||
| Comfort | Cleanliness (Item6) | 0.810 | 0.068 | 0.000 | 0.549 | ||
| Space (Item7) | 1.083 | 0.085 | 0.000 | 0.663 | |||
| Temperature (Item8) | 0.085 | 0.083 | 0.000 | 0.665 | |||
| Accessibility (Item12) | 1.000 | - | - | 0.504 | |||
| Personnel | Safety (Item10) | 1.245 | 0.273 | 0.000 | 0.632 | ||
| Courtesy (Item11) | 1.000 | - | - | 0.552 | |||
| Endogenous variable | |||||||
| Overall Service Quality | Previous Evaluation (Item13) | 1.000 | - | - | 0.568 | ||
| Later Evaluation (Item14) | 2.506 | 0.161 | 0.000 | 0.778 | |||
Table 4
Structural model.
| Latent Variable | Latent Variable | R.W. | S.E. | Std. R.W. | ||
| Endogenous variable | Exogenous | |||||
| variable | ||||||
| Service | ||||||
| Comfort | 0.400 | 0.037 | 0.000 | 0.823 | ||
| Personnel | 0.0115 | 0.022 | 0.000 | 0.172 | ||
| 0.253 |
After the building of four different models, the best structure of the latent variables was found, and three latent constructs were identified as the main characteristics explaining OSQ. These latent constructs were Service (linked to the attributes explaining the performance of the service), Comfort (linked to the attributes influencing comfort in the travel experience) and Personnel (linked to the attributes related to the behaviour of the staff).
Furthermore, it was proved that this methodology is appropriate for modelling OSQ in the bus transit service, and for determining the variables which play an important role in passengers' perceptions about the service quality. As an example, the results of the final model (M4) discovered that Service is the exogenous latent variable with the major influence on OSQ, being Frequency and Speed the observed variables better explaining this construct, and Proximity and Fare the variables with the lowest weight. On the other hand, a low impact of Comfort and Personnel on OSQ was deduced. However, passengers are more worried about the personnel behaviour (related with safety and courtesy) than about aspects providing comfort to their trip. It is important to emphasize that although these latent variables are not important as the Service construct, they have a decisive role in the global perception of Service Quality anyway; for this reason, planners and managers of PT should not forget about them when they formulate measures for promoting the use of the public transport.
Another important point of this work is to know which global evaluation about the service better explains the OSQ latent construct. The relationship between these observed variables and the latent construct show that the two indicators are adequate for explaining OSQ; however, the Later Evaluation shows a wider explication of OSQ.
The resulting model structure provides valuable information for understanding which are the aspects of the service mostly influencing passengers when they are going to use the service. This information can help transport managers to prepare new strategies and investment plans in order to continually improve the quality perceived by passengers, and consequently the use of the system. Also transit operators can use the findings to attract new passengers and retain the current ones. As an example, considering the results obtained from the final model selected in this work, the operators should improve the service by focusing on improving aspects such as service frequency and speed, because they are considered as the most important for the users, giving a considerable increase to the overall satisfaction of the users and therefore to the Overall Service Quality.
Finally we would like to point out that the data used in this paper come from a customer satisfaction survey that was a nonresearch oriented survey. A rather simple statistical frequency analysis was the main target. However, the application of more advanced modelling techniques proves that this kind of data can be used to reveal very interesting details for managers and public transport operators and it could increase the collaboration between researchers and the industry.
Acknowledgements
This study is sponsored by the Consejería de Innovación, Ciencia y Economía of the Junta de Andalucía (Spain) through the Excellence Research Project denominated "Q-METROBUSQuality of service indicator for METROpolitan public BUS transport services". The authors also acknowledge the Granada Consorcio de Transportes for making the data set available for this study.
References
Aksoy, S., Atilgan, E., Akinci, S., 2003. Airline services marketing by domestic and foreign firms: differences from the customers' viewpoint. Journal of Air Transport Management 9, 343-351.
Arbuckle, J.L., Wothke, W., 1995. AMOS 4.0 User's Guide, SmallWaters Corporation, Chicago.
Andreassen, T.W., 1995. (Dis)satisfaction with public services: the case of public transportation. Journal of Services Marketing 9, 30-41.
Berry, L.L., Zeithaml, V.A., Parasuraman, A., 1990. Five imperatives for improving service quality. Sloan Management Review, Summer 31 (4) 9-38.
Bollen, K.A., 1989. Structural Equations with Latent Variables. Wiley, New York.
Carman, J., 1990. Consumer perceptions of service quality: an assessment of the SERVQUAL dimensions. Journal of Retailing 66, 33-55.
Changa, Y.H., Chen, F.Y., 2007. Relational benefits, switching barriers and loyalty: a study of airline customers in Taiwan. Journal of Air Transport Management 13, 104-109.
Ching-Chiao, Y., Marlow, P.B., Chin-Shan, L., 2009. Assessing resources, logistics service capabilities, innovation capabilities and the performance of container
shipping services in Taiwan. International Journal of Production Economics 122,4-20 4-20
shipping services in Taiwan. International Journal of Production Economics 122,
Chin-Shan, L., 2007. Evaluating key resources and capabilities for liner shipping services. Transport Reviews 27 (3), 285-310.
dell'Olio, L., Ibeas, A., Cecin, P., 2010. Modelling user perception of bus transit quality. Transport Policy 17 (6), 388-397.
de Ona, J., de Ona, R., Calvo, F.J., 2012. A classification tree approach to identify key factors of transit service quality. Expert Systems with Applications 39, 11164-11171.
Eboli, L., Mazzulla, G., 2007. Service quality attributes affecting customer satisfaction for bus transit. Journal of Public Transportation 10 (3), 21-34.
Eboli, L., Mazzulla, G., 2012. Structural equation modelling for analysing passengers' perceptions about railway services. Procedia-Social and Behavioural Science 54, 96-106.
Fornell, C., Lacker, D.F., 1981. Evaluating structural equation models with unobservable variables and measurement error. Journal of Marketing Research 18 (1), 39-50.
Golob, T.F., 2003. Structural equation modeling for travel behavior research. Transportation Research Part B 37, 1-25.
Hooper, D., Coughlan, J., Mullen, M.R., 2008. Structural equation modelling: guidelines for determining model fit. Electronic Journal of Business Research Methods 6 (1), 53-60.
Huse, C., Evangelho, F., 2007. Investigating business traveller heterogeneity: lowcost vs full-service airline users? Transportation Research Part E 43, 259-268.
Irfan Syed M., Mui H.K.D., Shahbaz S. 2011. Service quality in rail transport of Pakistan: a passenger perspective? In: Paper presented at the 3rd SAICON: International Conference on Management, Business Ethics and Economics (ICMBEE), December 28-29, 2011, Lahore, Pakistan.
Karlaftis, M.G., Golias, J., Papadimitriou, E., 2001. Transit quality as an integrated traffic management strategy: measuring perceived service. Journal of Public Transportation 4 (1).
Kim, Y.K., Lee, H.R., 2011. Customer satisfaction using low cost carriers. Tourism Management 32 (2), 235-243.
Kolanovic, I., 2008. Defining the port service quality using factor analysis. Pomorstvo 22 (2), 83-297.
Lai, W.T., Chen, C.F., 2010. Behavioural intentions of public transit passengers-the roles of service quality, perceived value, satisfaction and involvement. Transport Policy 18, 318-325.
Lai, W.T., Chen, C.F., 2010. Behavioural intentions of public transit passengers-the roles of service quality, perceived value, satisfaction and involvement. Transport Policy 18, 318-325.
Mulaik, S.A., James, L.R., van Alstine, J., Bennett, N., Lind, S., Stilwell, C.D., 1989. Evaluation of goodness-of-fit indices for structural equation models. Psychological Bulletin 105, 430-445.
Ngatia, G.J., Okamura, T., Nakamura, F., 2010. The Structure of users' Satisfaction on urban public transport service in developing country: the Case of Nairobi. Journal of the Eastern Asia Society for Transportation Studies 8, 1288-1300.
Pantouvakis, A., 2010. The relative importance of service features in explaining customer satisfaction-a comparison of measurement models. Managing Service Quality 20 (4), 366-387.
Parasuraman, A., Zeithaml, V.A., Berry, L.L., 1985. A conceptual model of service quality and its implications for future research. Journal of Marketing 49, 41-50.
Rahaman, R.K., Rahaman, M.A., 2009. Service quality attributes affecting the satisfaction of passengers of a selective route in southwestern Bangladesh. Theoretical and Empirical Researches in Urban Management 3 (12), 115-125.
Sezhian, M.V., Muralidharan, C., Nambirajan, T., Deshmukh, S.G., 2011. Ranking of a public sector passenger bus transport company using principal component analysis: a case study. Management Research and Practice 3 (1), 62-71.
Stuart, K.R., Mednick, M., Bockman, J., 2000. Structural equation model of customer satisfaction for the New York City subway system. Transportation Research Record 1735, 133-137.
Tyrinopoulos, Y., Aifadopoulou, G., 2008. A complete methodology for the quality control of passenger services in the public transport business. European Transport 38, 1-16
Tyrinopoulos, Y., Antoniou, C., 2008. Public transit user satisfaction: variability and policy implications. Transport Policy 15 (4), 260-272.
Weinstein, A., 2000. Customer satisfaction among transit riders. How customer rank the relative importance of various service attributes. Transportation Research Record 1735, 123-132.
Yu, K.K., Lee, H.R., 2011. Customer satisfaction using low cost carriers. Tourism Management 32, 235-243.
- Corresponding author. Tel./fax: +39 0984496784.
E-mail address: laura.eboli@unical.it (L. Eboli).