Twitter Lite and High Performance React Progressive Web Apps at Scale
Twitter Lite和高性能的React渐进式Web应用在规模上的应用
A look into removing common and uncommon performance bottlenecks in one of the worlds largest React.js PWAs, Twitter Lite.
探索如何消除世界上最大的React.js PWA之一——Twitter Lite中常见和不常见的性能瓶颈。
Support the author by reading this at paularmstrong.dev
请在paularmstrong.dev上阅读以支持作者。
Creating a fast web application involves many cycles of measuring where time is wasted, understanding why it’s happening, and applying potential solutions. Unfortunately, there’s never just one quick fix. Performance is a continuous game of watching and measuring for areas to improve. With Twitter Lite, we made small improvements across many areas: from initial load times, to React component rendering (and prevention re-rendering), to image loading, and much more. Most changes tend to be small, but they add up, and the end result is that we have one of the largest and fastest progressive web applications.
创建一个快速的Web应用程序涉及到多个周期的测量时间浪费的地方,理解为什么会发生这种情况,并应用潜在的解决方案。不幸的是,没有一个快速解决方案。性能是一个持续的游戏,需要不断观察和测量以寻找改进的领域。通过Twitter Lite,我们在许多方面进行了小的改进:从初始加载时间到React组件渲染(以及防止重新渲染),到图像加载等等。大多数改变往往是小的,但它们累积起来,最终结果是我们拥有了最大和最快的渐进式Web应用程序之一。
Before Reading On: 阅读前:
If you’re just starting to measure and work toward increasing the performance of your web application, I highly recommend learning how to read flame graphs, if you don’t know how already.
如果您刚开始测量和努力提高您的网络应用程序的性能,我强烈建议学习如何阅读火焰图,如果您还不知道的话。
Each section below includes example screenshots of timeline recordings from Chrome’s Developer Tools. To make things more clear, I’ve highlighted each pair of examples with what’s bad (left image) versus what’s good (right image).
每个部分下面都包含了Chrome开发者工具中时间轴录制的示例截图。为了更清楚,我用高亮显示了每对示例中的不好的部分(左图)和好的部分(右图)。
Special note regarding timelines and flame graphs: Since we target a very large range of mobile devices, we typically record these in a simulated environment: 5x slower CPU and 3G network connection. This is not only more realistic, but makes problems much more apparent. These may also be further skewed if we’re using React v15.4.0’s component profiling. Actual values on desktop performance timelines will tend to be much faster than what’s illustrated here.
关于时间轴和火焰图的特别说明:由于我们的目标是非常广泛的移动设备,我们通常在模拟环境中记录这些数据:CPU速度减慢5倍,网络连接为3G。这不仅更加真实,而且使问题更加明显。如果我们使用React v15.4.0的组件分析功能,这些数据可能会进一步偏离。在桌面性能时间轴上的实际值往往比这里所示的要快得多。
Optimizing for the Browser
优化浏览器
Use Route-Based Code Splitting
使用基于路由的代码拆分
Webpack is powerful but difficult to learn. For some time, we had issues with the CommonsChunkPlugin and the way it worked with some of our circular code dependencies. Because of that, we ended up with only 3 JavaScript asset files, totaling over 1MB in size (420KB gzip transfer size).
Webpack功能强大但学习难度较大。有一段时间,我们在CommonsChunkPlugin和它与一些循环代码依赖关系的工作方式上遇到了问题。因此,我们最终只有3个JavaScript资源文件,总大小超过1MB(gzip传输大小为420KB)。
Loading a single, or even just a few very large JavaScript files in order to run a site is a huge bottleneck for mobile users to see and interact with a website. Not only does the amount of time it takes for your scripts to transfer over a network increase with their size, but the time it takes for the browser to parse increases as well.
加载一个或者只是几个非常大的JavaScript文件来运行一个网站对于移动用户来说是一个巨大的瓶颈,使他们能够查看和与网站进行交互。不仅脚本传输所需的时间随着文件大小的增加而增加,浏览器解析所需的时间也增加。
After much wrangling, we were finally able to break up common areas by routes into separate chunks (example below). The day finally came when this code review dropped into our inboxes:
经过长时间的争论,我们终于成功将公共区域按照路径分成了独立的块(以下是示例)。终于有一天,这份代码审查的邮件出现在我们的收件箱中:
Adds granular, route-based code-splitting. Faster initial and HomeTimeline render is traded for greater overall app size, which is spread over 40 on-demand chunks and amortized over the length of the session. —
添加了细粒度、基于路由的代码拆分。更快的初始和主页时间线渲染与更大的应用程序大小相互交换,该大小分布在40个按需块上,并在会话的长度上分摊。

之前(左)和之后(右)代码拆分的时间轴。点击或触摸以放大。
Our original setup (above left) took over 5 seconds to load our main bundle, while after splitting out code by routes and common chunks (above right), it takes barely 3 seconds (on a simulated 3G network).
我们的原始设置(左上方)需要超过5秒钟来加载我们的主要捆绑包,而在按路由和常见块拆分代码之后(右上方),仅需3秒钟(在模拟的3G网络上)。
This was done early on in our performance focus sprints, but this single change made a huge difference when running Google’s Lighthouse web application auditing tool:
这是在我们的性能专注冲刺早期完成的,但是这个单一的改变在运行谷歌的Lighthouse网页应用审核工具时产生了巨大的影响
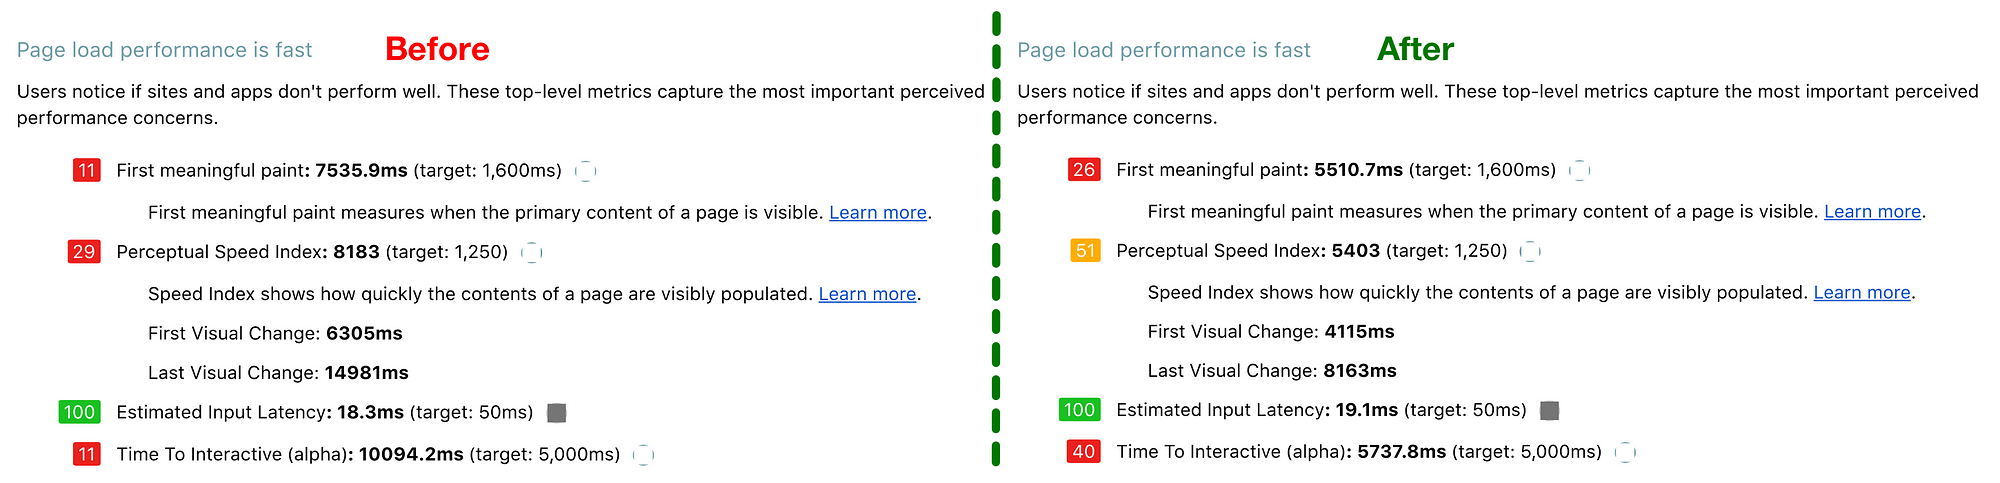
我们还通过谷歌的“Lighthouse”网站应用审计工具对之前(左)和之后(右)的网站进行了测试。
Avoid Functions that Cause Jank
避免引起卡顿的功能
Over many iterations of our infinite scrolling timelines, we used different ways to calculate your scroll position and direction to determine if we needed to ask the API for more Tweets to display. Up until recently, we were using react-waypoint, which worked well for us. However, in chasing the best possible performance for one of the main underlying components of our application, it just wasn’t fast enough.
在我们无限滚动的时间线的许多迭代中,我们使用了不同的方法来计算您的滚动位置和方向,以确定是否需要向API请求更多的推文来显示。直到最近,我们一直在使用react-waypoint,这对我们来说效果很好。然而,为了追求我们应用程序的一个主要基础组件的最佳性能,它并不够快。
Waypoints work by calculating many different heights, widths, and positions of elements in order to determine your current scroll position, how far from each end you are, and which direction you’re going. All of this information is useful, but since it’s done on every scroll event it comes at a cost: making those calculations causes jank–and lots of it.
航点通过计算元素的许多不同高度、宽度和位置来确定您当前的滚动位置,距离每个端点有多远以及您的滚动方向。所有这些信息都很有用,但由于在每次滚动事件中都要进行计算,这会带来一些问题:进行这些计算会导致卡顿,而且非常明显。
But first, we have to understand what the developer tools mean when they tell us that there is “jank”.
但首先,我们必须理解开发者工具在告诉我们有“卡顿”时是什么意思。
Most devices today refresh their screens 60 times a second. If there’s an animation or transition running, or the user is scrolling the pages, the browser needs to match the device’s refresh rate and put up 1 new picture, or frame, for each of those screen refreshes.
大多数设备今天每秒刷新屏幕60次。如果有动画或过渡正在运行,或者用户正在滚动页面,浏览器需要与设备的刷新率匹配,并为每个屏幕刷新放置1个新的图片或帧。Each of those frames has a budget of just over 16ms (1 second / 60 = 16.66ms). In reality, however, the browser has housekeeping work to do, so all of your work needs to be completed inside 10ms. When you fail to meet this budget the frame rate drops, and the content judders on screen. This is often referred to as jank, and it negatively impacts the user’s experience. — Paul Lewis on Rendering Performance
每个帧的预算只有略高于16毫秒(1秒/60=16.66毫秒)。然而,在现实中,浏览器还有一些内部工作要做,所以你的所有工作都需要在10毫秒内完成。当你无法满足这个预算时,帧率会下降,内容在屏幕上会出现抖动。这通常被称为卡顿,对用户的体验产生负面影响。- 保罗·刘易斯关于渲染性能的观点
Over time, we developed a new infinite scrolling component called VirtualScroller. With this new component, we know exactly what slice of Tweets are being rendered into a timeline at any given time, avoiding the need to make expensive calculations as to where we are visually.
随着时间的推移,我们开发了一个名为VirtualScroller的新的无限滚动组件。通过这个新组件,我们可以准确地知道在任何给定时间渲染到时间线中的推文片段,避免了需要进行昂贵的计算以确定我们在视觉上的位置。
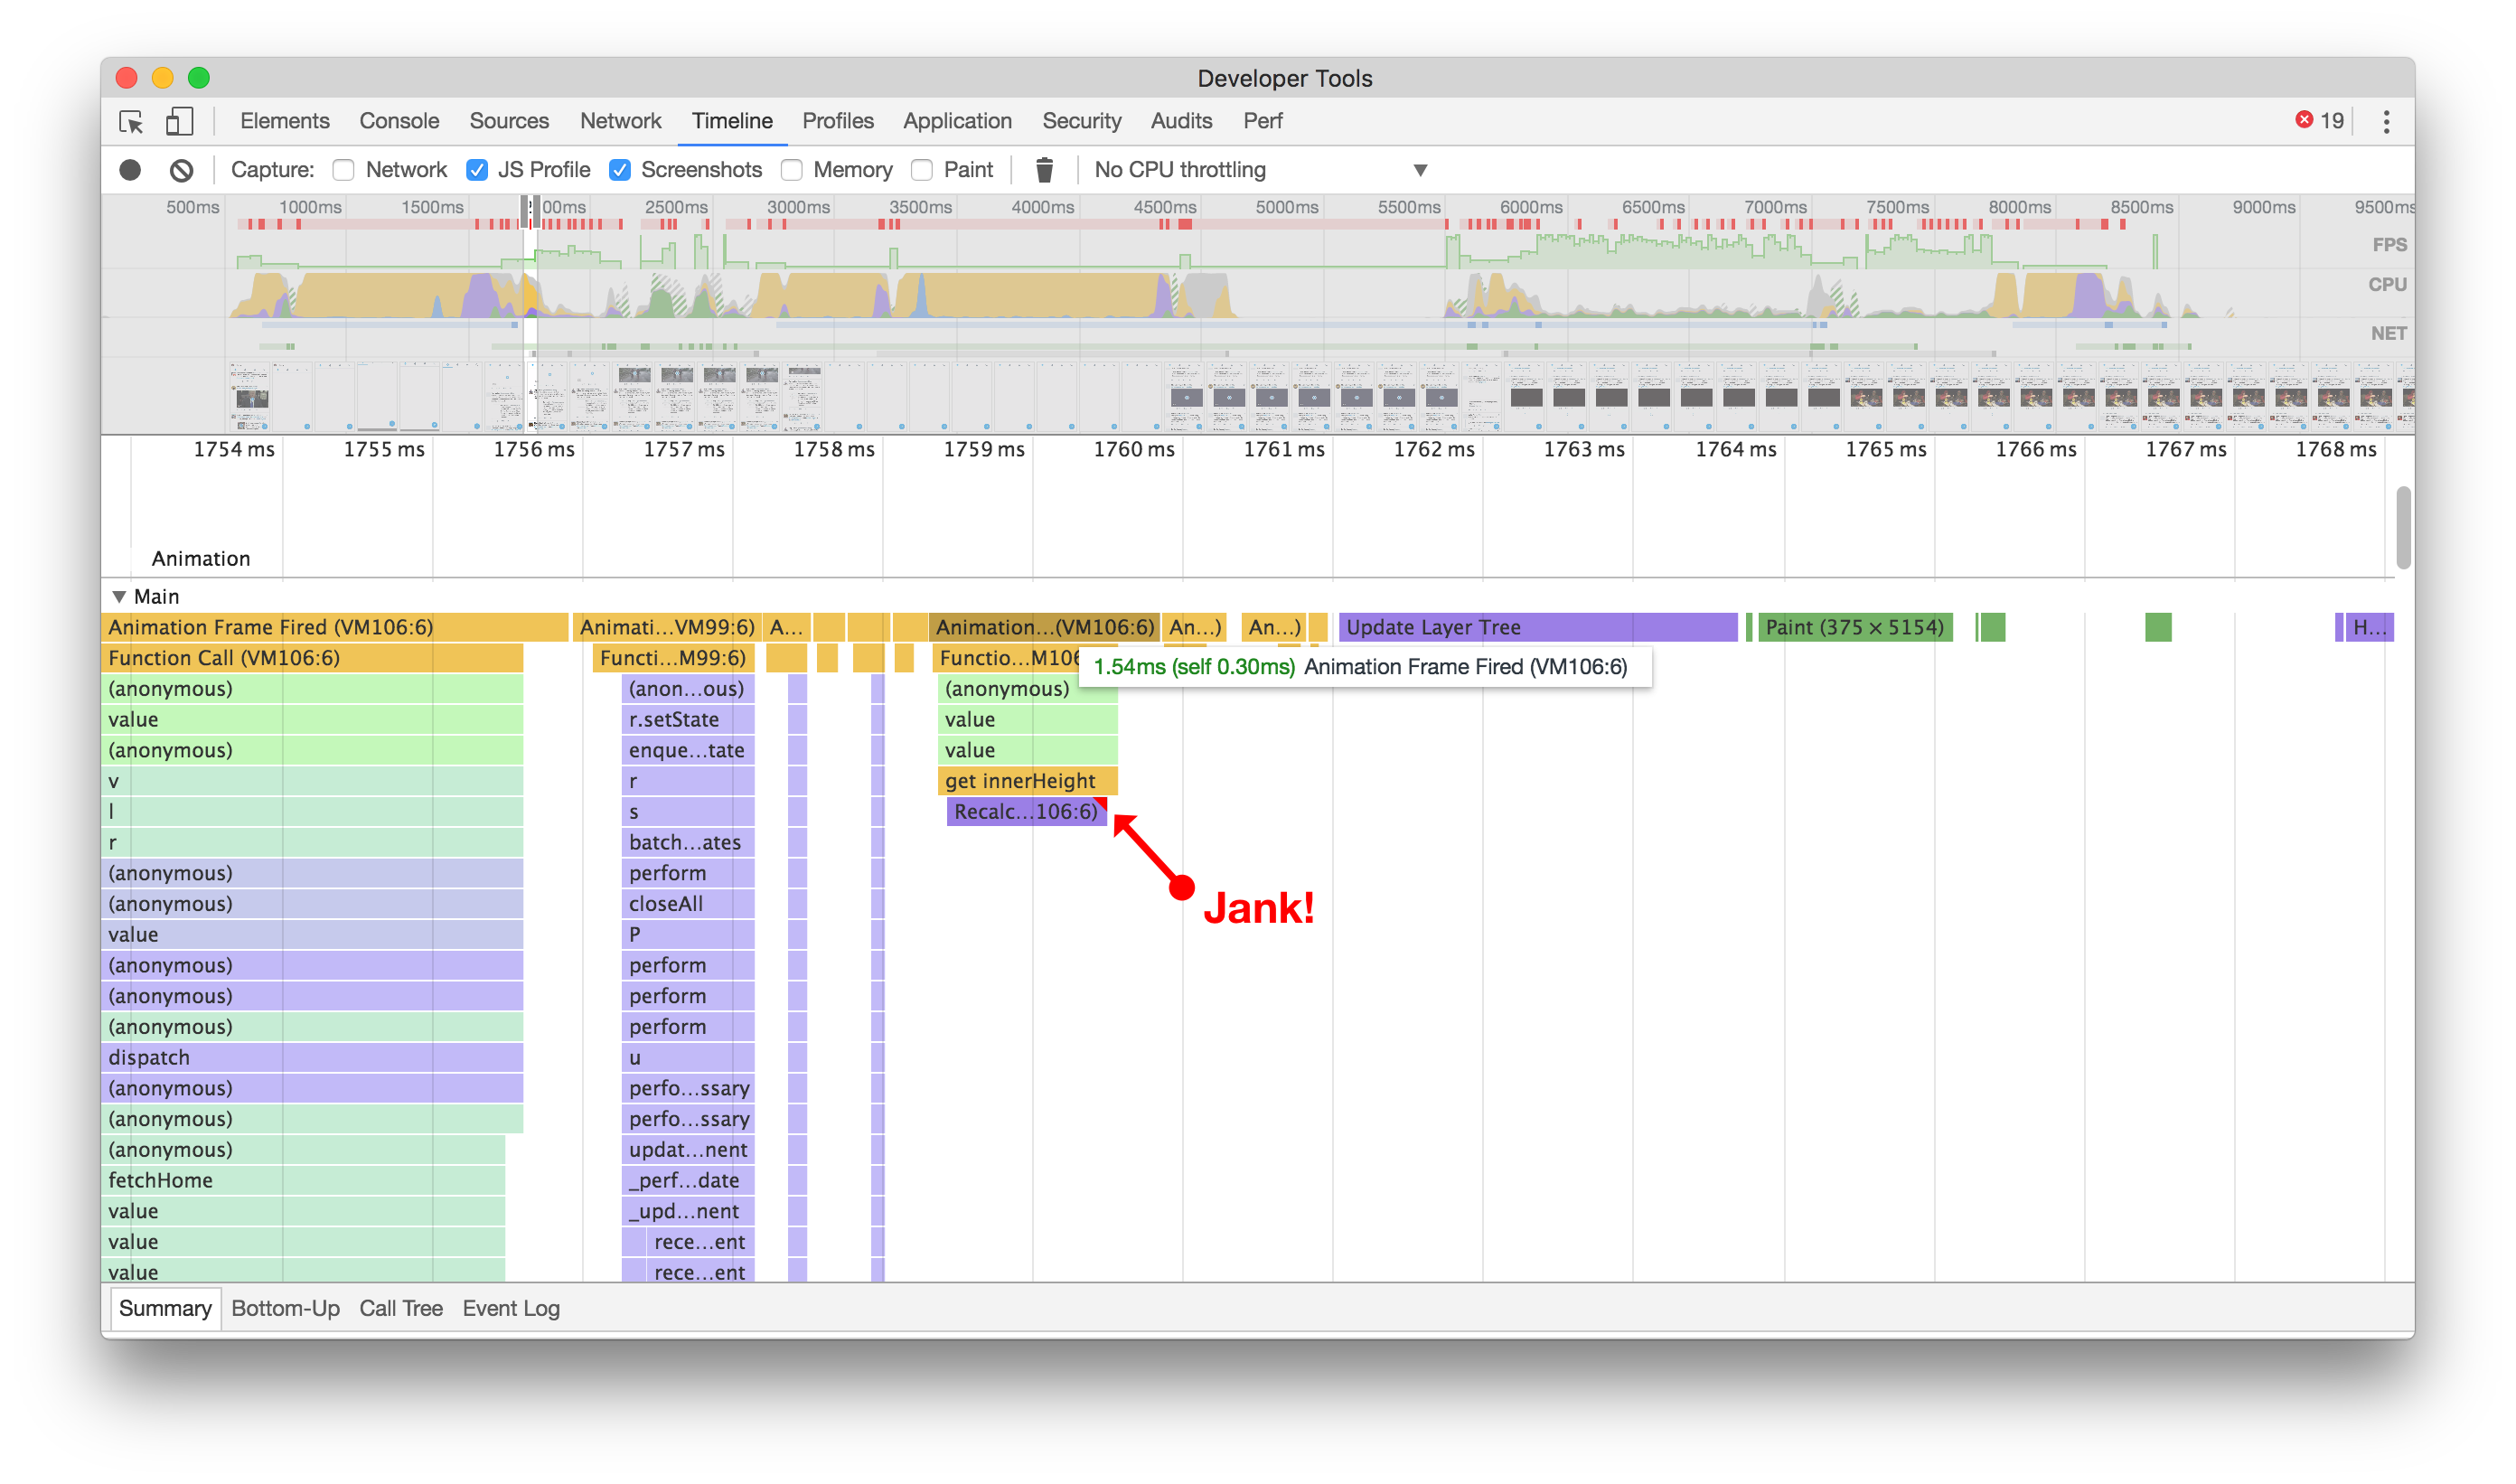
虽然看起来不起眼,但在滚动之前(左侧),我们会尝试计算各个元素的高度,从而导致渲染卡顿。在之后(右侧),我们不再出现卡顿,并且在快速滚动时间轴时减少了卡顿。点击或轻触进行缩放。
By avoiding function calls that cause extra jank, scrolling a timeline of Tweets looks and feels more seamless, giving us a much more rich, almost native experience. While it can always be better, this change makes a noticeable improvement to the smoothness of scrolling timelines. It was a good reminder that every little bit counts when looking at performance.
通过避免导致额外卡顿的函数调用,滚动推文时间线的外观和感觉更加流畅,给我们带来了更加丰富、几乎原生的体验。虽然总是可以做得更好,但这个改变明显提升了滚动时间线的流畅度。这是一个很好的提醒,性能方面每一点都很重要。
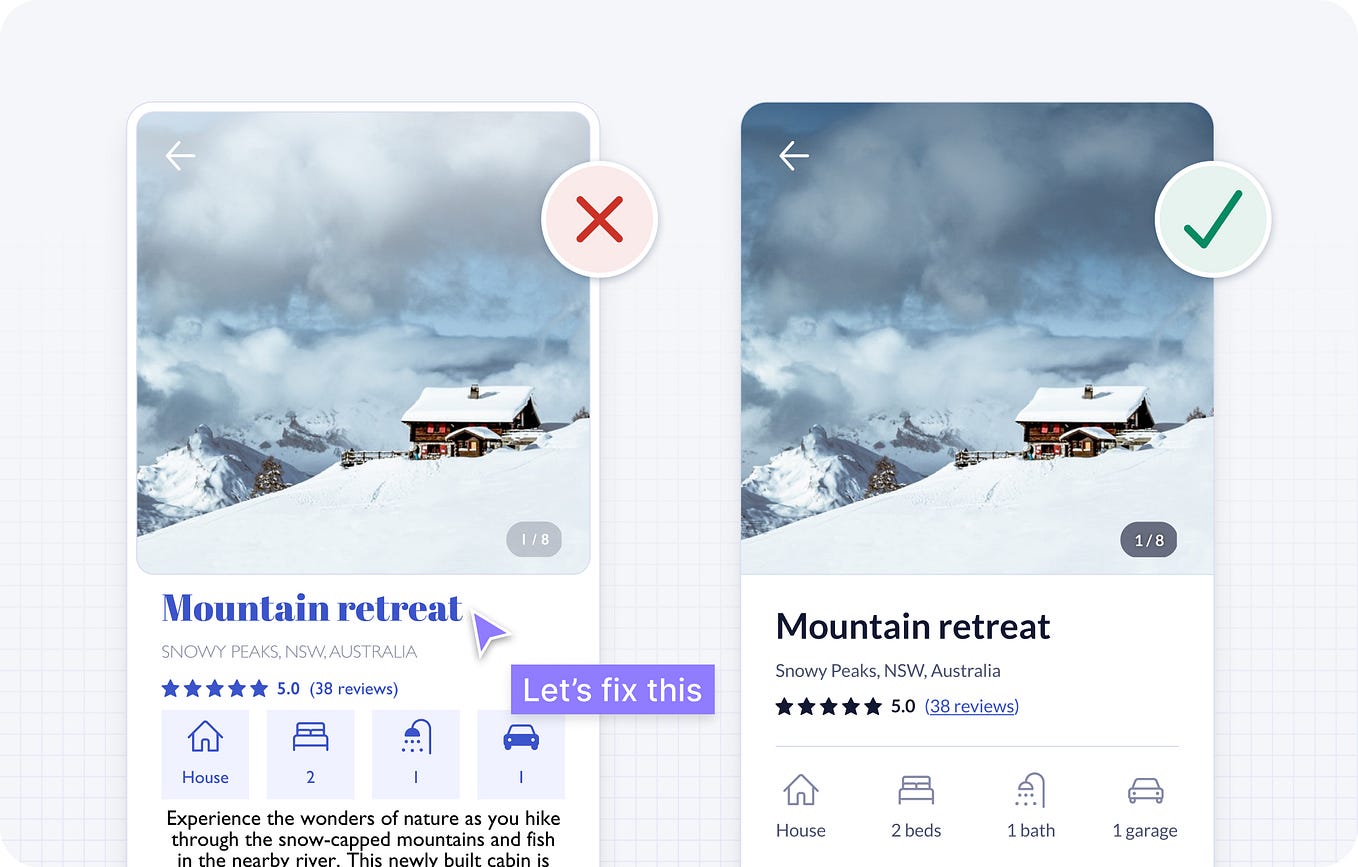
Use Smaller Images 使用较小的图片
We first started pushing to use less bandwidth on Twitter Lite by working with multiple teams to get new and smaller sizes of images available from our CDNs. It turns out, that by reducing the size of the images we were rendering to be only what we absolutely needed (both in terms of dimensions and quality), we found that not only did we reduce bandwidth usage, but that we were also able to increase performance in the browser, especially while scrolling through image-heavy timelines of Tweets.
我们首先开始通过与多个团队合作,从我们的CDN中获取新的、更小的图像尺寸,以减少在Twitter Lite上使用的带宽。事实证明,通过减小我们渲染的图像尺寸,使其仅包含我们绝对需要的内容(无论是尺寸还是质量),我们不仅减少了带宽的使用,而且还能提高浏览器的性能,特别是在浏览图像密集的推文时间轴时。
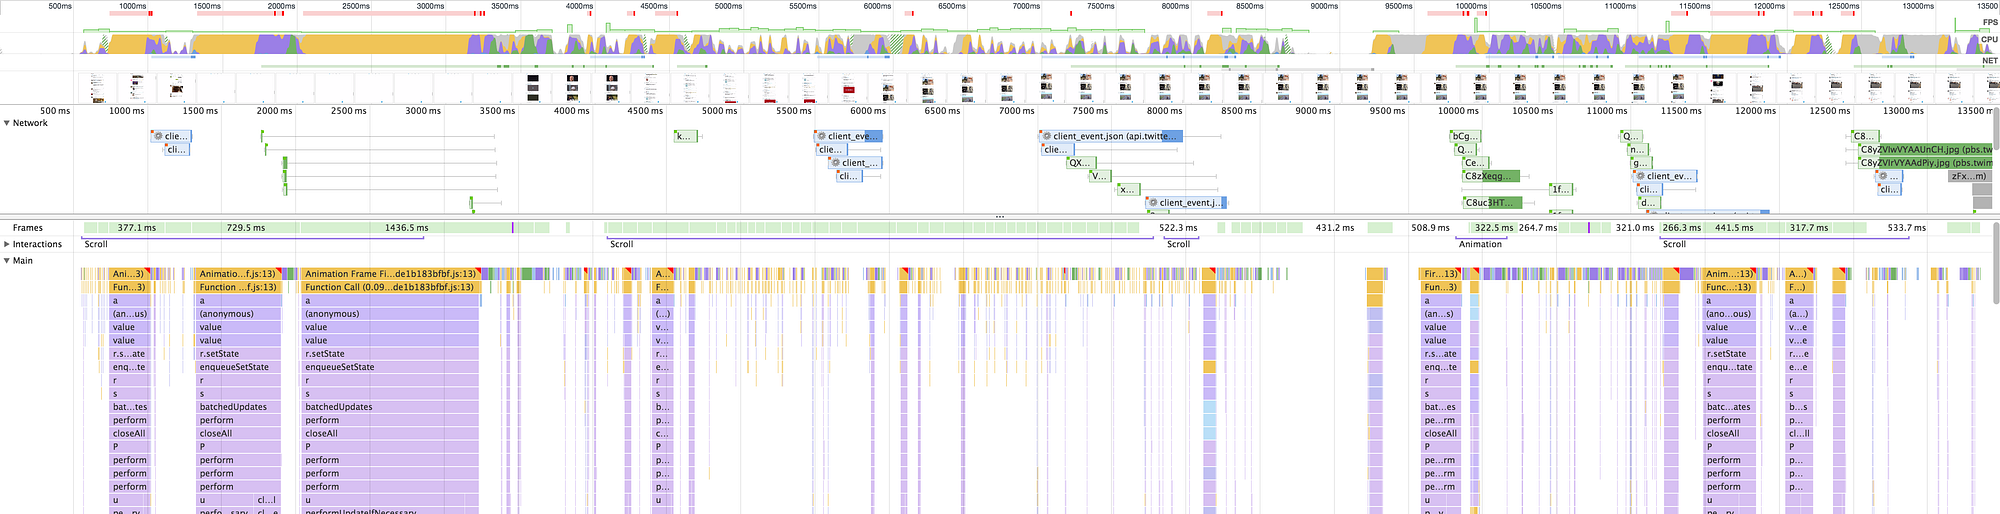
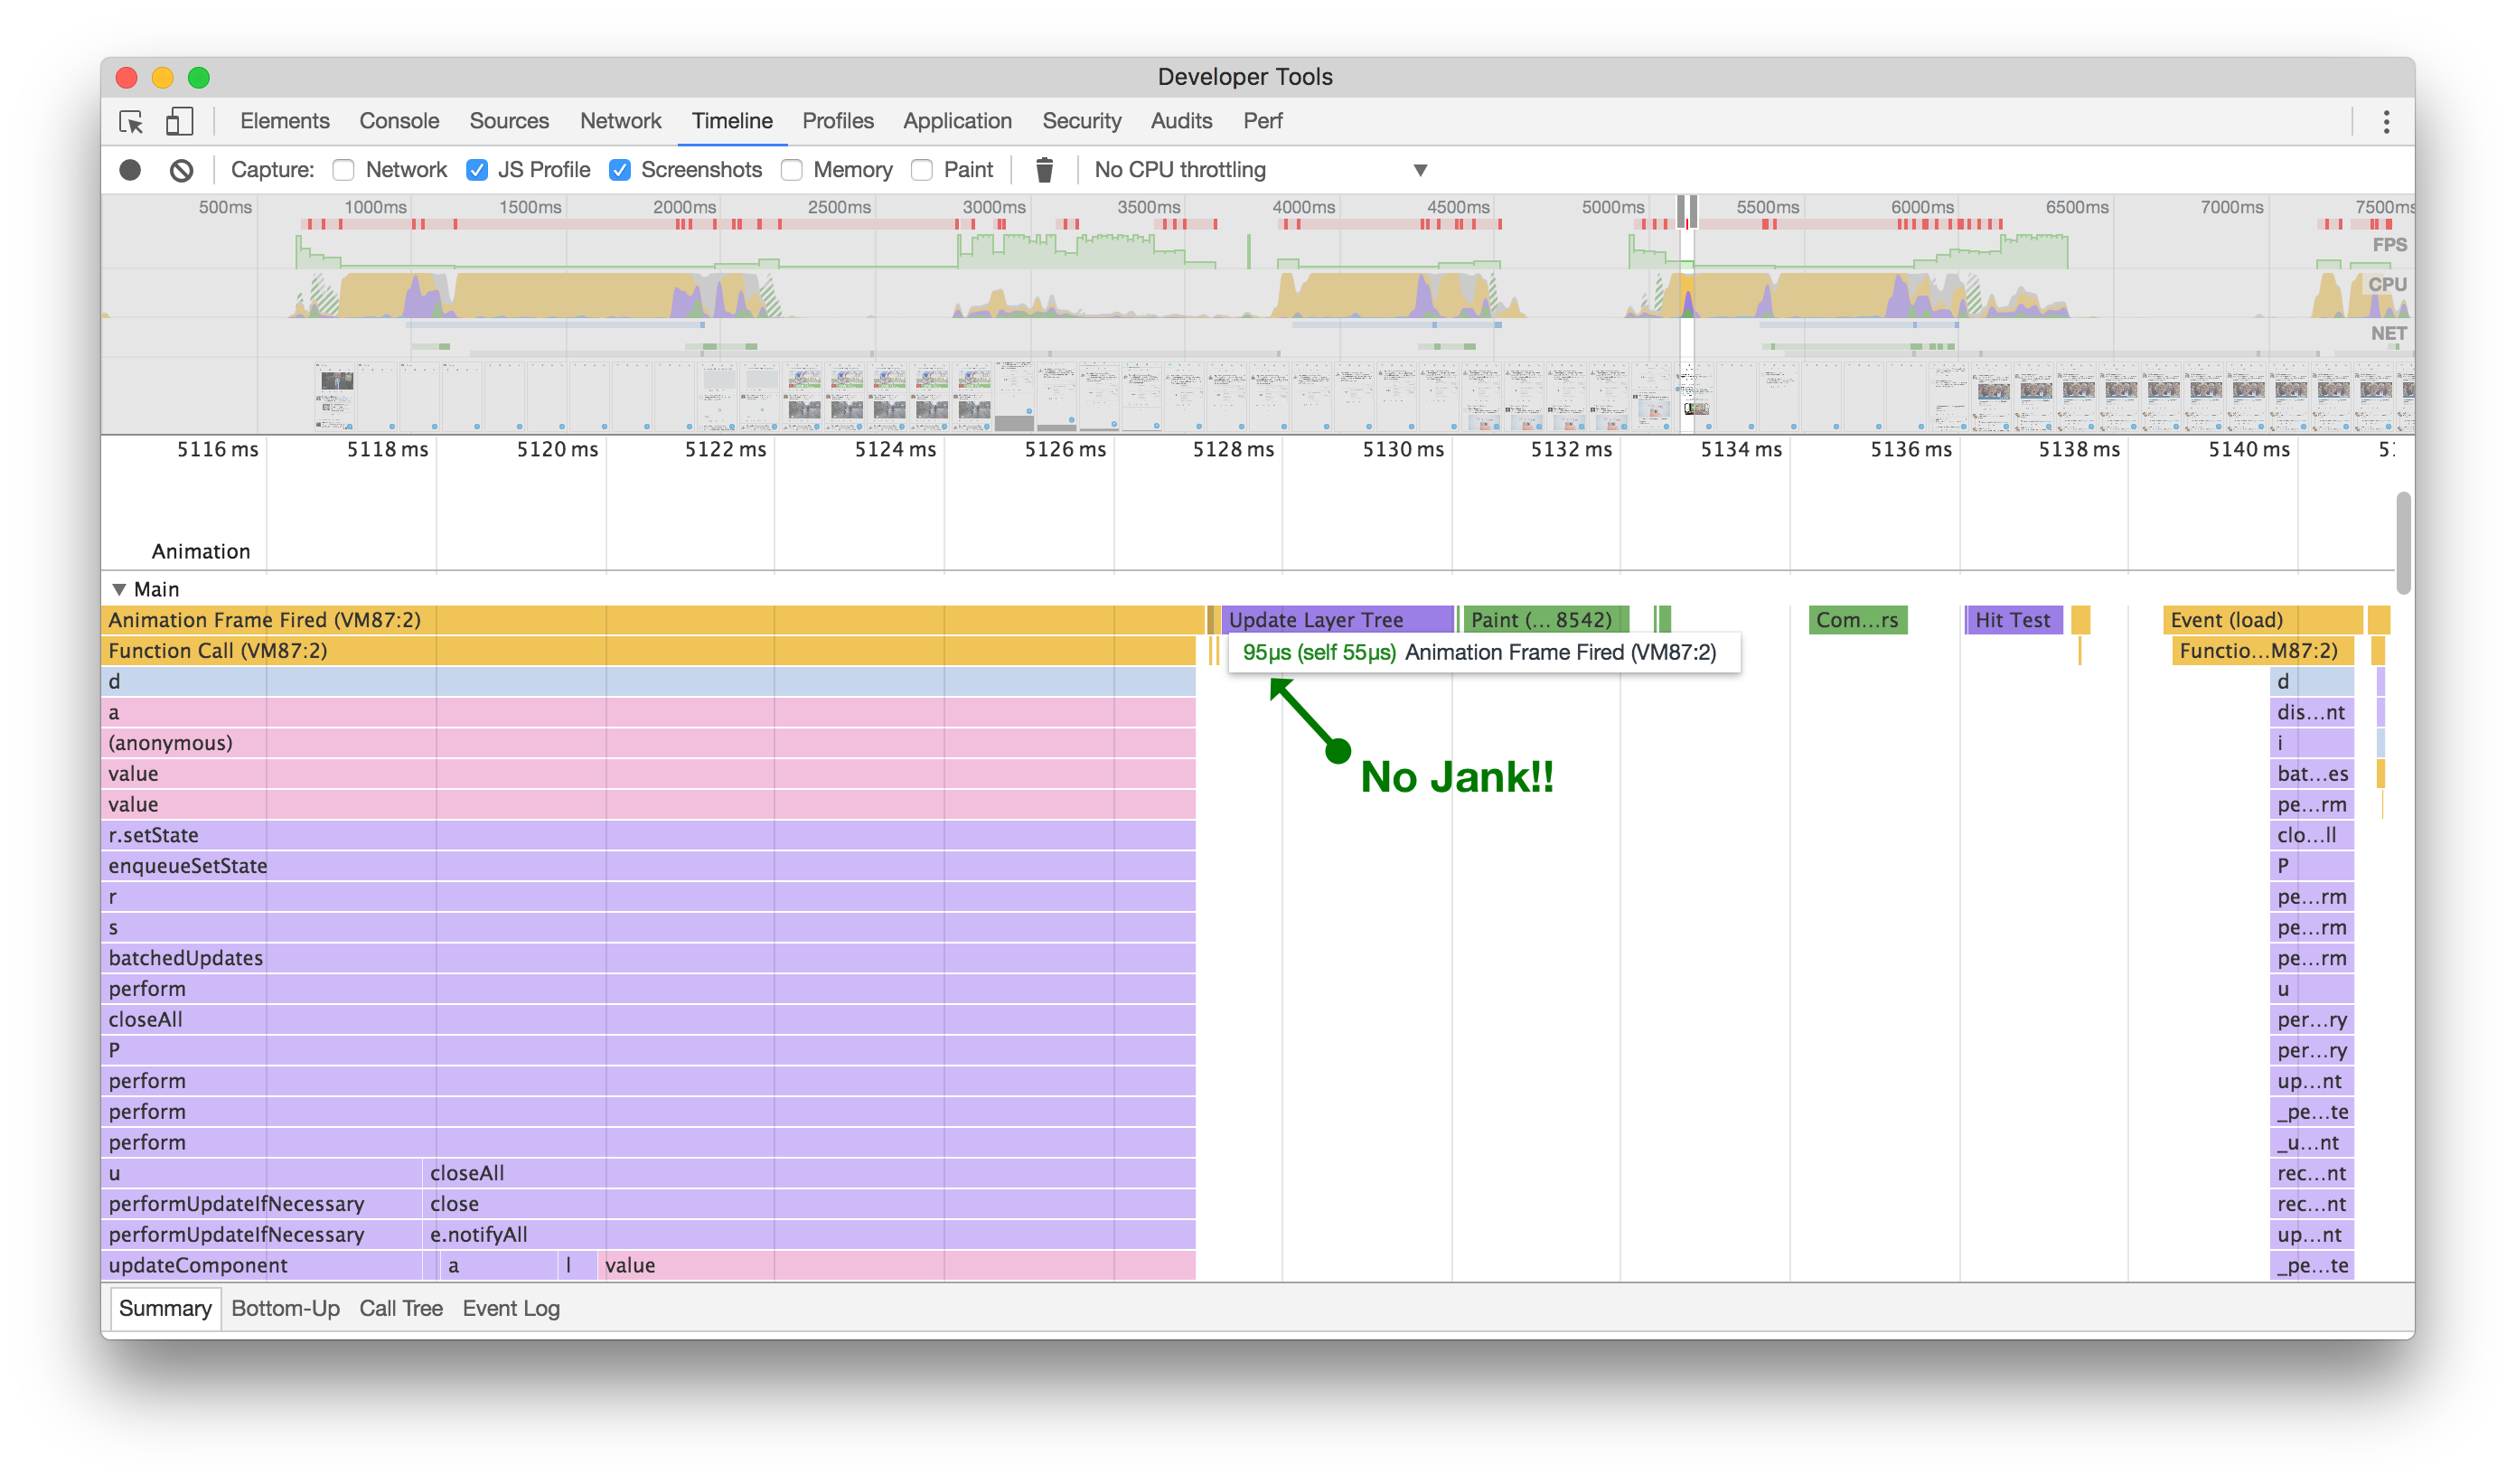
In order to determine how much better smaller images are for performance, we can look at the Raster timeline in Chrome Developer Tools. Before we reduced the size of images, it could take 300ms or more just to decode a single image, as shown in the timeline recording below on the left. This is the processing time after an image has been downloaded, but before it can be displayed on the page.
为了确定较小图像对性能的改进有多大,我们可以查看Chrome开发者工具中的光栅时间轴。在我们减小图像尺寸之前,解码单个图像可能需要300毫秒或更长时间,如下图所示。这是图像下载后,在其能够显示在页面上之前的处理时间。
When you’re scrolling a page and aiming for the 60 frame-per-second rendering standard, we want to keep as much processing as possible under 16.667ms (1 frame). It’s taking us nearly 18 frames just to get a single image rendered into the viewport, which is too many. One other thing to note in the timeline: you can see that the Main timeline is mostly blocked from continuing until this image has finished decoding (as shown by the whitespace). This means we’ve got quite a performance bottleneck here!
当您滚动页面并且目标是每秒60帧的渲染标准时,我们希望尽可能将处理保持在16.667毫秒(1帧)以下。我们需要近18帧的时间才能将单个图像渲染到视口中,这太多了。在时间轴中还有一件事要注意:您可以看到主时间轴在此图像完成解码之前大部分时间都被阻塞(如空白所示)。这意味着我们在这里存在相当大的性能瓶颈!
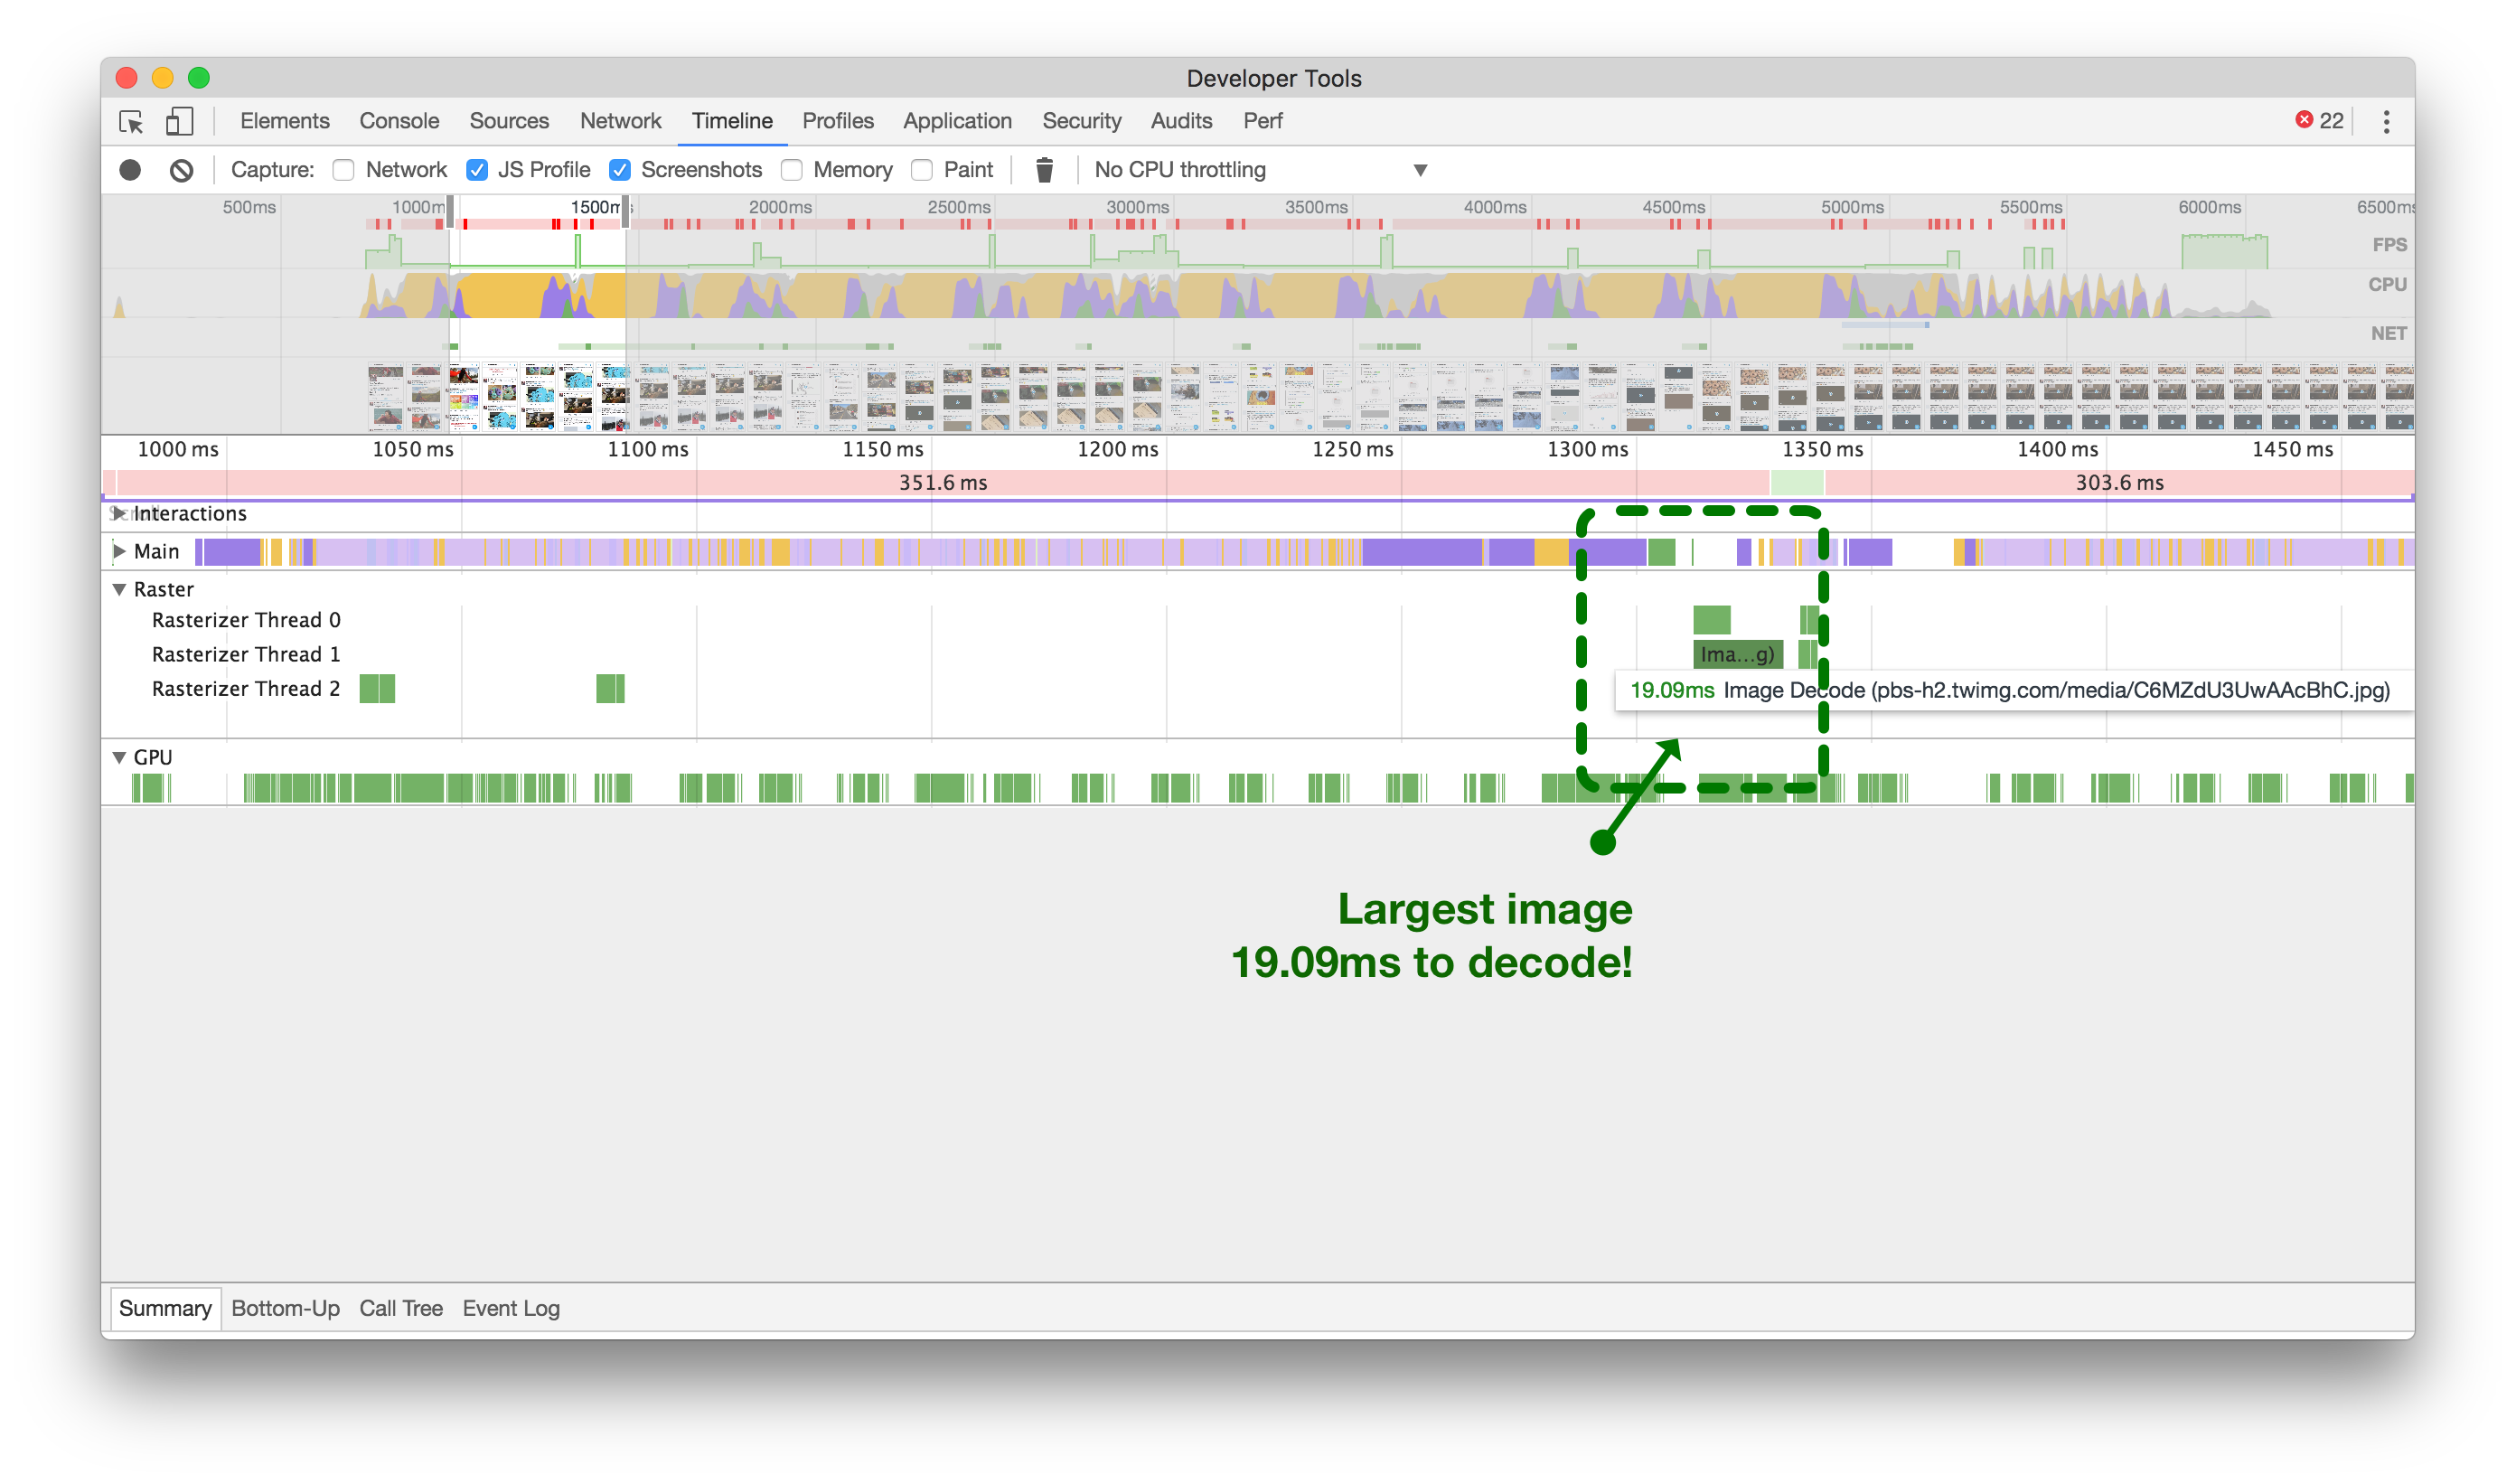
大图(左侧)可能会阻塞主线程,导致停顿18帧。小图(右侧)只需大约1帧。点击或轻触进行缩放。
Now, after we’ve reduced the size of our images (above, right), we’re looking at just over a single frame to decode our largest images.
现在,我们已经缩小了图像的尺寸(如上图右侧),我们只需要解码我们最大图像的一个多余的帧。
Optimizing React 优化React
Make use of the shouldComponentUpdate method
利用 shouldComponentUpdate method
A common tip for optimizing the performance of React applications is to use the shouldComponentUpdate method. We try to do this wherever possible, but sometimes things slip through the cracks.
优化React应用程序性能的常见技巧是使用 shouldComponentUpdate 方法。我们尽可能地在各个地方使用它,但有时会有一些遗漏。

喜欢第一条推文会导致它和下面的整个对话重新渲染!
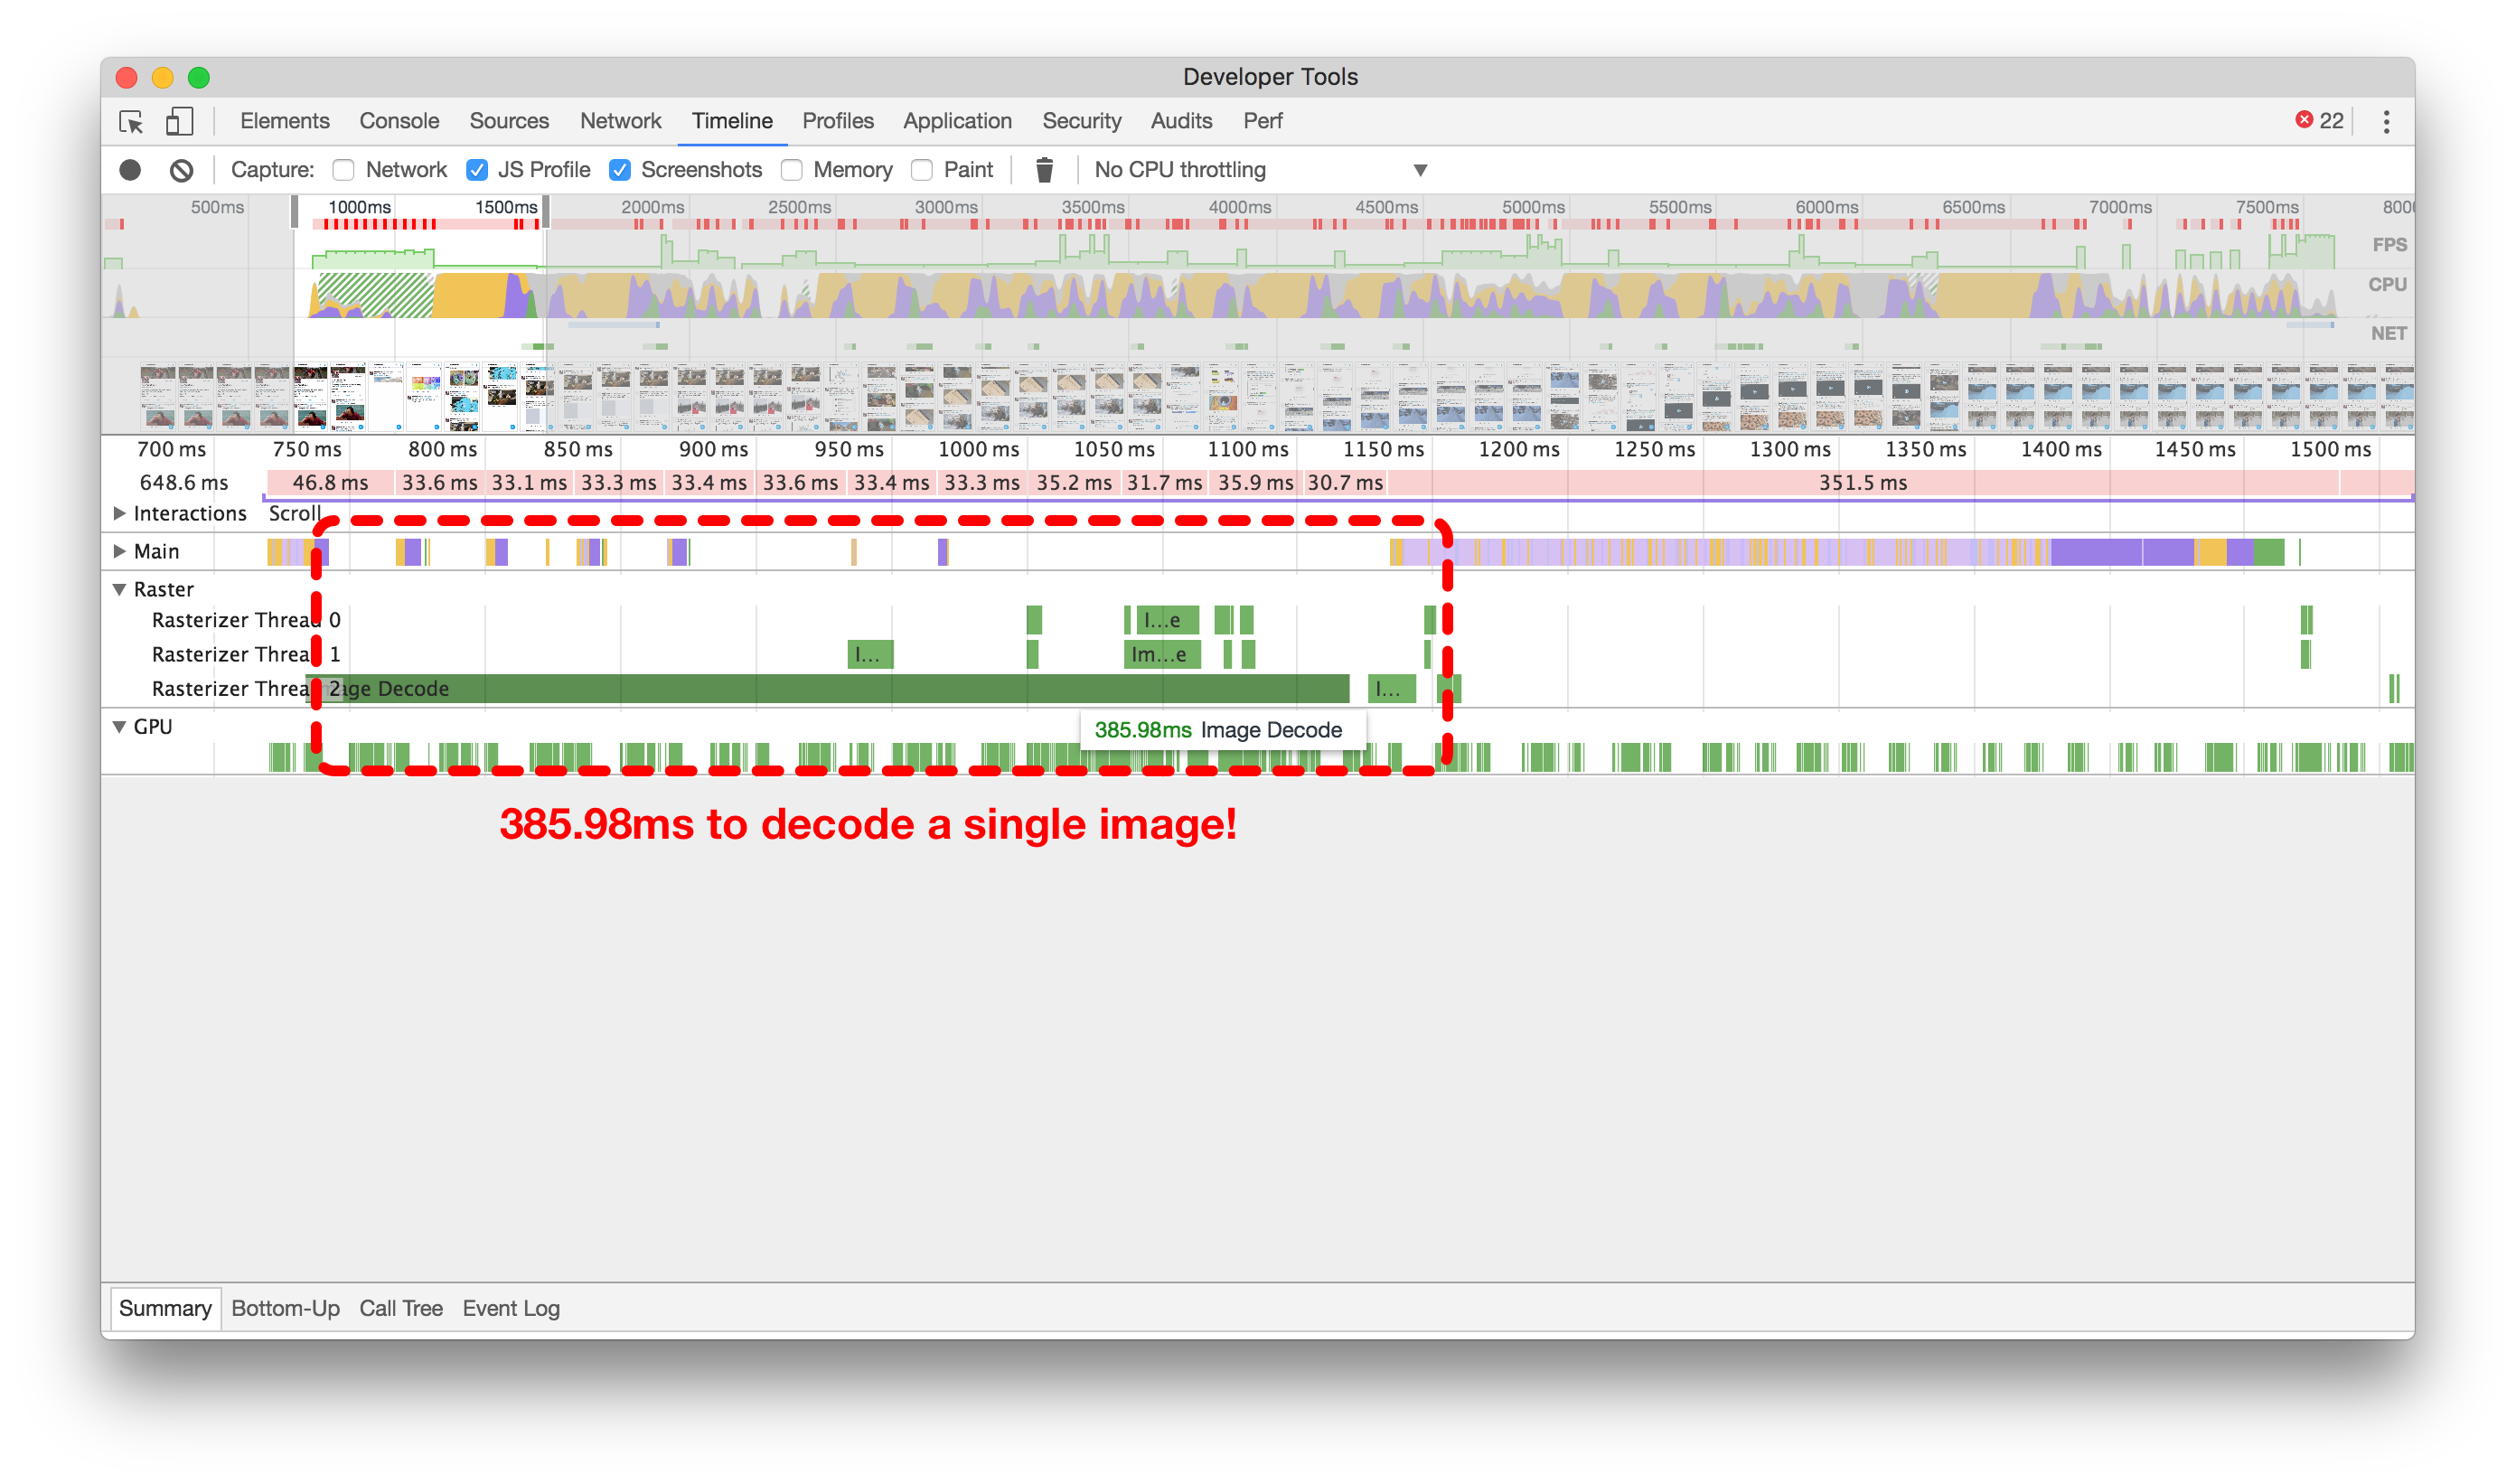
Here’s an example of a component that was always updating: When clicking the heart icon to like a Tweet in the home timeline, any Conversation component on screen would also re-render. In the animated example, you should see green boxes highlighting where the browser has to re-paint because we’re making the entire Conversation component below the Tweet we’re acting on update.
这是一个始终在更新的组件的示例:当在主页时间线上点击心形图标来喜欢一条推文时,屏幕上的任何 Conversation 组件也会重新渲染。在动画示例中,您应该看到绿色框突出显示浏览器需要重新绘制的位置,因为我们正在更新位于我们操作的推文下方的整个 Conversation 组件。
Below, you’ll see two flame graphs of this action. Without shouldComponentUpdate (left), we can see its entire tree updated and re-rendered, just to change the color of a heart somewhere else on the screen. After adding shouldComponentUpdate (right), we prevent the entire tree from updating and prevent wasting more than one-tenth of a second running unnecessary processing.
下面,您将看到这个操作的两个火焰图。没有 shouldComponentUpdate (左边),我们可以看到整个树被更新和重新渲染,只是为了改变屏幕上其他地方的一个心形的颜色。添加 shouldComponentUpdate (右边)后,我们阻止整个树的更新,避免浪费超过十分之一秒的不必要处理。
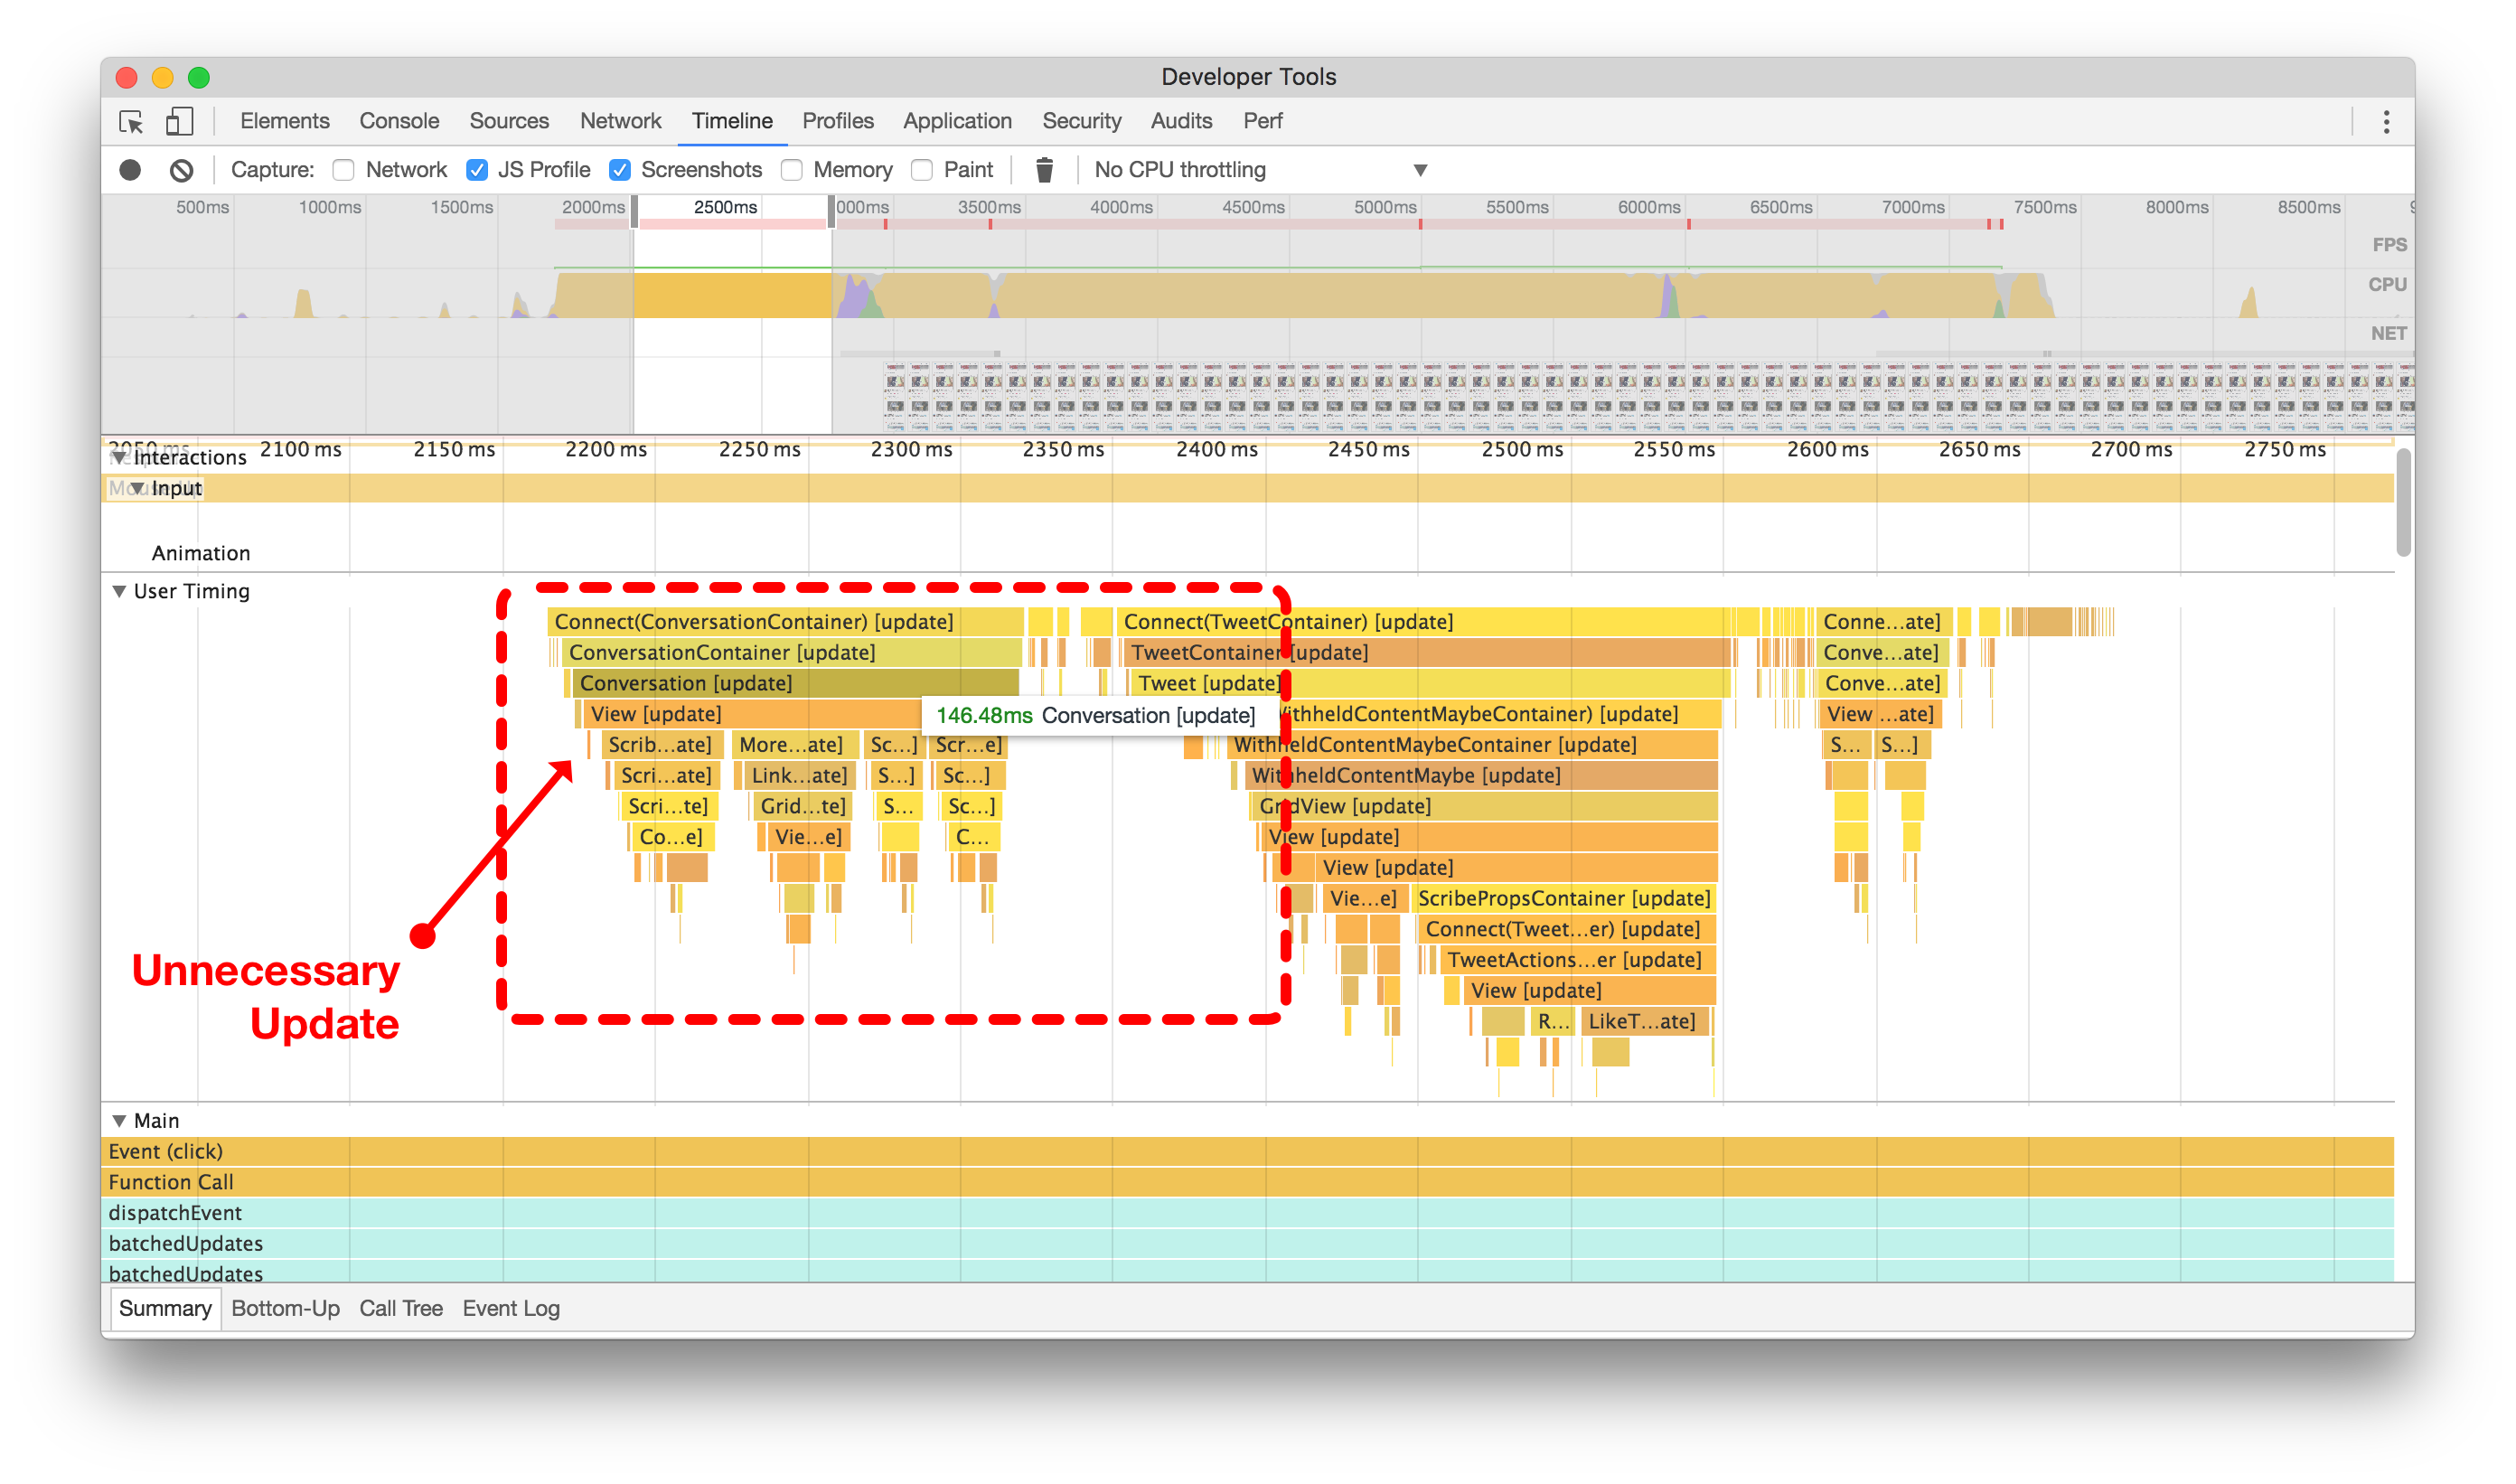
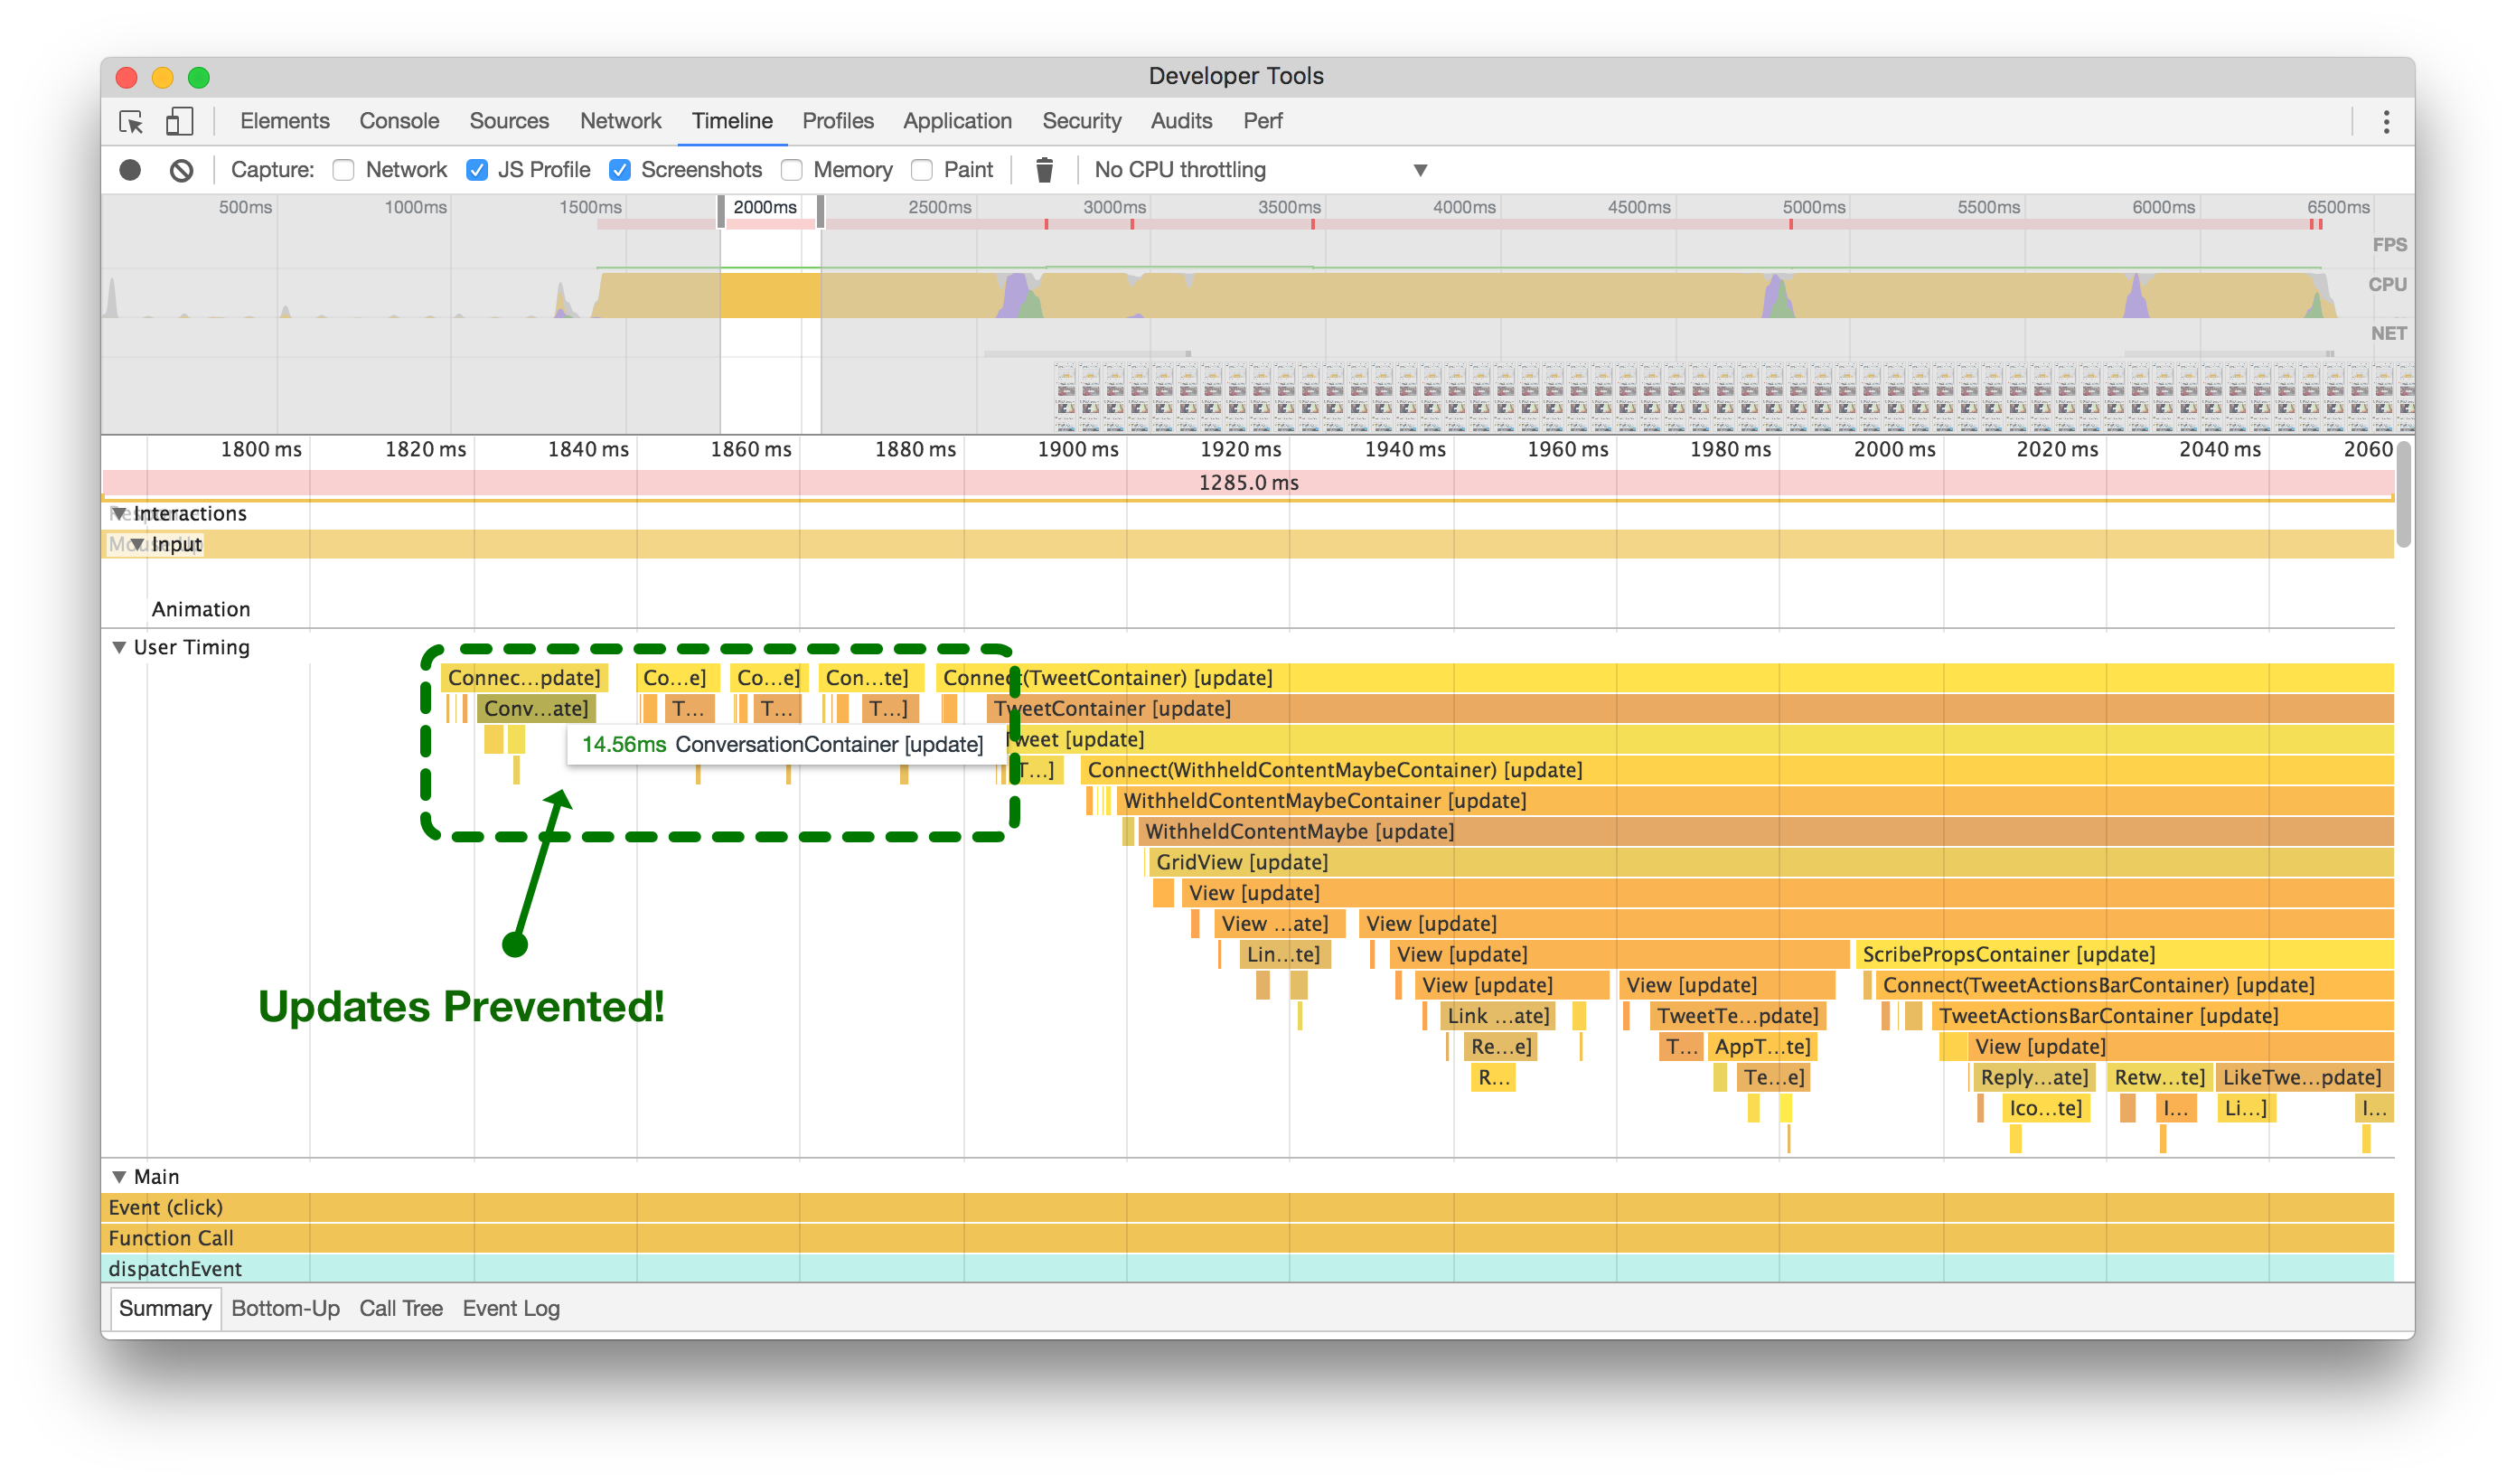
在添加shouldComponentUpdate逻辑之前(左侧),当喜欢一个无关的推文时,整个对话会更新和重新渲染。在添加shouldComponentUpdate逻辑之后(右侧),您可以看到组件及其子组件被阻止浪费CPU周期。点击或触摸进行放大。
Defer Unnecessary Work until componentDidMount
延迟不必要的工作直到componentDidMount
This change may seem like a bit of a no-brainer, but it’s easy to forget about the little things when developing a large application like Twitter Lite.
这个改变可能看起来很简单,但在开发像Twitter Lite这样的大型应用程序时,很容易忽略一些小细节。
We found that we had a lot of places in our code where we were doing expensive calculations for the sake of analytics during the componentWillMount React lifecycle method. Every time we did this, we blocked rendering of components a little more. 20ms here, 90ms there, it all adds up quickly. Originally, we were trying to record which tweets were being rendered to our data analytics service in componentWillMount, before they were actually rendered (timeline below, left).
我们发现在代码中有很多地方,在React生命周期方法期间为了分析而进行昂贵的计算。每次这样做,都会稍微阻塞组件的渲染。这里20毫秒,那里90毫秒,很快就会累积起来。最初,我们试图记录哪些推文在实际渲染之前被渲染到我们的数据分析服务中(下面的时间轴,左侧)。
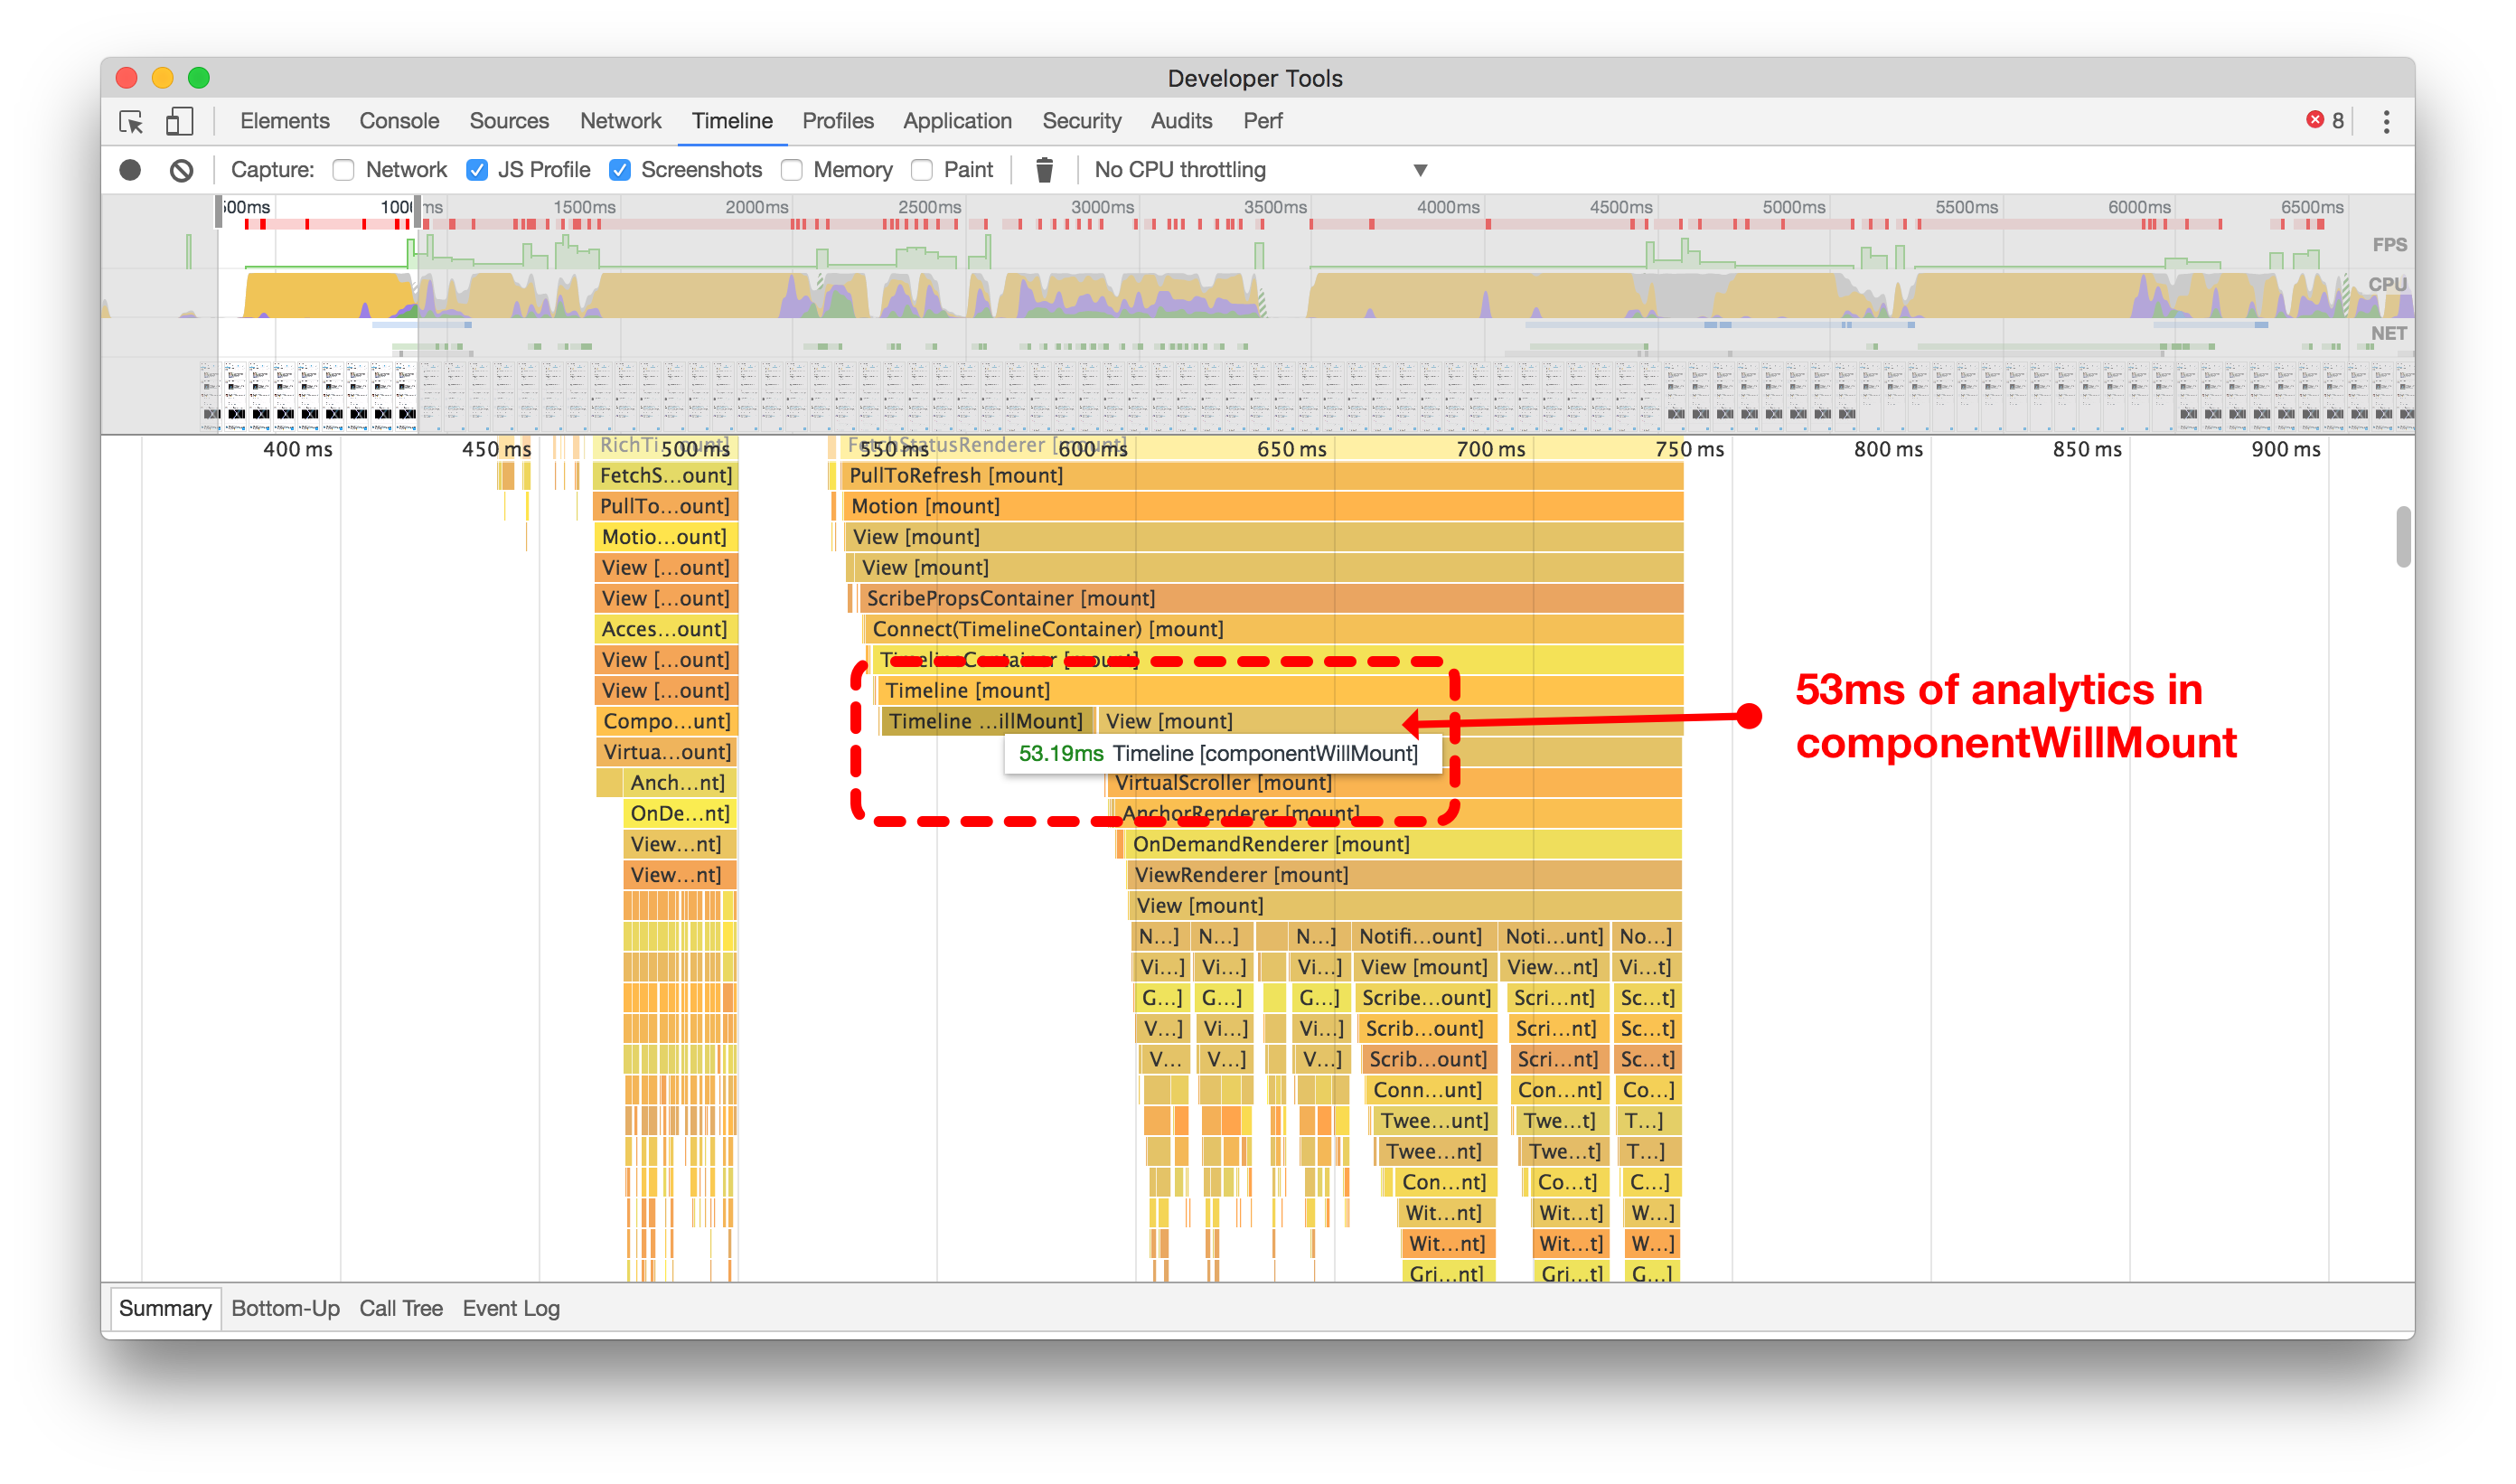
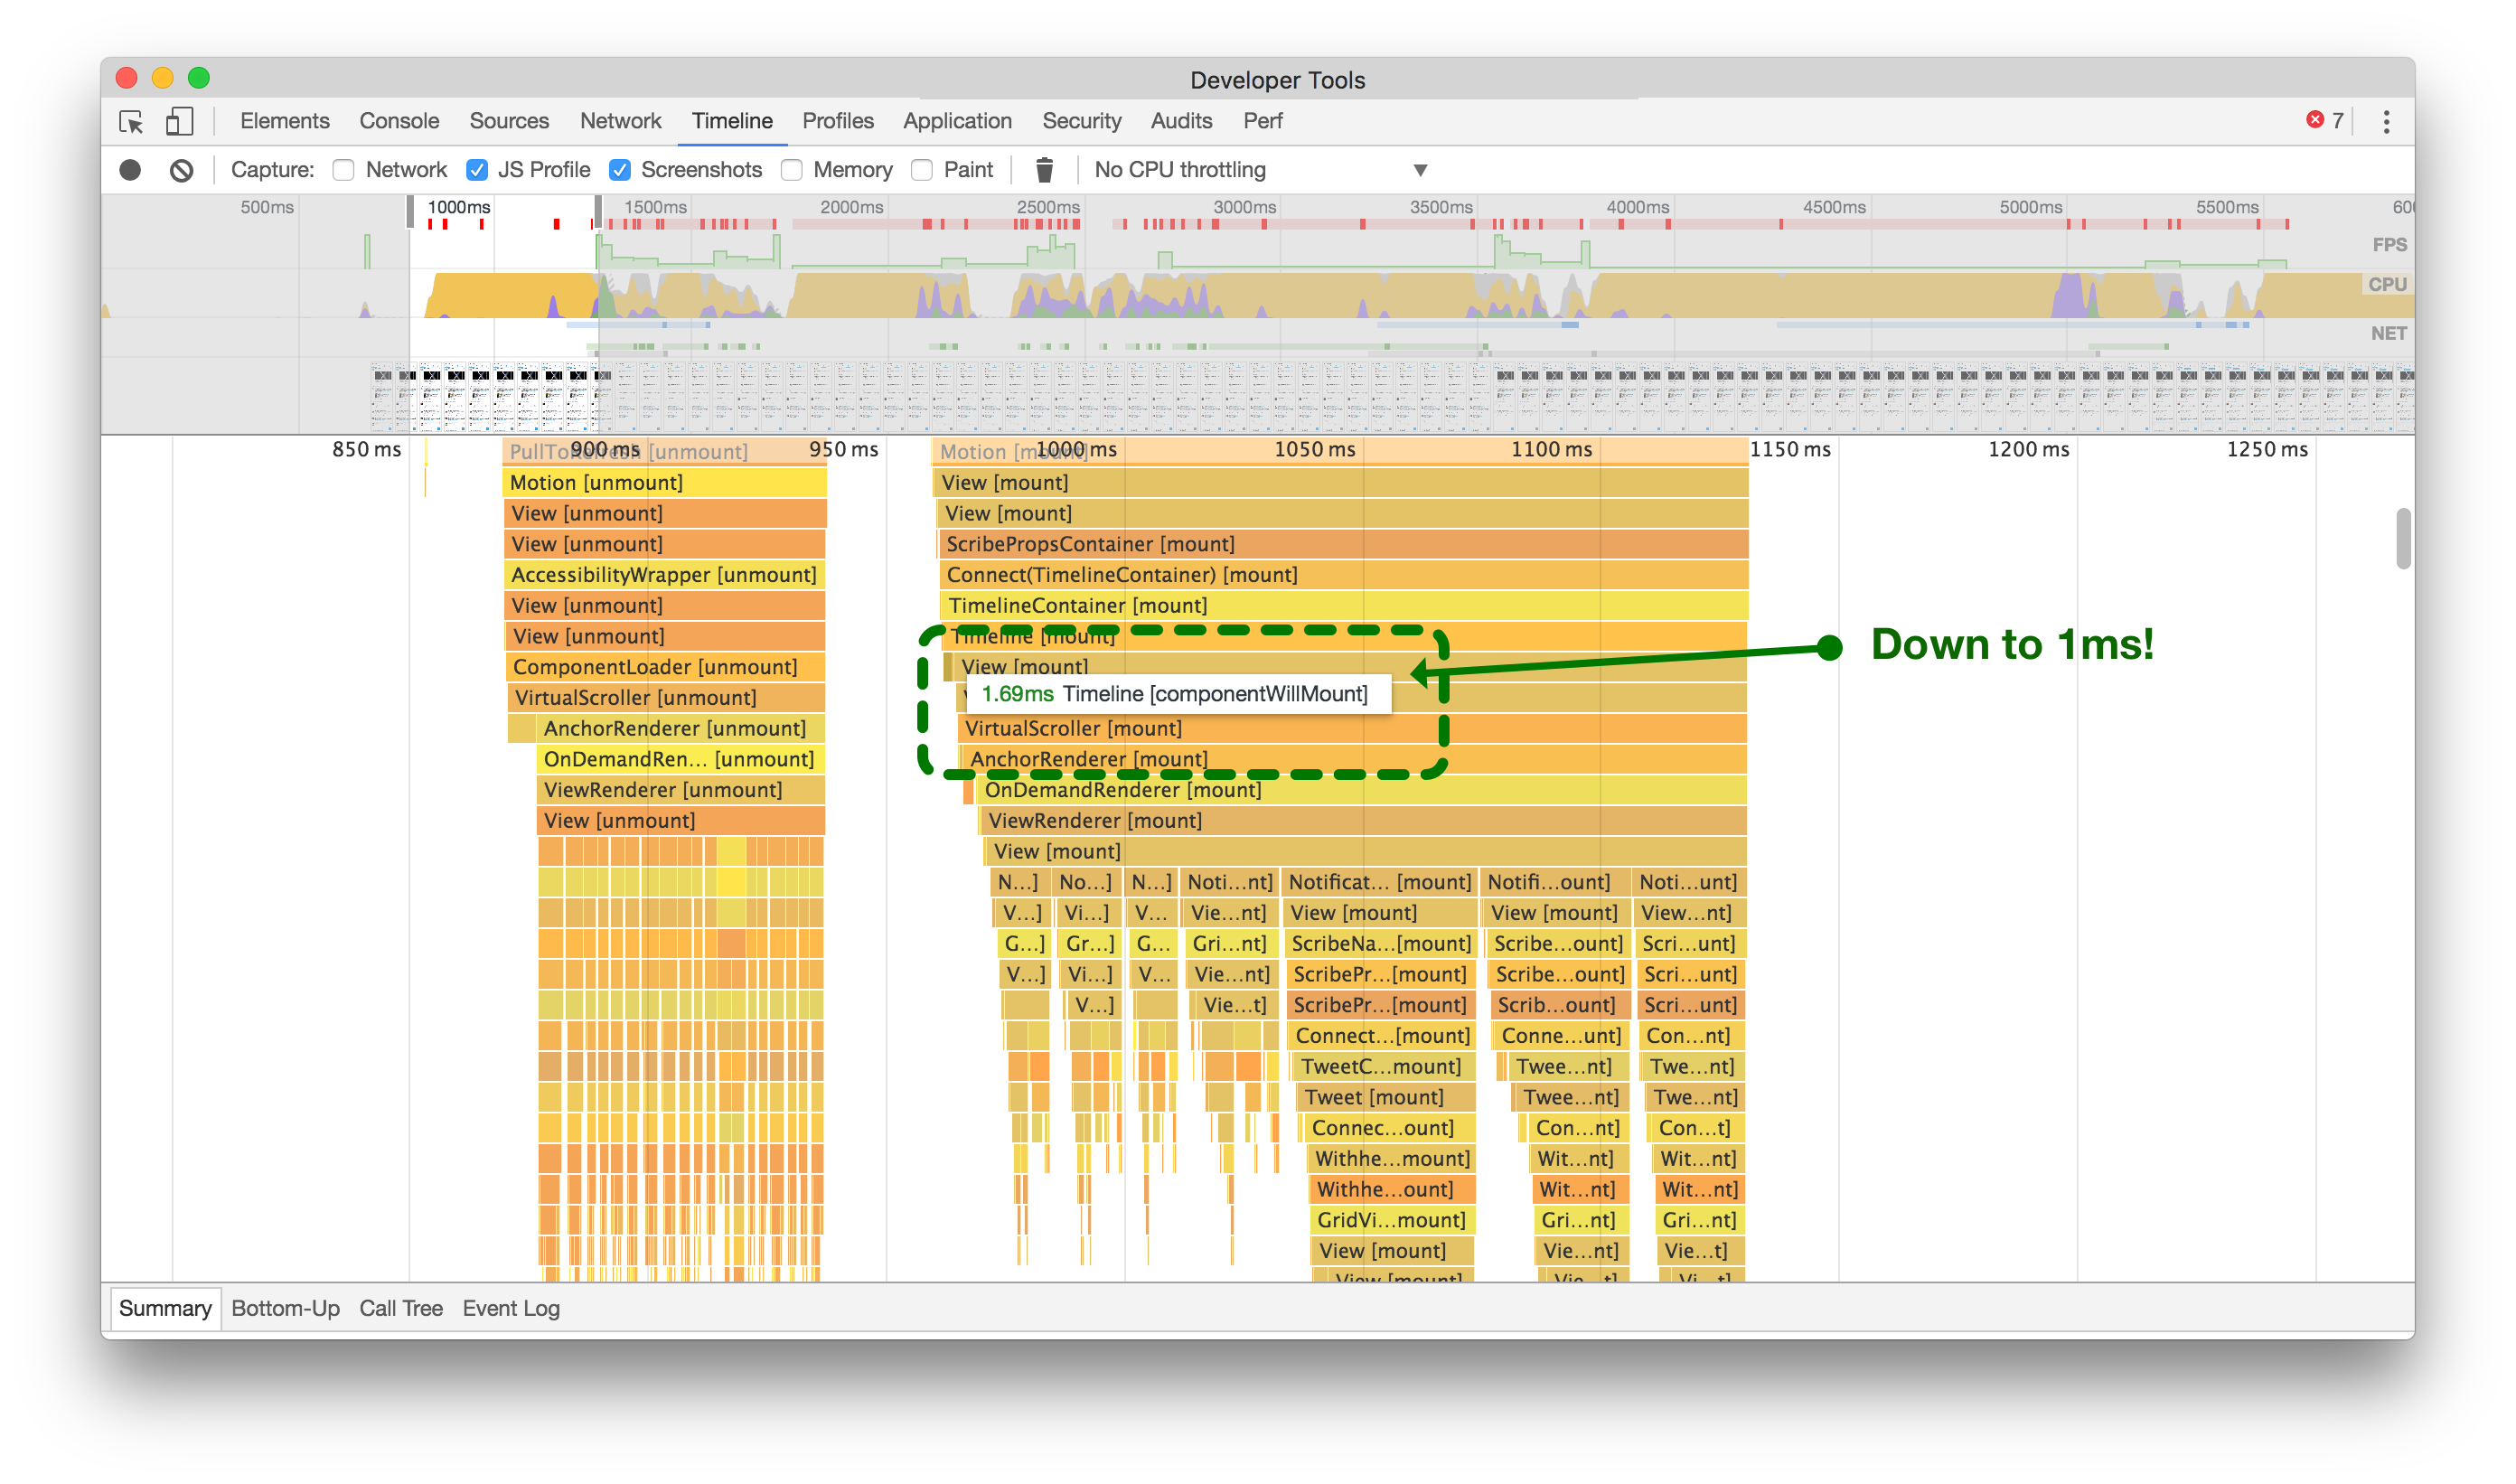
通过将非必要的代码路径从`componentWillMount`延迟到`componentDidMount`,我们节省了大量时间来渲染推文到屏幕上。点击或轻触进行缩放。
By moving that calculation and network call to the React component’s componentDidMount method, we unblocked the main thread and reduced unwanted jank when rendering our components (above right).
通过将计算和网络调用移动到React组件的 componentDidMount 方法中,我们解除了主线程的阻塞,并减少了在渲染组件时产生的不必要的卡顿(如上图右侧)。
Avoid dangerouslySetInnerHTML
避免使用dangerouslySetInnerHTML
In Twitter Lite, we use SVG icons, as they’re the most portable and scalable option available to us. Unfortunately, in older versions of React, most SVG attributes were not supported when creating elements from components. So, when we first started writing the application, we were forced to use dangerouslySetInnerHTML in order to use SVG icons as React components.
在Twitter Lite中,我们使用SVG图标,因为它们是我们可用的最便携和可伸缩的选项。不幸的是,在旧版本的React中,大多数SVG属性在从组件创建元素时不受支持。因此,当我们开始编写应用程序时,我们被迫使用 dangerouslySetInnerHTML 来使用SVG图标作为React组件。
For example, our original HeartIcon looked something like this:
例如,我们原来的心形图标看起来像这样:
Not only is it discouraged to use dangerouslySetInnerHTML, but it turns out that it’s actually a source of slowness when mounting and rendering.
不仅不鼓励使用 dangerouslySetInnerHTML ,而且事实证明,在挂载和渲染时它实际上会导致速度变慢。
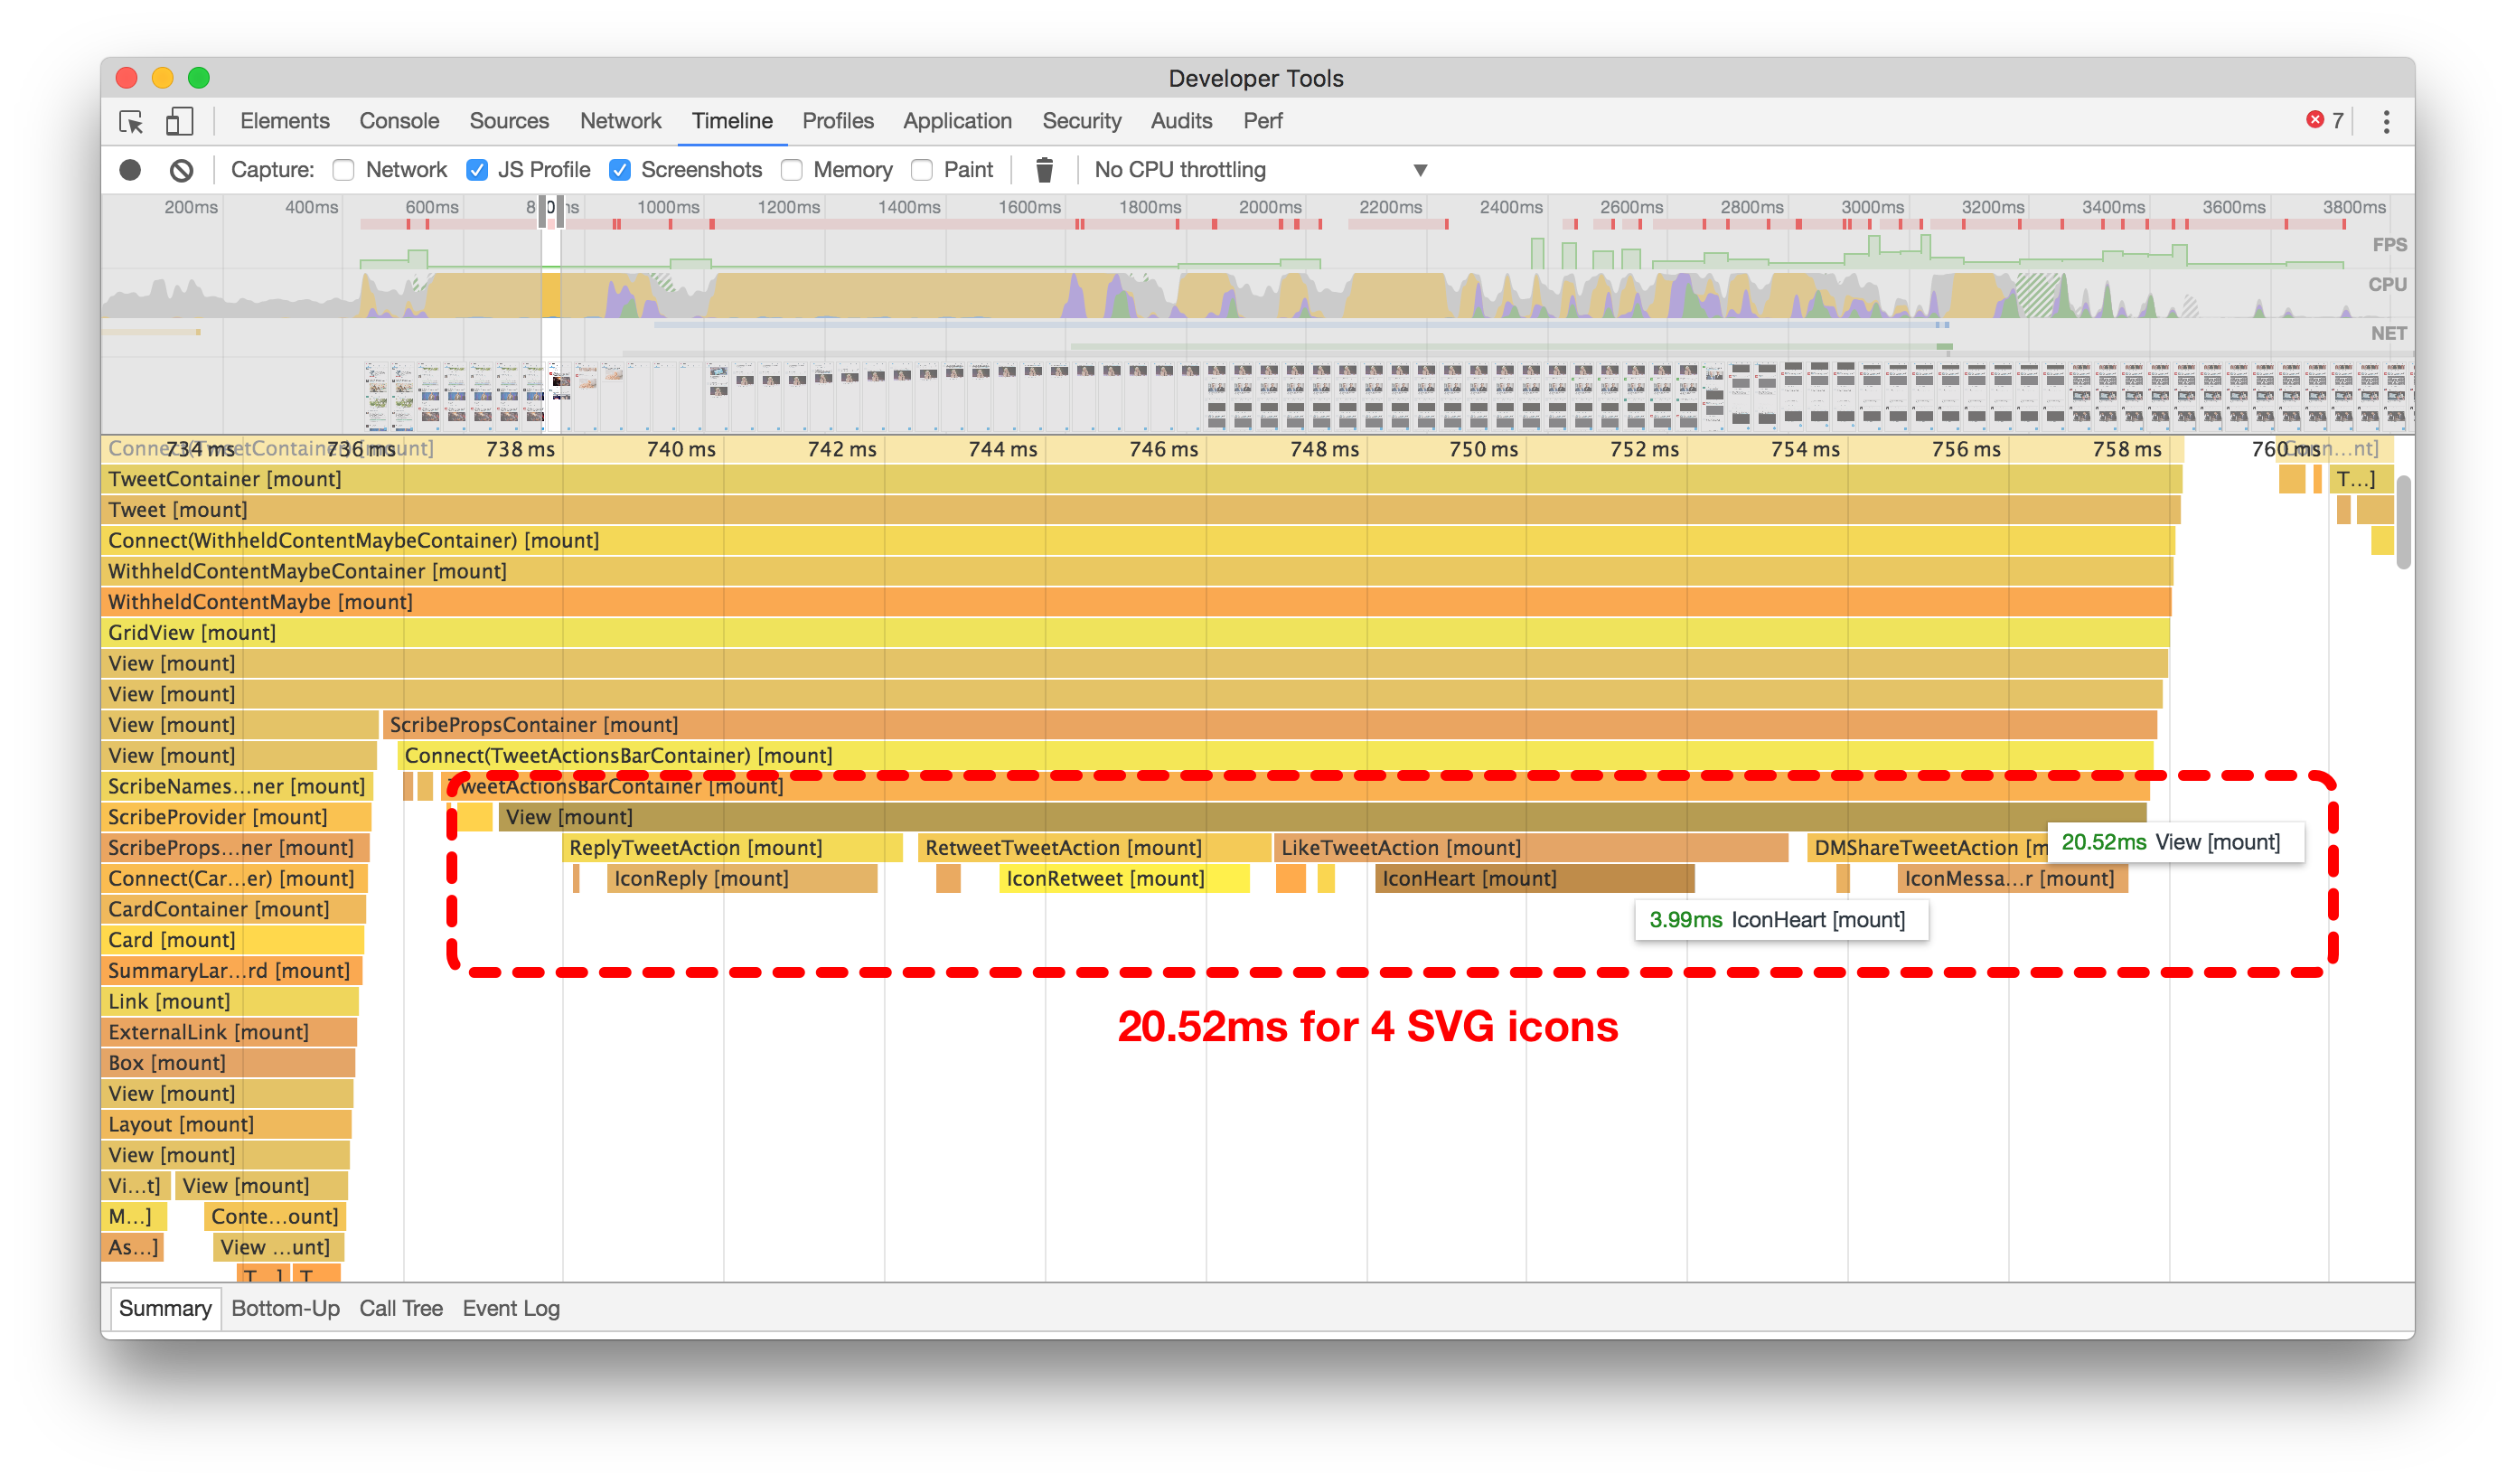
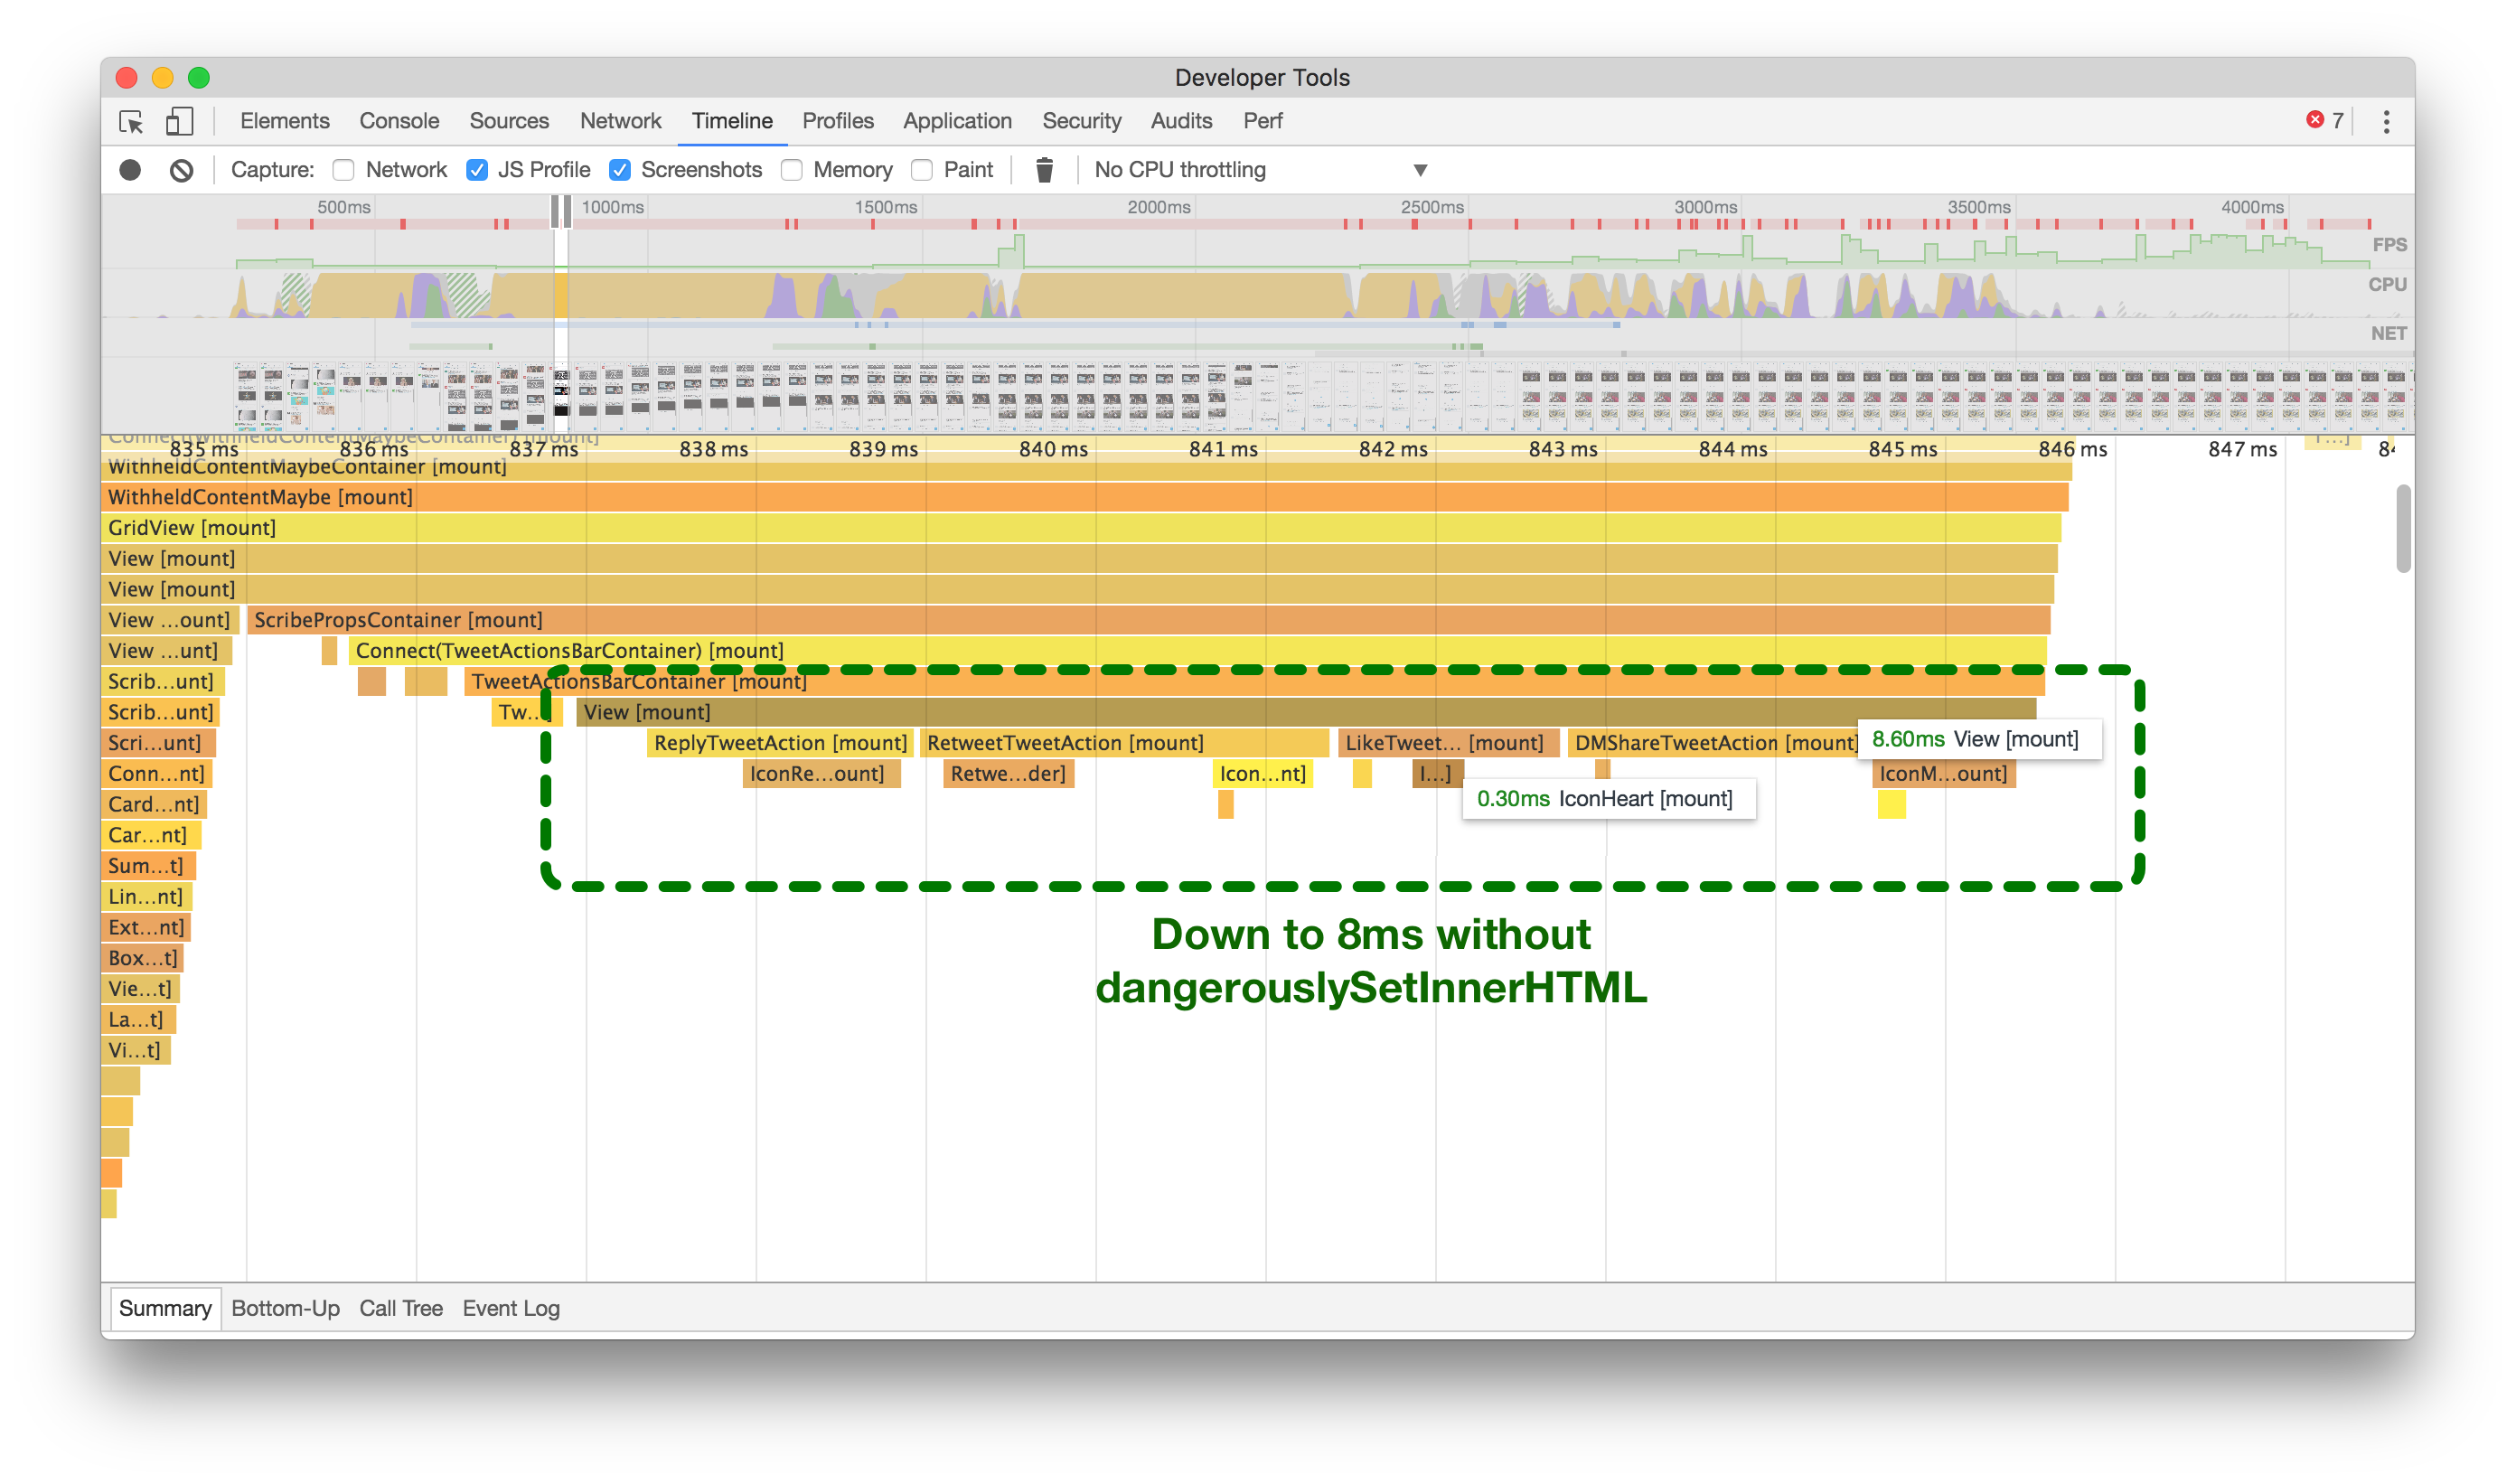
在之前(左侧),你会看到安装4个SVG图标大约需要20毫秒,而在之后(右侧)大约需要8毫秒。点击或触摸进行放大。
Analyzing the flame graphs above, our original code (left) shows that it takes about 20ms on a slow device to mount the actions at the bottom of a Tweet containing four SVG icons. While this may not seem like much on its own, knowing that we need to render many of these at once, all while scrolling a timeline of infinite Tweets, we realized that this is a huge waste of time.
分析上面的火焰图,我们的原始代码(左侧)显示,在慢速设备上,将包含四个SVG图标的操作挂载到一个推文底部大约需要20毫秒的时间。虽然单独来看这可能不算什么,但是考虑到我们需要一次性渲染许多这样的操作,并且同时滚动一个无限推文的时间轴,我们意识到这是一种巨大的时间浪费。
Since React v15 added support for most SVG attributes, we went ahead and looked to see what would happen if we avoided dangerouslySetInnerHTML. Checking the patched flame graph (above right), we get about an average of 60% savings each time we need to mount and render one of these sets of icons!
自从React v15添加了对大多数SVG属性的支持,我们继续前进并查看了如果避免使用 dangerouslySetInnerHTML 会发生什么。检查修补后的火焰图(右上方),每次需要挂载和渲染这些图标集合时,我们平均节省了约60%的时间!
Now, our SVG icons are simple stateless components, don’t use “dangerous” functions, and mount an average of 60% faster. They look like this:
现在,我们的SVG图标是简单的无状态组件,不使用“危险”的函数,并且加载速度平均快了60%。它们的样子是这样的:
Defer Rendering When Mounting & Unmounting Many Components
挂载和卸载多个组件时延迟渲染
On slower devices, we noticed that it could take a long time for our main navigation bar to appear to respond to taps, often leading us to tap multiple times, thinking that perhaps the first tap didn’t register.
在较慢的设备上,我们注意到主导航栏可能需要很长时间才能响应点击,这经常导致我们多次点击,以为第一次点击没有注册成功。
Notice in the image below how the Home icon takes nearly 2 seconds to update and show that it was tapped:
请注意下面的图片中,主页图标需要近2秒的时间才能更新并显示被点击的状态

没有延迟渲染,导航栏需要时间来响应。
No, that wasn’t just the GIF running a slow frame rate. It actually was that slow. But, all of the data for the Home screen was already loaded, so why is it taking so long to show anything?
不,那不仅仅是GIF运行速度慢。它实际上就是那么慢。但是,主屏幕的所有数据已经加载完毕,为什么显示任何内容都要花这么长时间呢?
It turns out that mounting and unmounting large trees of components (like timelines of Tweets) is very expensive in React.
原来,在React中挂载和卸载大量组件(如推文的时间轴)是非常昂贵的。
At the very least, we wanted to remove the perception of the navigation bar not reacting to user input. For that, we created a small higher-order-component:
至少,我们希望消除导航栏对用户输入不响应的感觉。为此,我们创建了一个小的高阶组件:
我们的HigherOrderComponent,由Katie Sievert编写。
Once applied to our HomeTimeline, we saw near-instant responses of the navigation bar, leading to a perceived improvement overall.
一旦应用到我们的主页时间线上,我们立即看到导航栏的反应速度明显提升,整体感觉有所改善。
const DeferredTimeline = deferComponentRender(HomeTimeline);
render(<DeferredTimeline />);
延迟渲染后,导航栏立即响应。
Optimizing Redux 优化Redux
Avoid Storing State Too Often
避免过于频繁地存储状态
While controlled components seem to be the recommended approach, making inputs controlled means that they have to update and re-render for every keypress.
尽管受控组件似乎是推荐的方法,但使输入框成为受控组件意味着它们必须在每次按键时更新和重新渲染。
While this is not very taxing on a 3GHz desktop computer, a small mobile device with very limited CPU will notice significant lag while typing–especially when deleting many characters from the input.
虽然对于一台3GHz的台式电脑来说并不是很吃力,但是对于一台CPU非常有限的小型移动设备来说,在输入时会出现明显的延迟,尤其是在删除大量字符时。
In order to persist the value of composing Tweets, as well as calculating the number of characters remaining, we were using a controlled component and also passing the current value of the input to our Redux state at each keypress.
为了保持撰写推文的值以及计算剩余字符数,我们使用了受控组件,并在每次按键时将输入的当前值传递给我们的Redux状态。
Below (left), on a typical Android 5 device, every keypress leading to a change could cause nearly 200ms of overhead. Compound this by a fast typist, and we ended up in a really bad state, with users often reporting that their character insertion point was moving all over the place, resulting in jumbled sentences.
在一个典型的Android 5设备上(左侧),每次按键导致的变化都可能引起近200毫秒的额外开销。如果是一个快速打字者,这种情况会进一步恶化,用户经常报告他们的字符插入点会在各个位置移动,导致句子混乱。
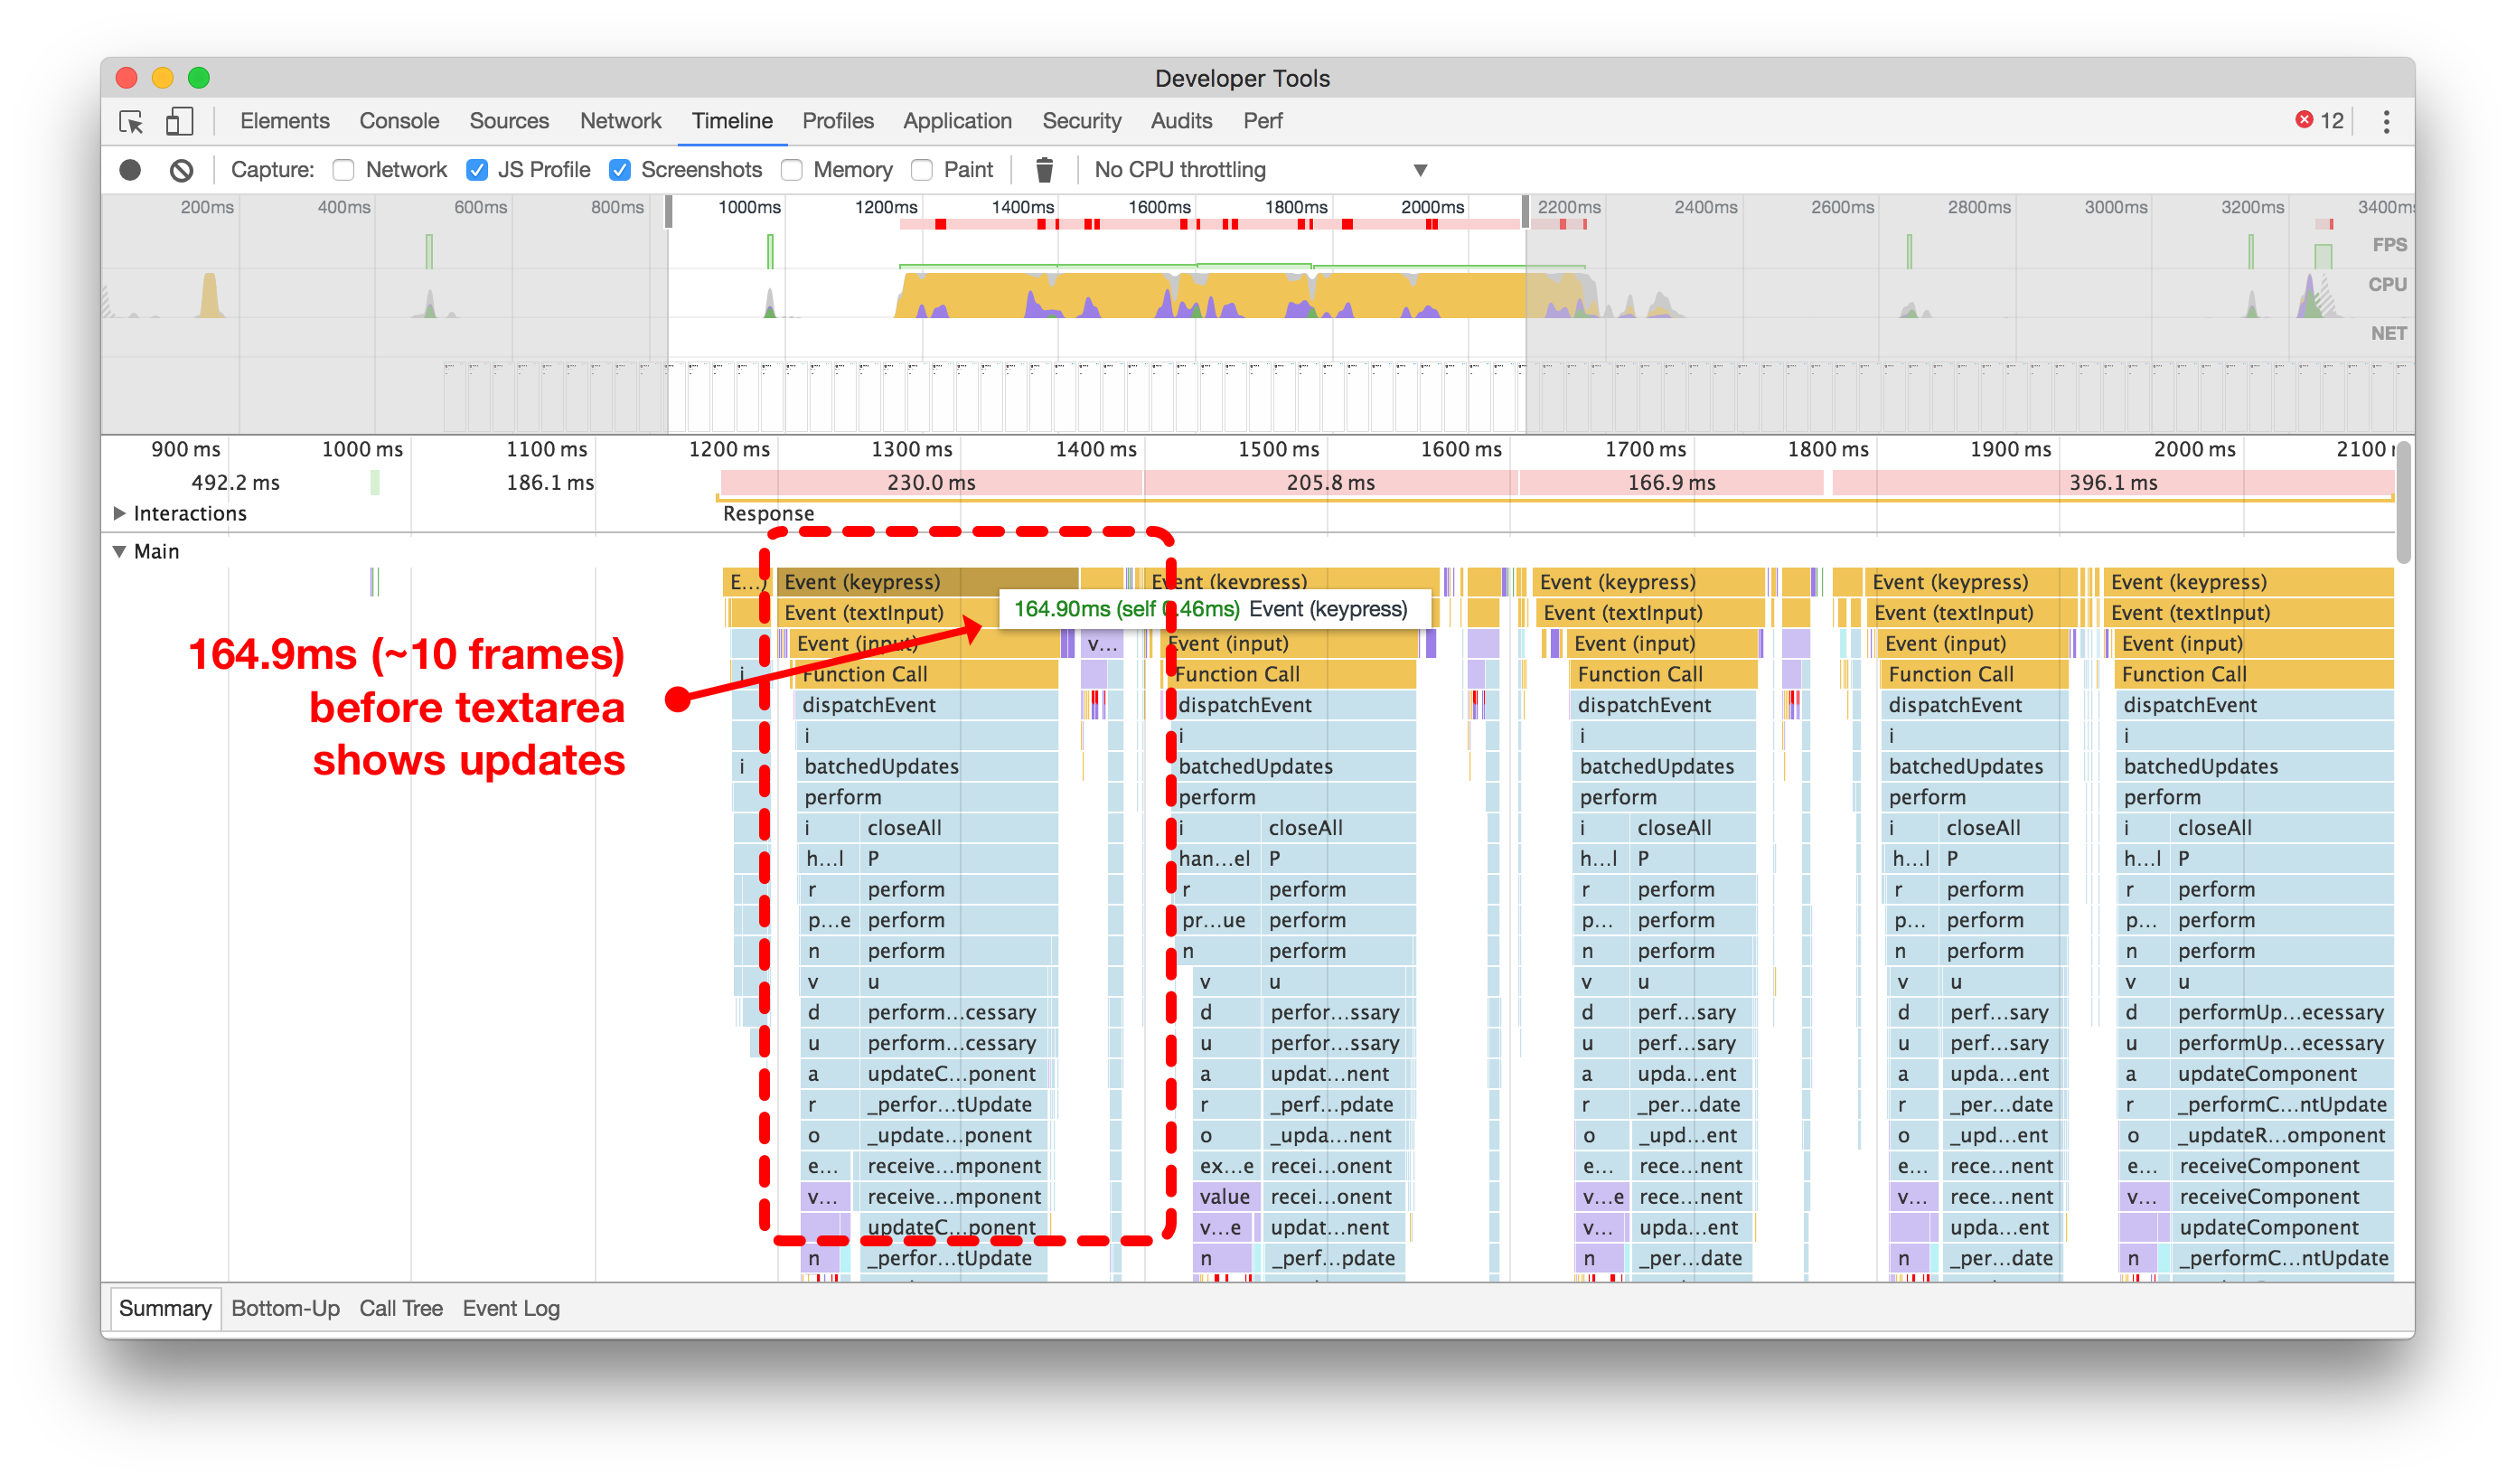
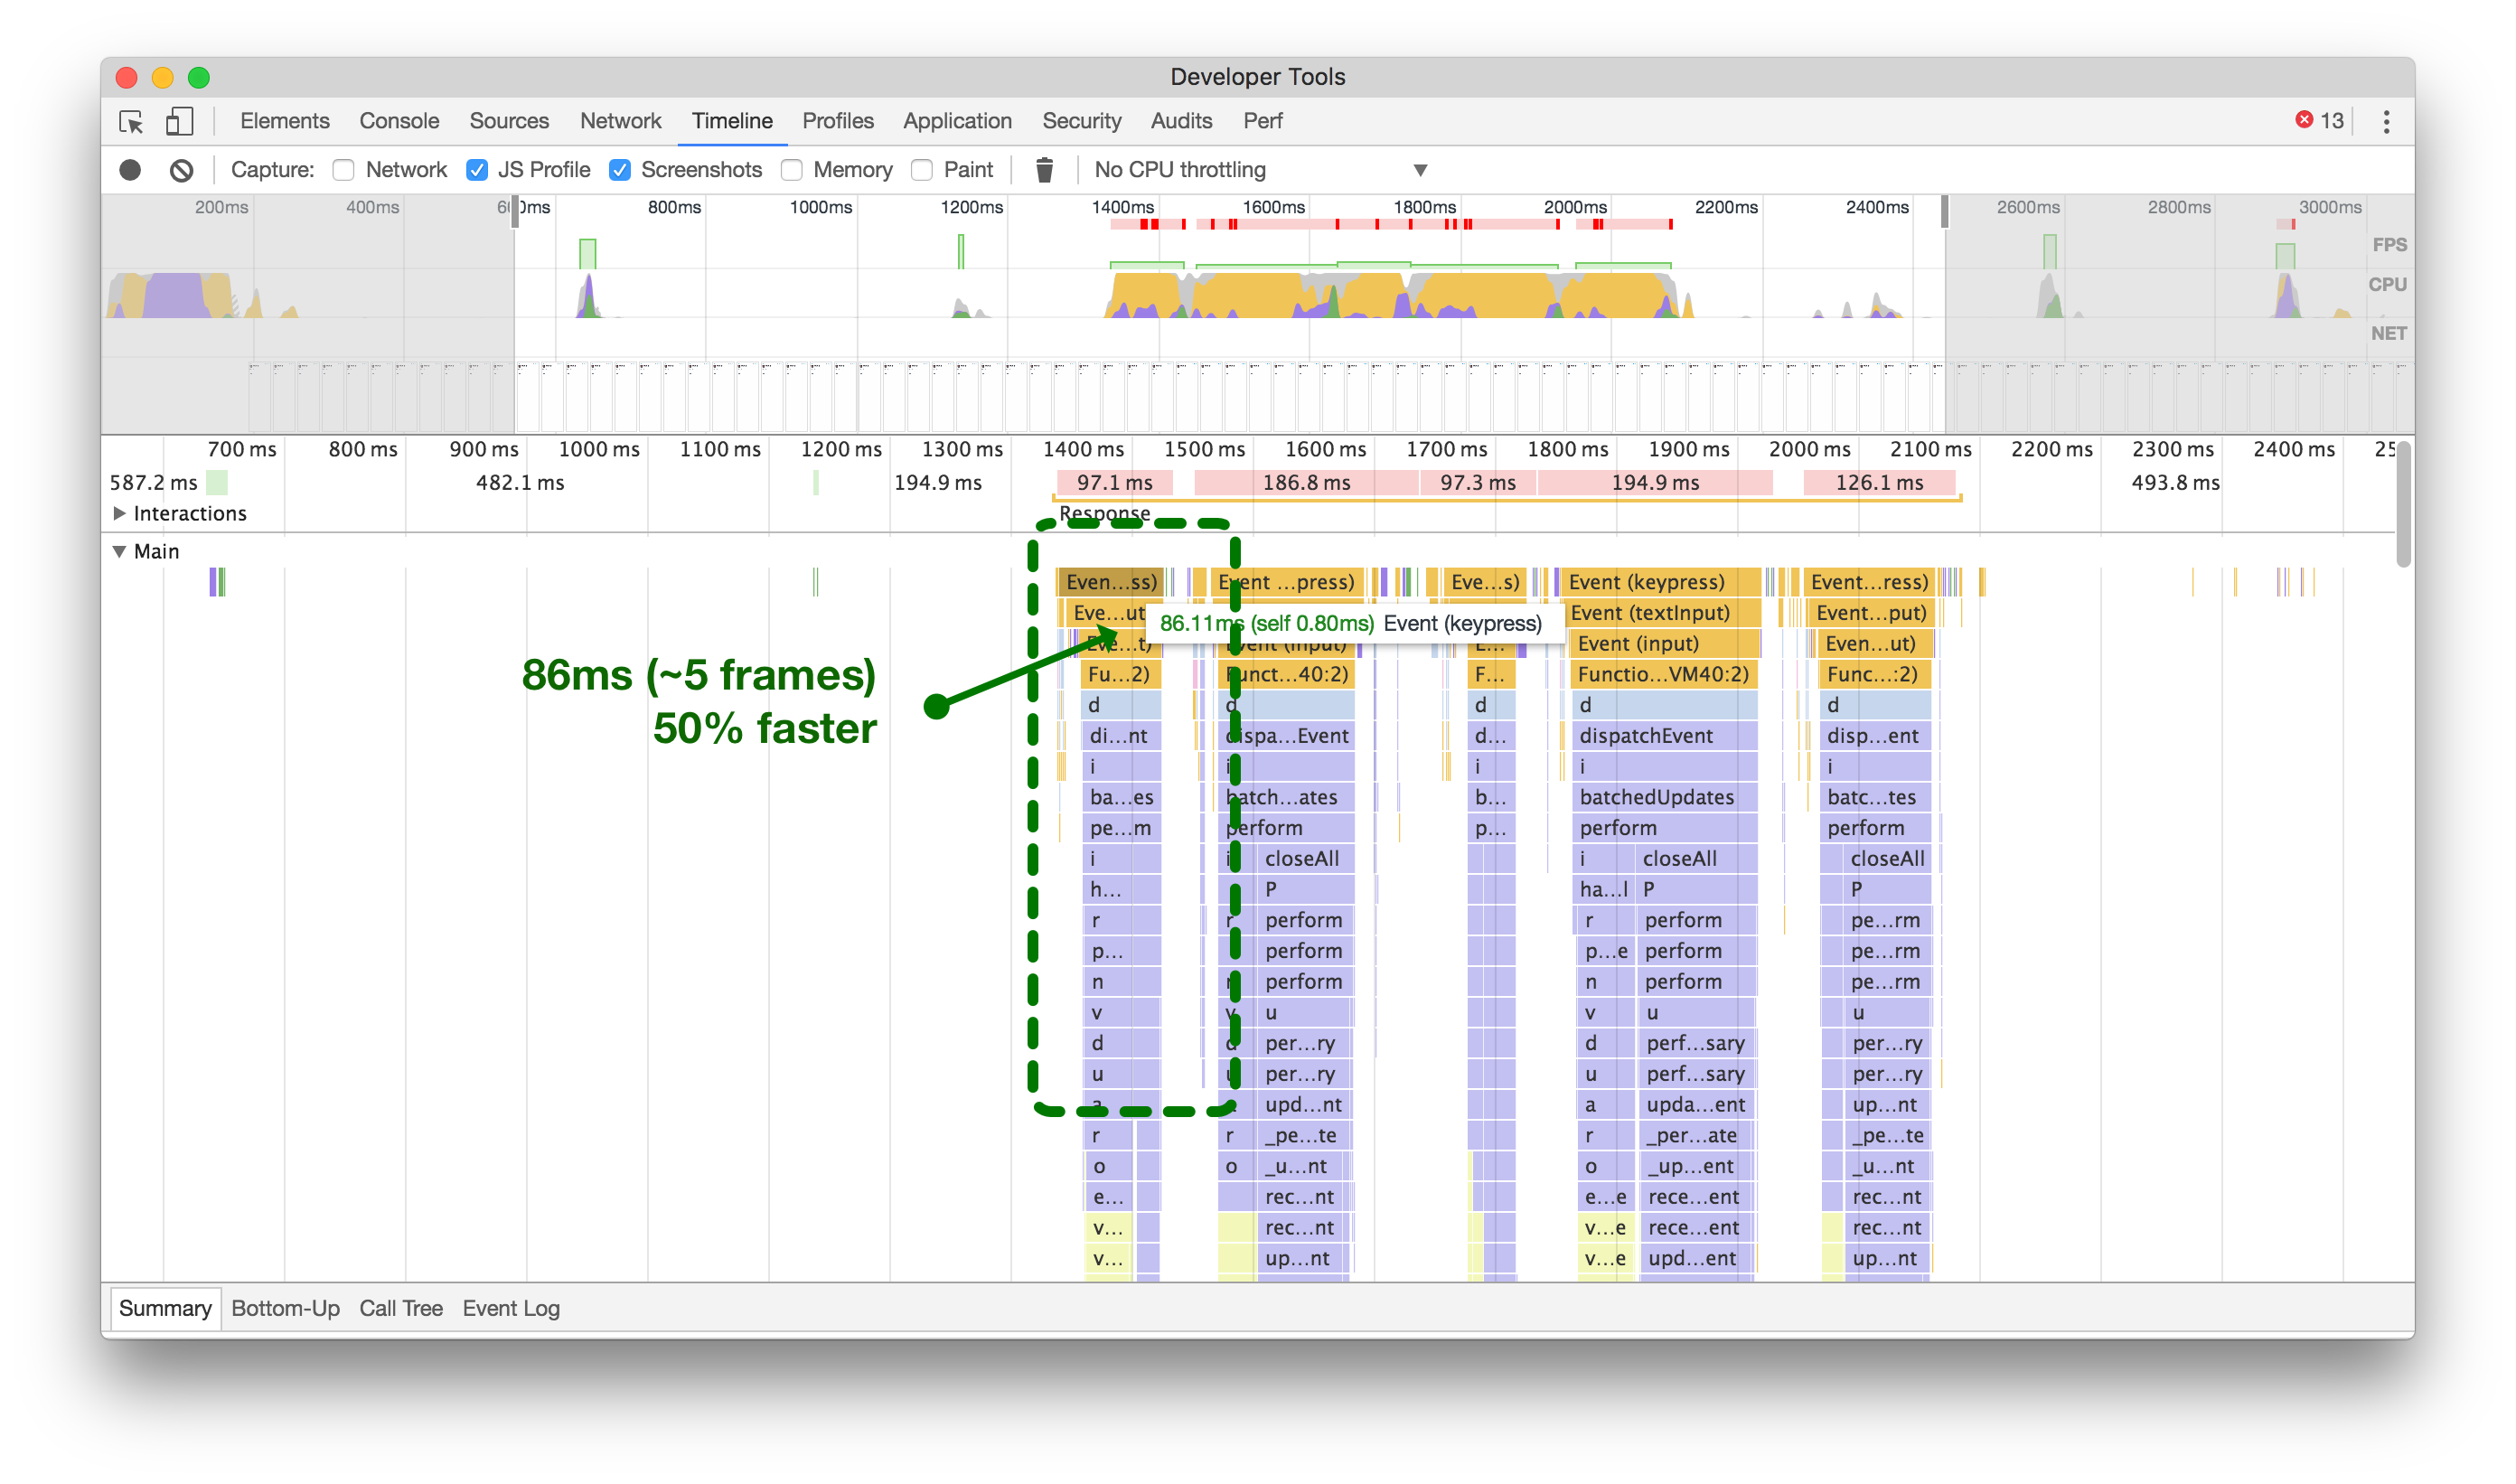
点击或触摸以放大,比较在将更改分派到Redux时每次按键更新所需的时间和不分派时的时间。
By removing the draft Tweet state from updating the main Redux state on every keypress and keeping things local in the React component’s state, we were able to reduce the overhead by over 50% (above, right).
通过在每次按键时从更新主要的Redux状态中移除草稿推文状态,并将事物保持在React组件的本地状态中,我们能够将开销减少了50%以上(上图右侧)。
Batch Actions into a Single Dispatch
将批量操作合并为单个调度
In Twitter Lite, we’re using redux with react-redux to subscribe our components to data state changes. We’ve optimized our data into separate areas of a larger store with Normalizr and combineReducers. This all works wonderfully to prevent duplication of data and keep our stores small. However, each time we get new data, we have to dispatch multiple actions in order to add it to the appropriate stores.
在Twitter Lite中,我们使用redux和react-redux来订阅我们的组件的数据状态变化。我们使用Normalizr和combineReducers将我们的数据优化为较大存储区的不同区域。这一切都很好地防止了数据的重复,并保持了我们的存储区的小型化。然而,每次获取新数据时,我们都必须分发多个动作以将其添加到适当的存储区。
With the way that react-redux works, this means that every action dispatched will cause our connected components (called Containers) to recalculate changes and possibly re-render.
使用react-redux的方式意味着每次分发动作都会导致我们连接的组件(称为容器)重新计算更改并可能重新渲染。
While we use a custom middleware, there are other batch middleware available. Choose the one that’s right for you, or write your own.
虽然我们使用了自定义的中间件,但还有其他可用的批处理中间件。选择适合您的那个,或者自己编写一个。
The best way to illustrate the benefits of batching actions is by using the Chrome React Perf Extension. After the initial load, we pre-cache and calculate unread DMs in the background. When that happens we add a lot of various entities (conversations, users, message entries, etc). Without batching (below left), you can see that we end up with double the number of times we render each component (~16) versus with batching (~8) (below right).
批量处理操作的好处最好的方式是使用Chrome React Perf扩展。在初始加载后,我们在后台预缓存并计算未读的直接消息。当这种情况发生时,我们会添加许多不同的实体(对话、用户、消息条目等)。没有批量处理(左下方),您可以看到我们渲染每个组件的次数是批量处理的两倍(约16次),而使用批量处理的情况下只有约8次(右下方)。
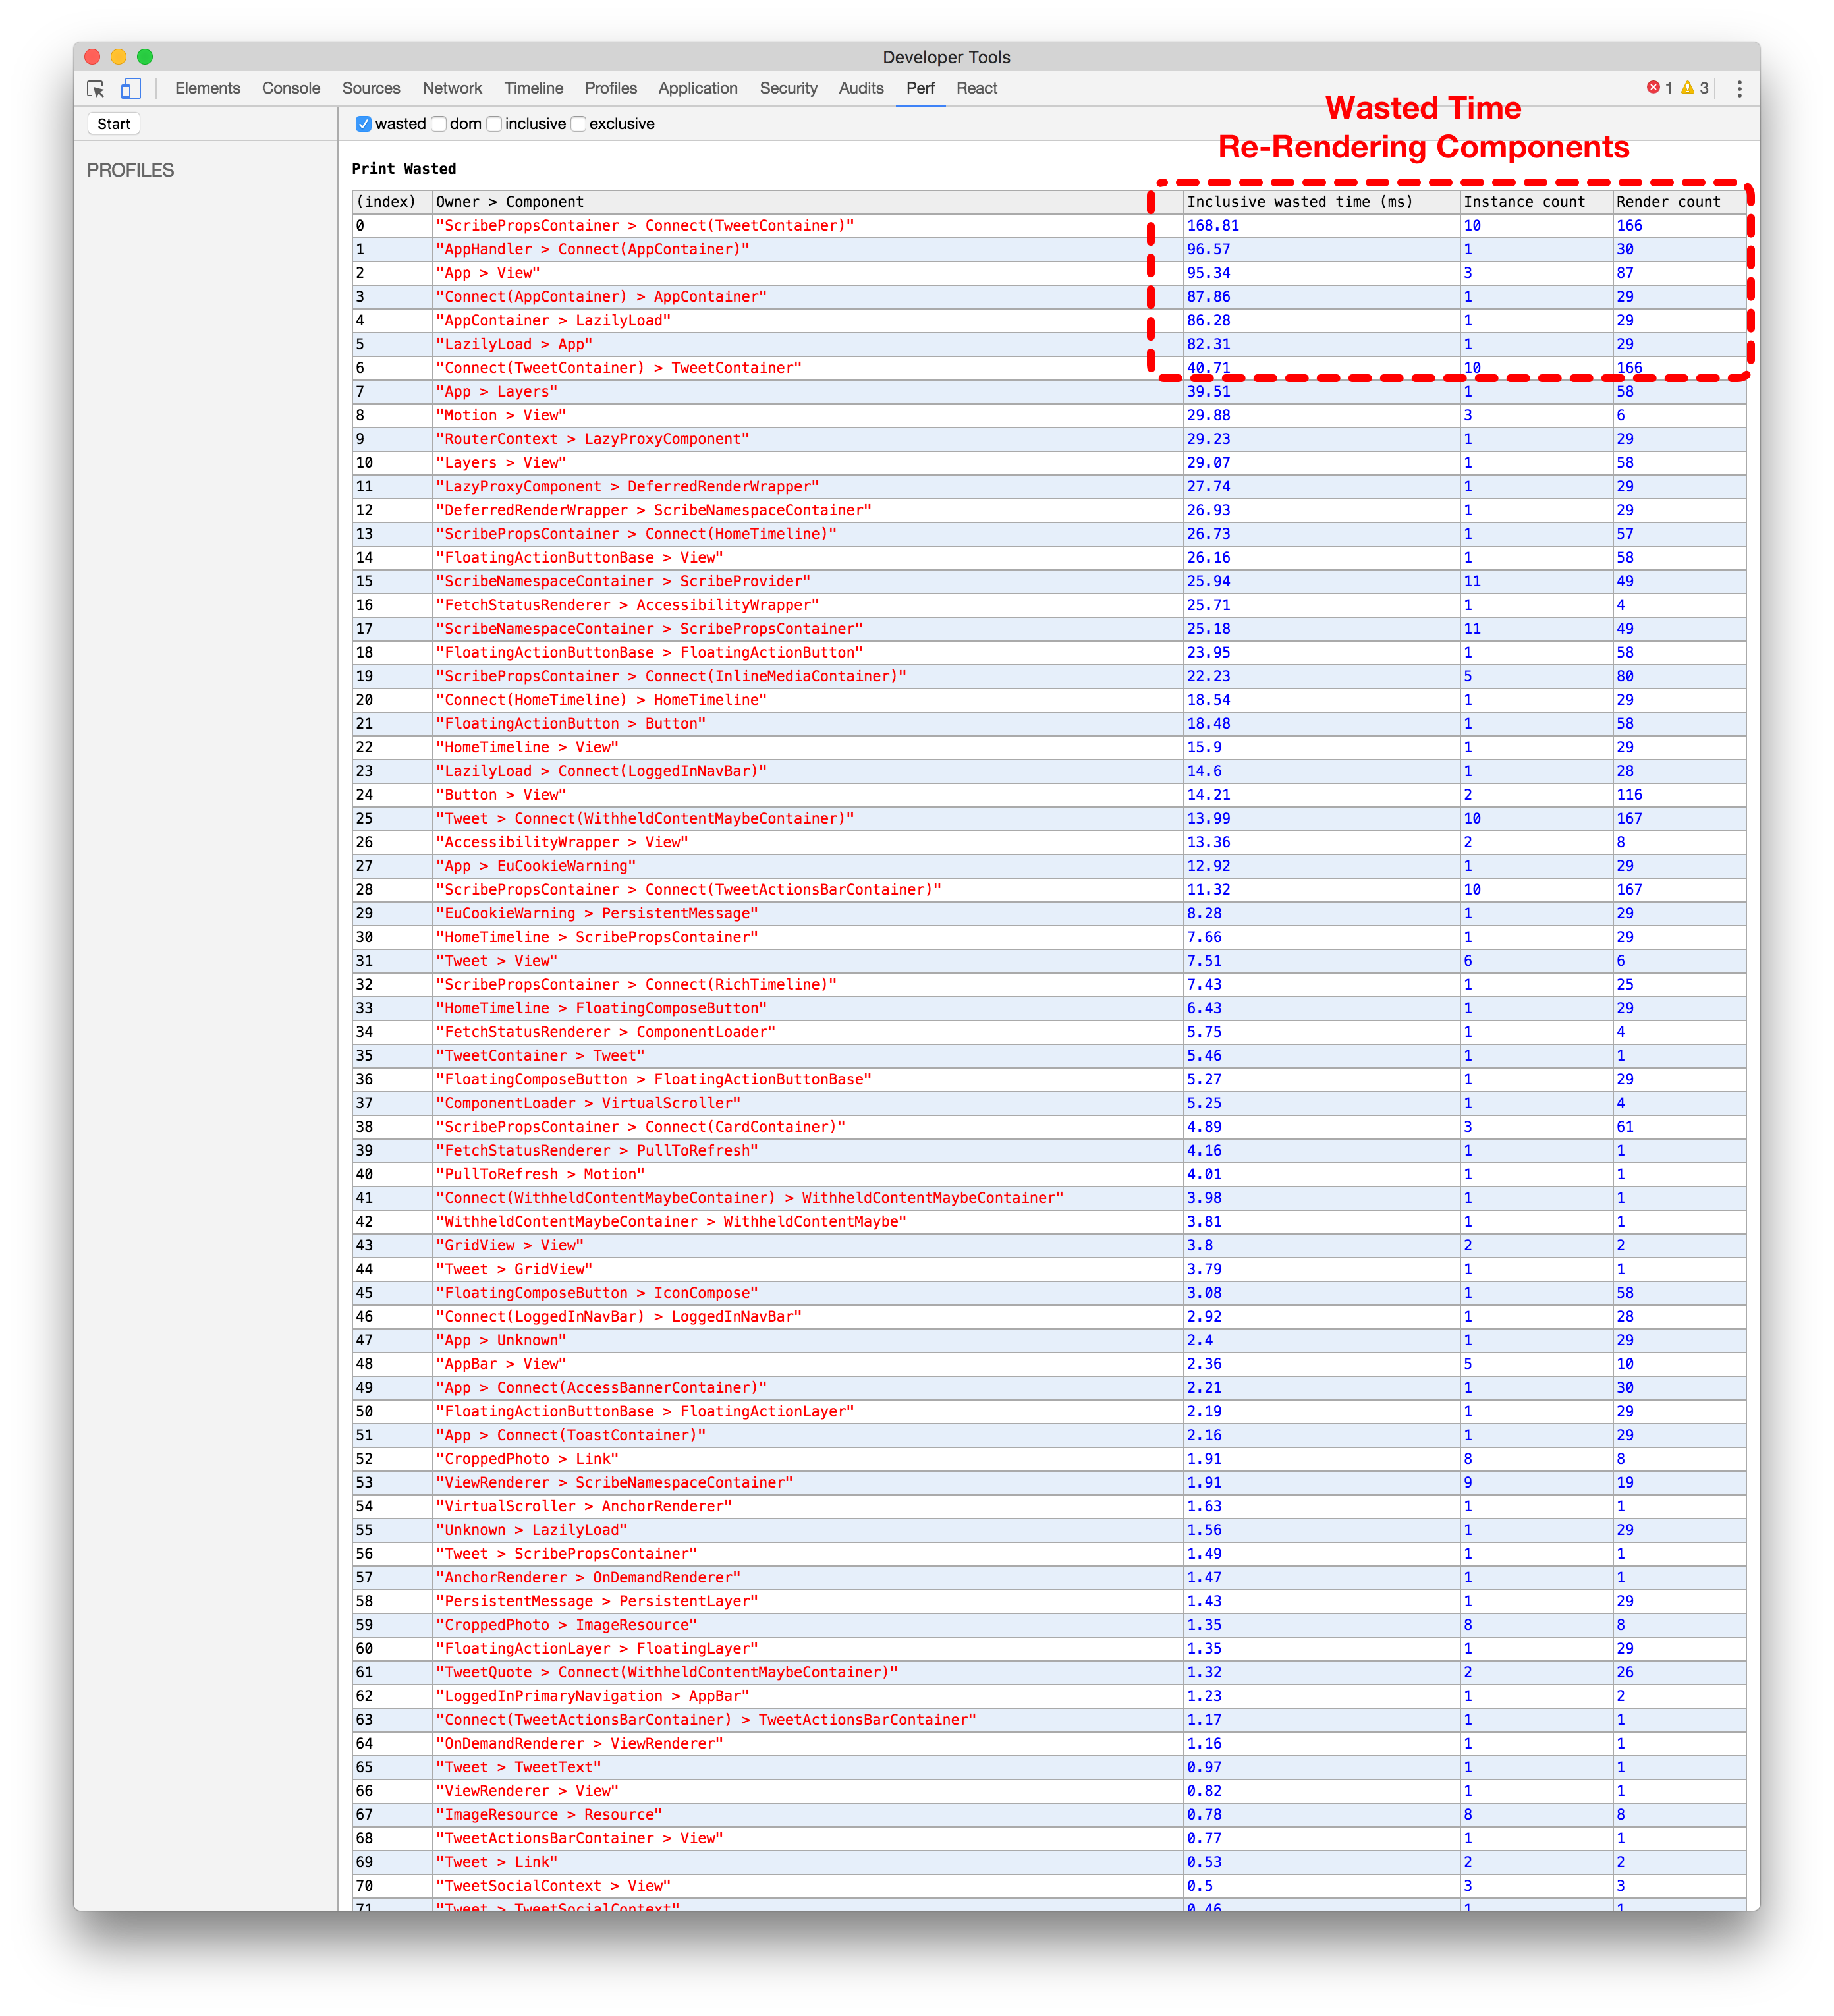

使用React Perf扩展在Redux中没有批量分发的情况下进行比较(左侧)与使用批量分发的情况(右侧)。点击或触摸进行放大。
Service Workers 服务工作者
While Service Workers aren’t available in all browsers yet, they’re an invaluable part of Twitter Lite. When available, we use ours for push notifications, to pre-cache application assets, and more. Unfortunately, being a fairly new technology, there’s still a lot to learn around performance.
虽然服务工作者在所有浏览器中尚不可用,但它们是 Twitter Lite 的宝贵组成部分。一旦可用,我们将使用它们进行推送通知、预缓存应用程序资产等。不幸的是,作为一项相对较新的技术,性能方面仍有很多需要学习的地方。
Pre-Cache Assets 预缓存资源
Like most products, Twitter Lite is by no means done. We’re still actively developing it, adding features, fixing bugs, and making it faster. This means we frequently need to deploy new versions of our JavaScript assets.
就像大多数产品一样,Twitter Lite绝不是完美的。我们仍在积极开发中,添加功能,修复错误,并使其更快。这意味着我们经常需要部署新版本的JavaScript资源。
Unfortunately, this can be a burden when users come back to the application and need to re-download a bunch of script files just to view a single Tweet.
不幸的是,当用户返回应用程序并需要重新下载一堆脚本文件才能查看一条推文时,这可能会成为负担。
In ServiceWorker-enabled browsers, we get the benefit of being able to have the worker automatically update, download, and cache any changed files in the background, on its own, before you come back.
在启用ServiceWorker的浏览器中,我们可以在后台自动更新、下载和缓存任何更改的文件,而无需您返回。
So what does this mean for the user? Near instant subsequent application loads, even after we’ve deployed a new version!
那么对用户来说意味着什么呢?即使在我们部署了新版本之后,应用程序的加载速度也几乎是即时的!

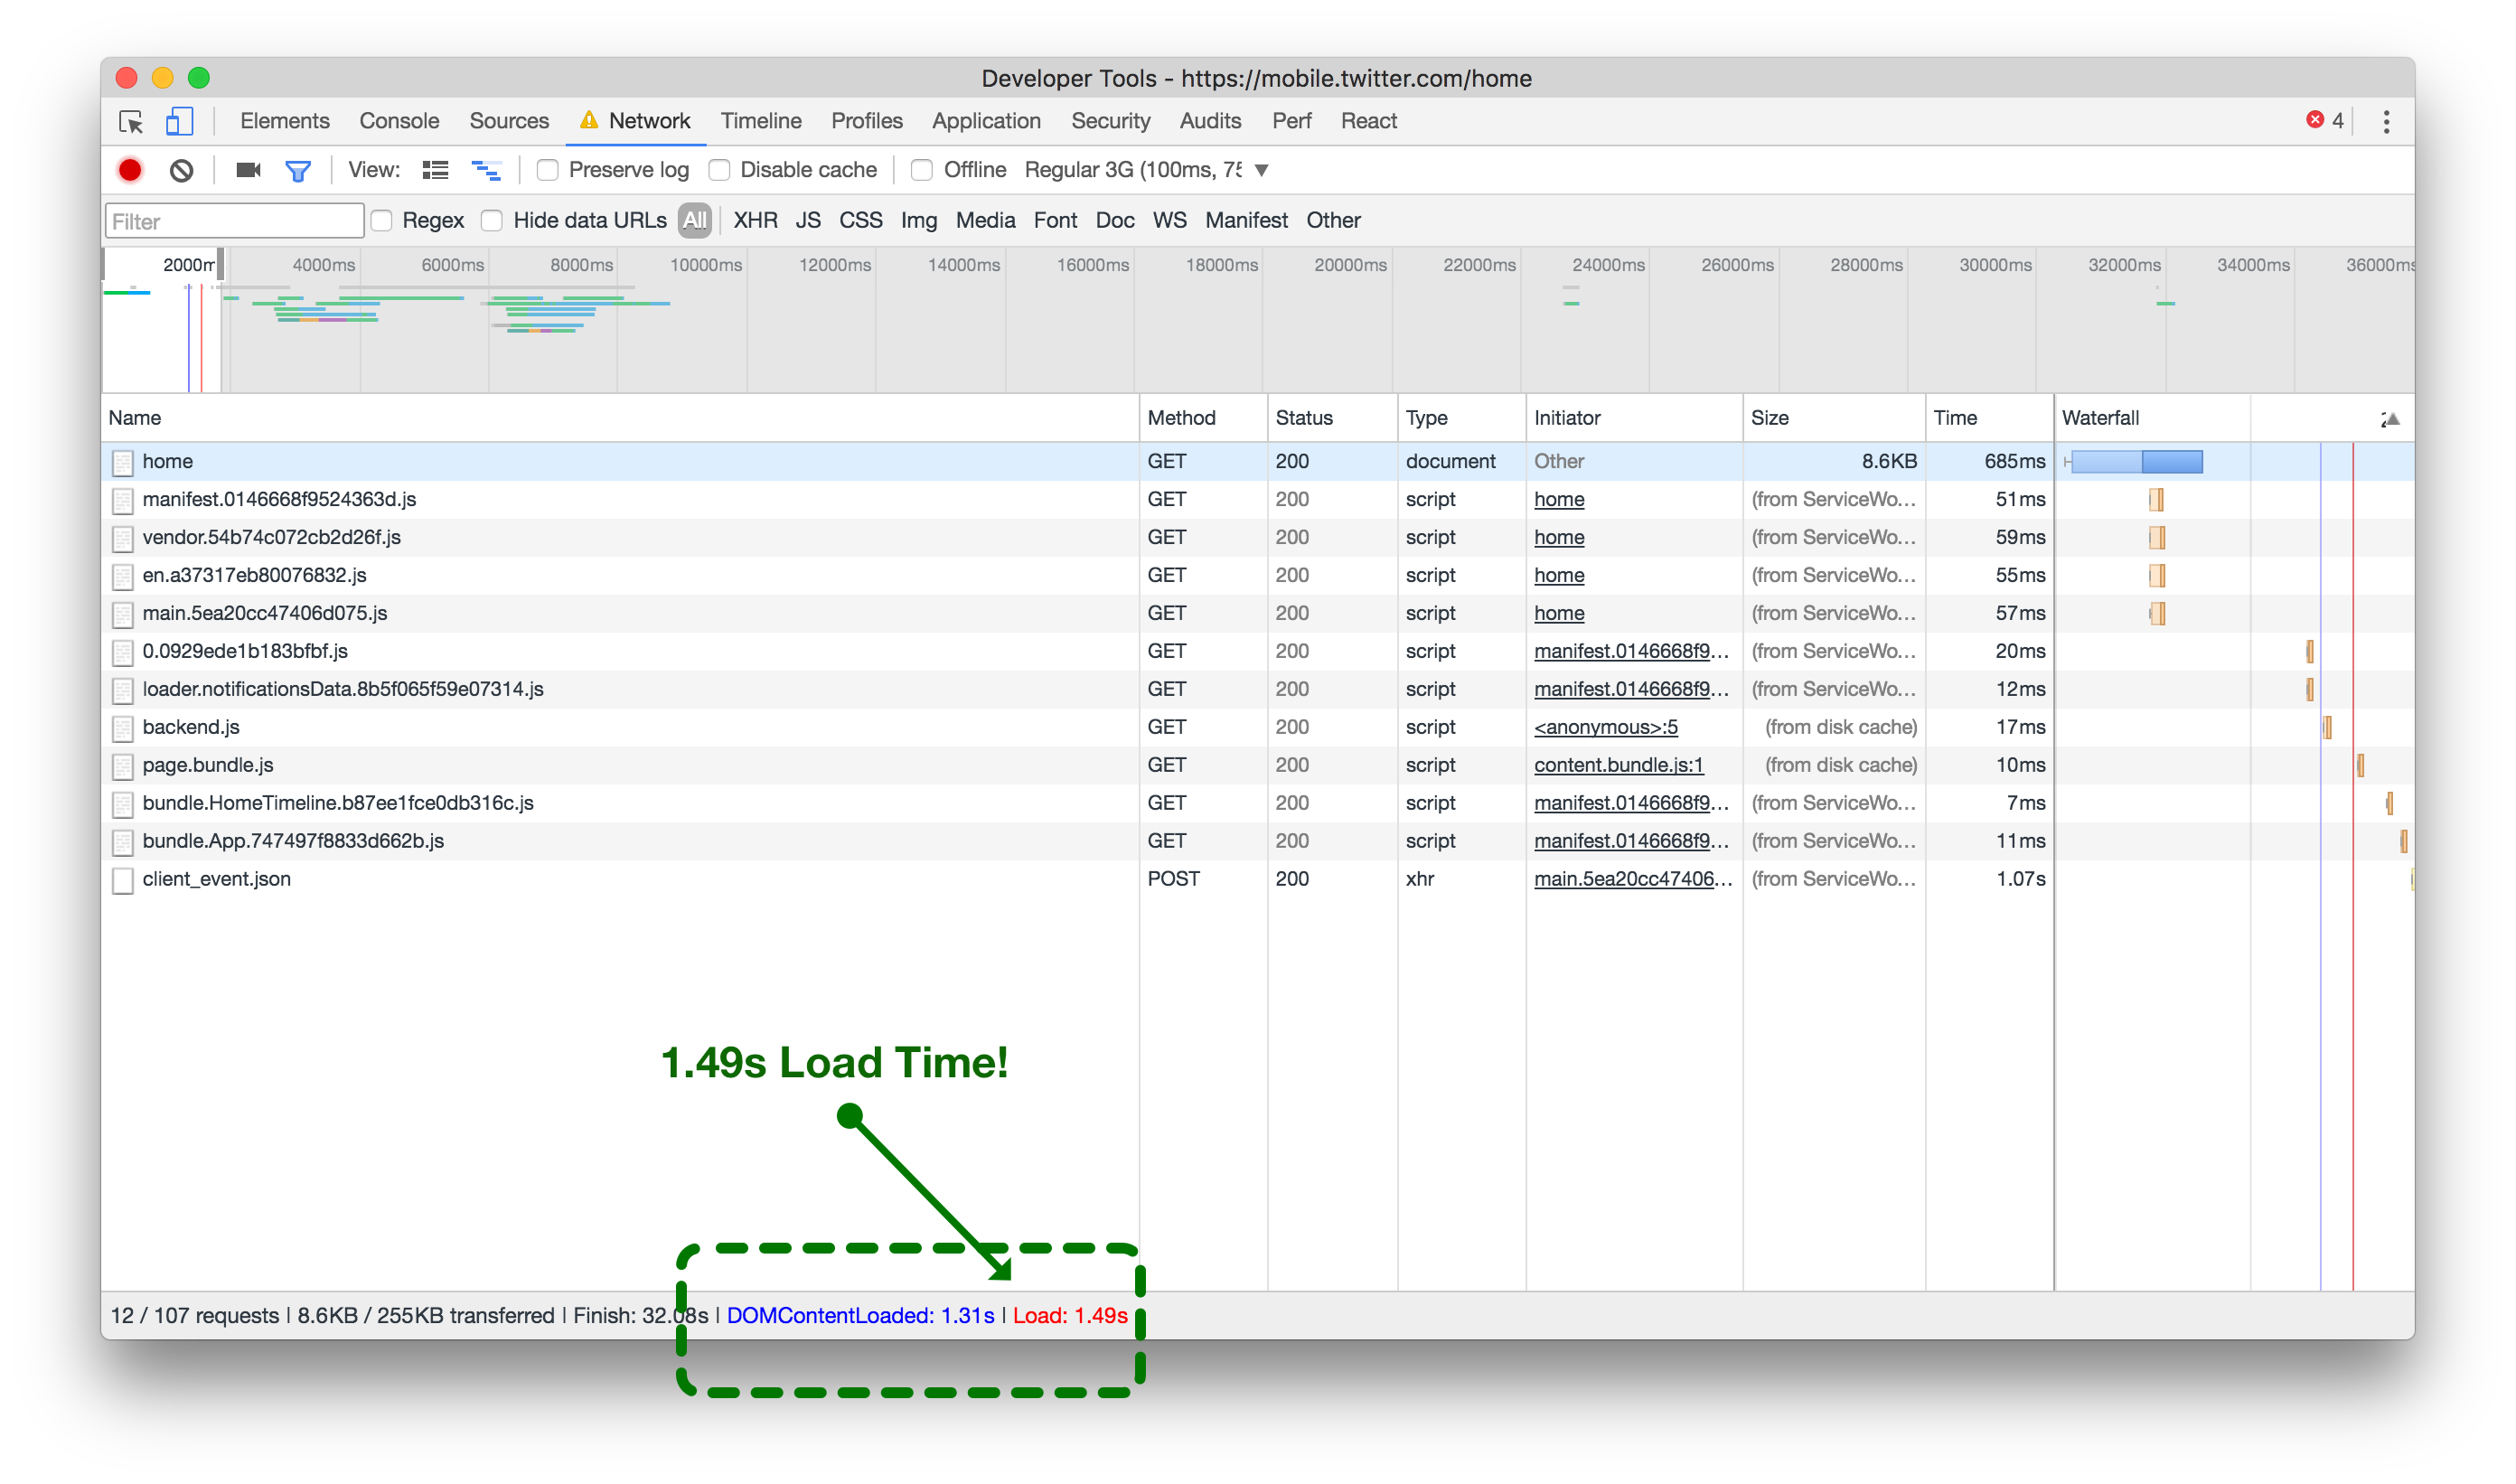
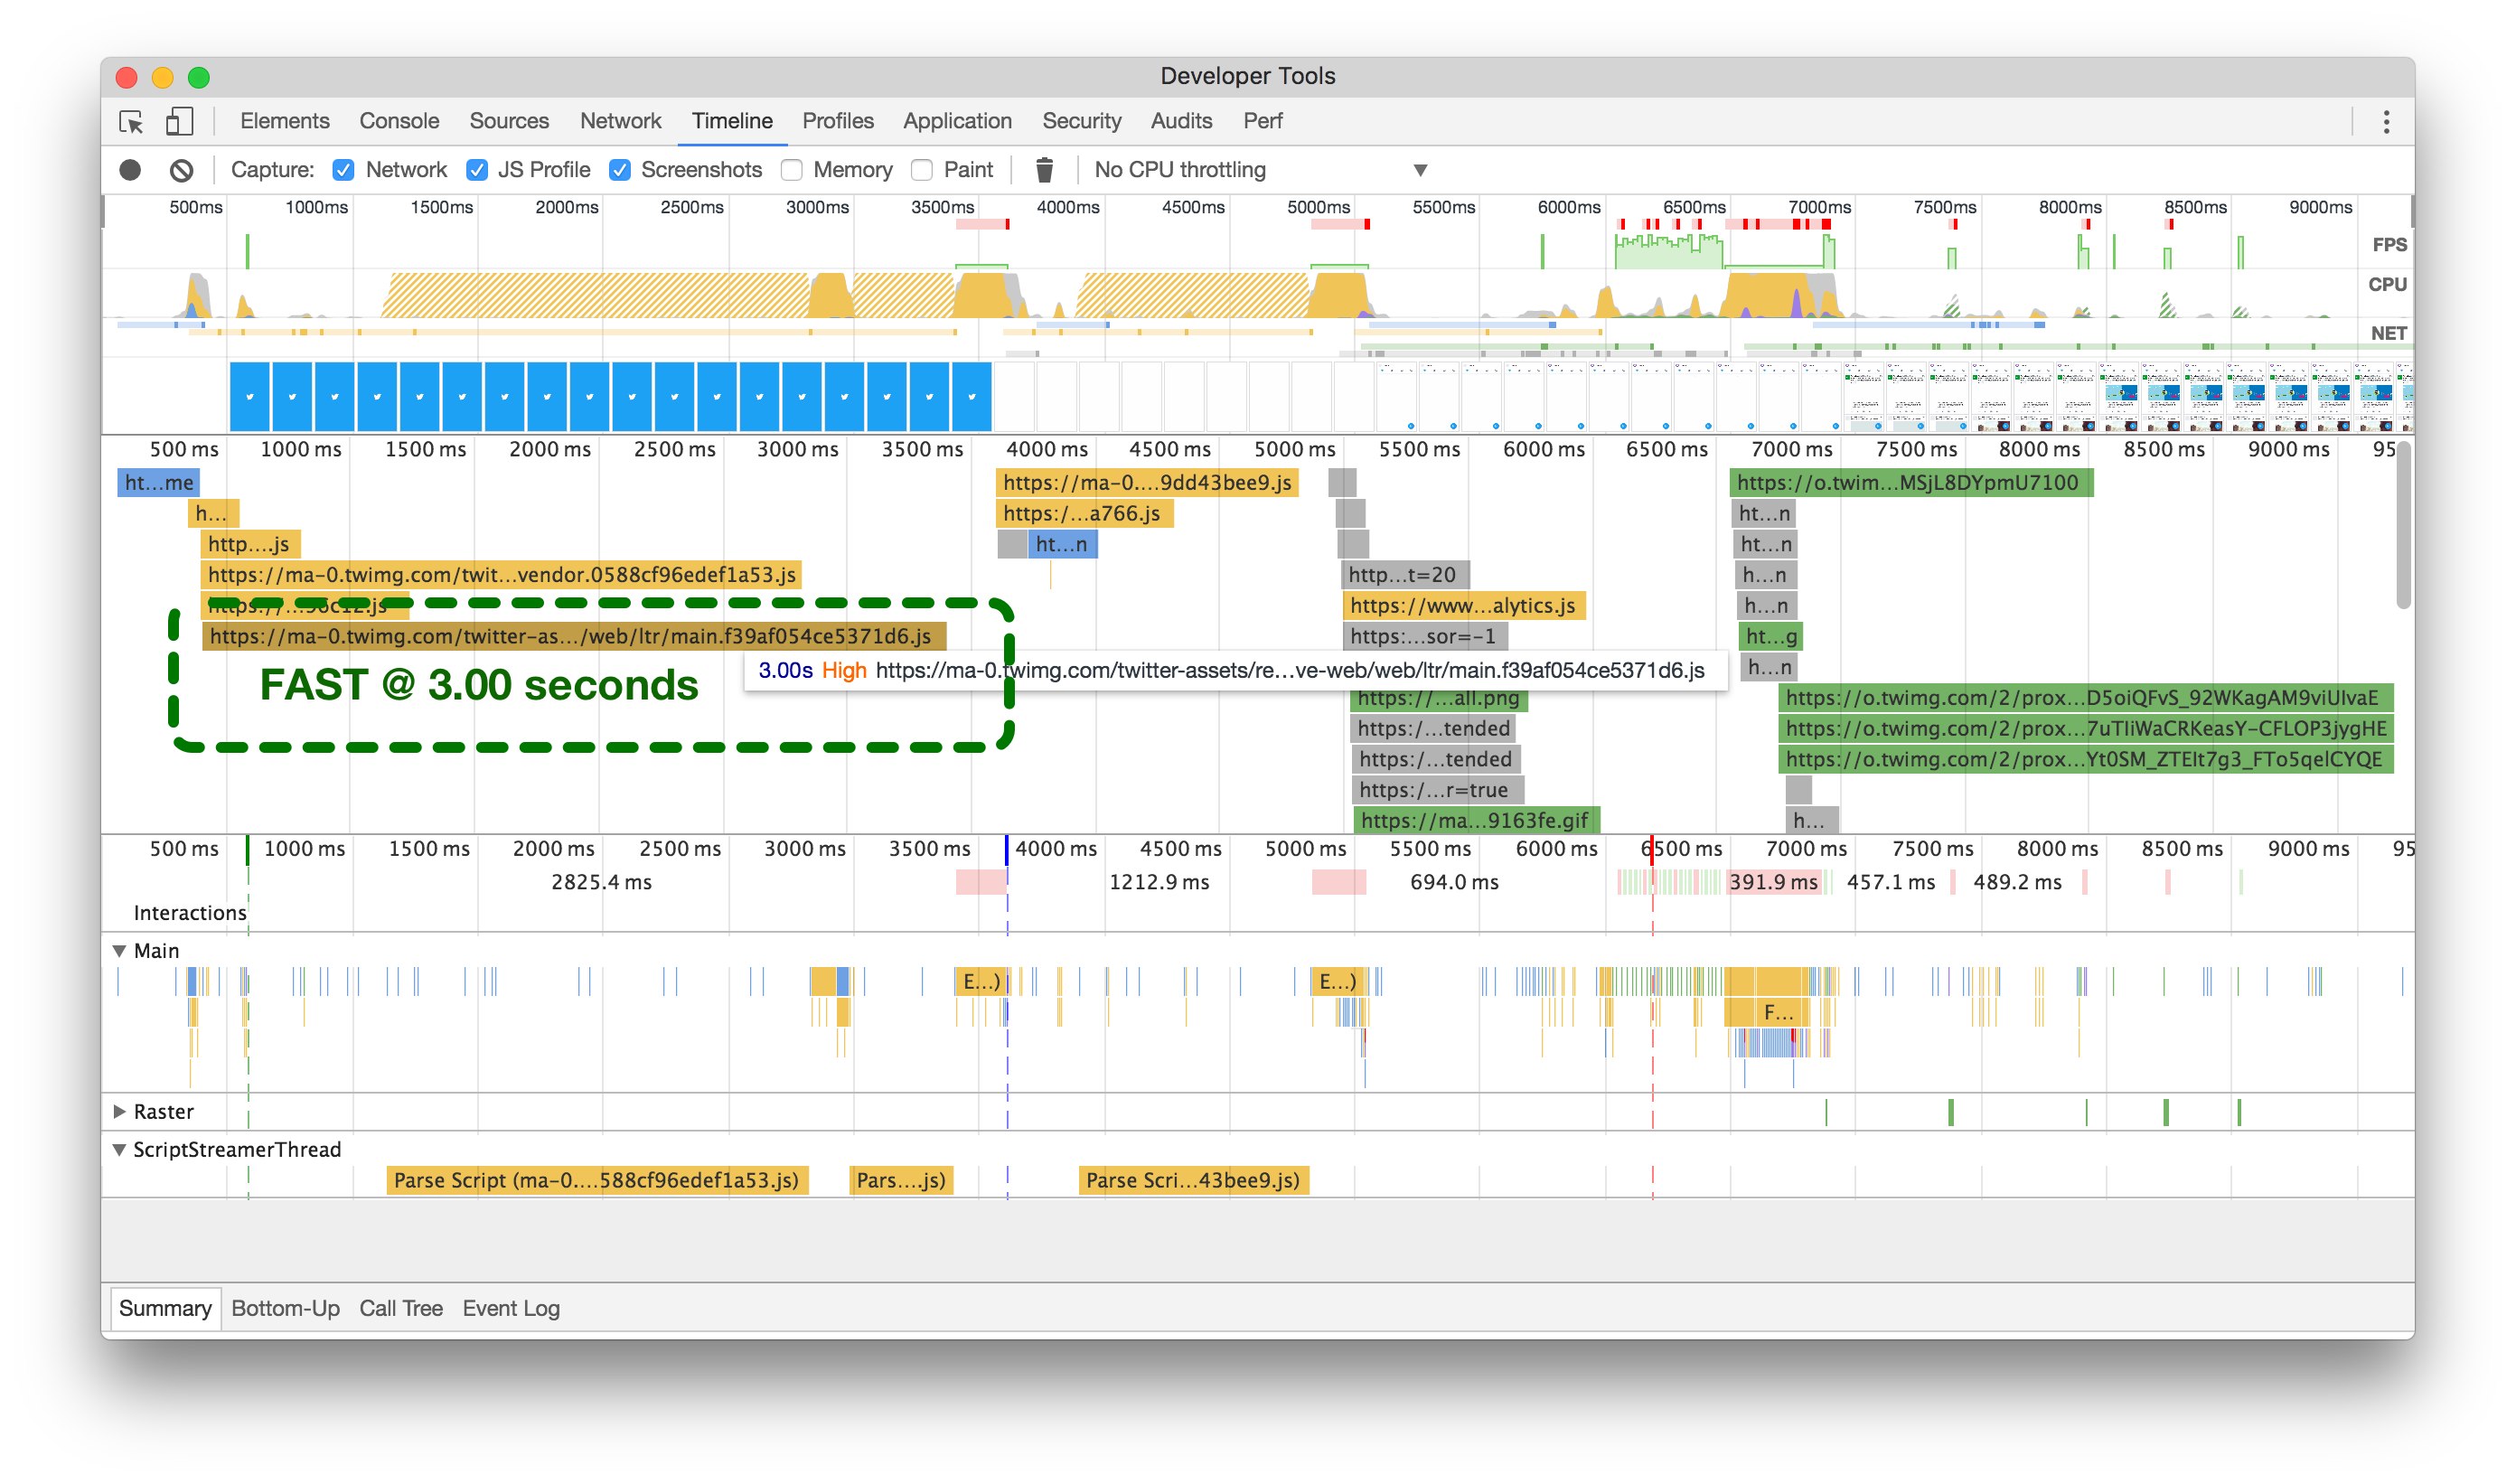
网络资产加载时间,无ServiceWorker预缓存(左)与预缓存(右)。点击或轻触放大。
As illustrated above (left) without ServiceWorker pre-caching, every asset for the current view is forced to load from the network when returning to the application. It takes about 6 seconds on a good 3G network to finish loading. However, when the assets are pre-cached by the ServiceWorker (above right), the same 3G network takes less than 1.5 seconds before the page is finished loading. A 75% improvement!
如上图所示(左图),如果没有使用ServiceWorker进行预缓存,当返回应用程序时,当前视图的每个资源都需要从网络加载。在良好的3G网络下,加载完成大约需要6秒钟。然而,当使用ServiceWorker进行预缓存(右图),同样的3G网络下,页面加载完成只需要不到1.5秒钟。改进了75%!
Delay ServiceWorker Registration
延迟ServiceWorker注册
In many applications, it’s safe to register a ServiceWorker immediately on page load:
在许多应用程序中,立即在页面加载时注册ServiceWorker是安全的
<script>
window.navigator.serviceWorker.register('/sw.js');
</script>
While we try to send as much data to the browser as possible to render a complete-looking page, in Twitter Lite this isn’t always possible. We may not have sent enough data, or the page you’re landing on may not support data pre-filled from the server. Because of this and various other limitations, we need to make some API requests immediately after the initial page load.
尽管我们尽可能向浏览器发送尽量多的数据以呈现完整的页面,但在Twitter Lite中,这并非总是可能的。我们可能没有发送足够的数据,或者您所访问的页面可能不支持从服务器预填充数据。由于这个原因和其他各种限制,我们需要在初始页面加载后立即进行一些API请求。
Normally, this isn’t a problem. However, if the browser hasn’t installed the current version of our ServiceWorker yet, we need to tell it to install–and with that comes about 50 requests to pre-cache various JS, CSS, and image assets.
通常情况下,这不是一个问题。然而,如果浏览器尚未安装我们的ServiceWorker的最新版本,我们需要告诉它进行安装 - 这将导致大约50个请求来预缓存各种JS、CSS和图像资源。
When we were using the simple approach of registering our ServiceWorker immediately, we could see the network contention happening within the browser, maxing out our parallel request limit (below left).
当我们使用立即注册ServiceWorker的简单方法时,我们可以看到浏览器内发生的网络争用,使我们的并行请求限制达到最大值(如下图左侧)。
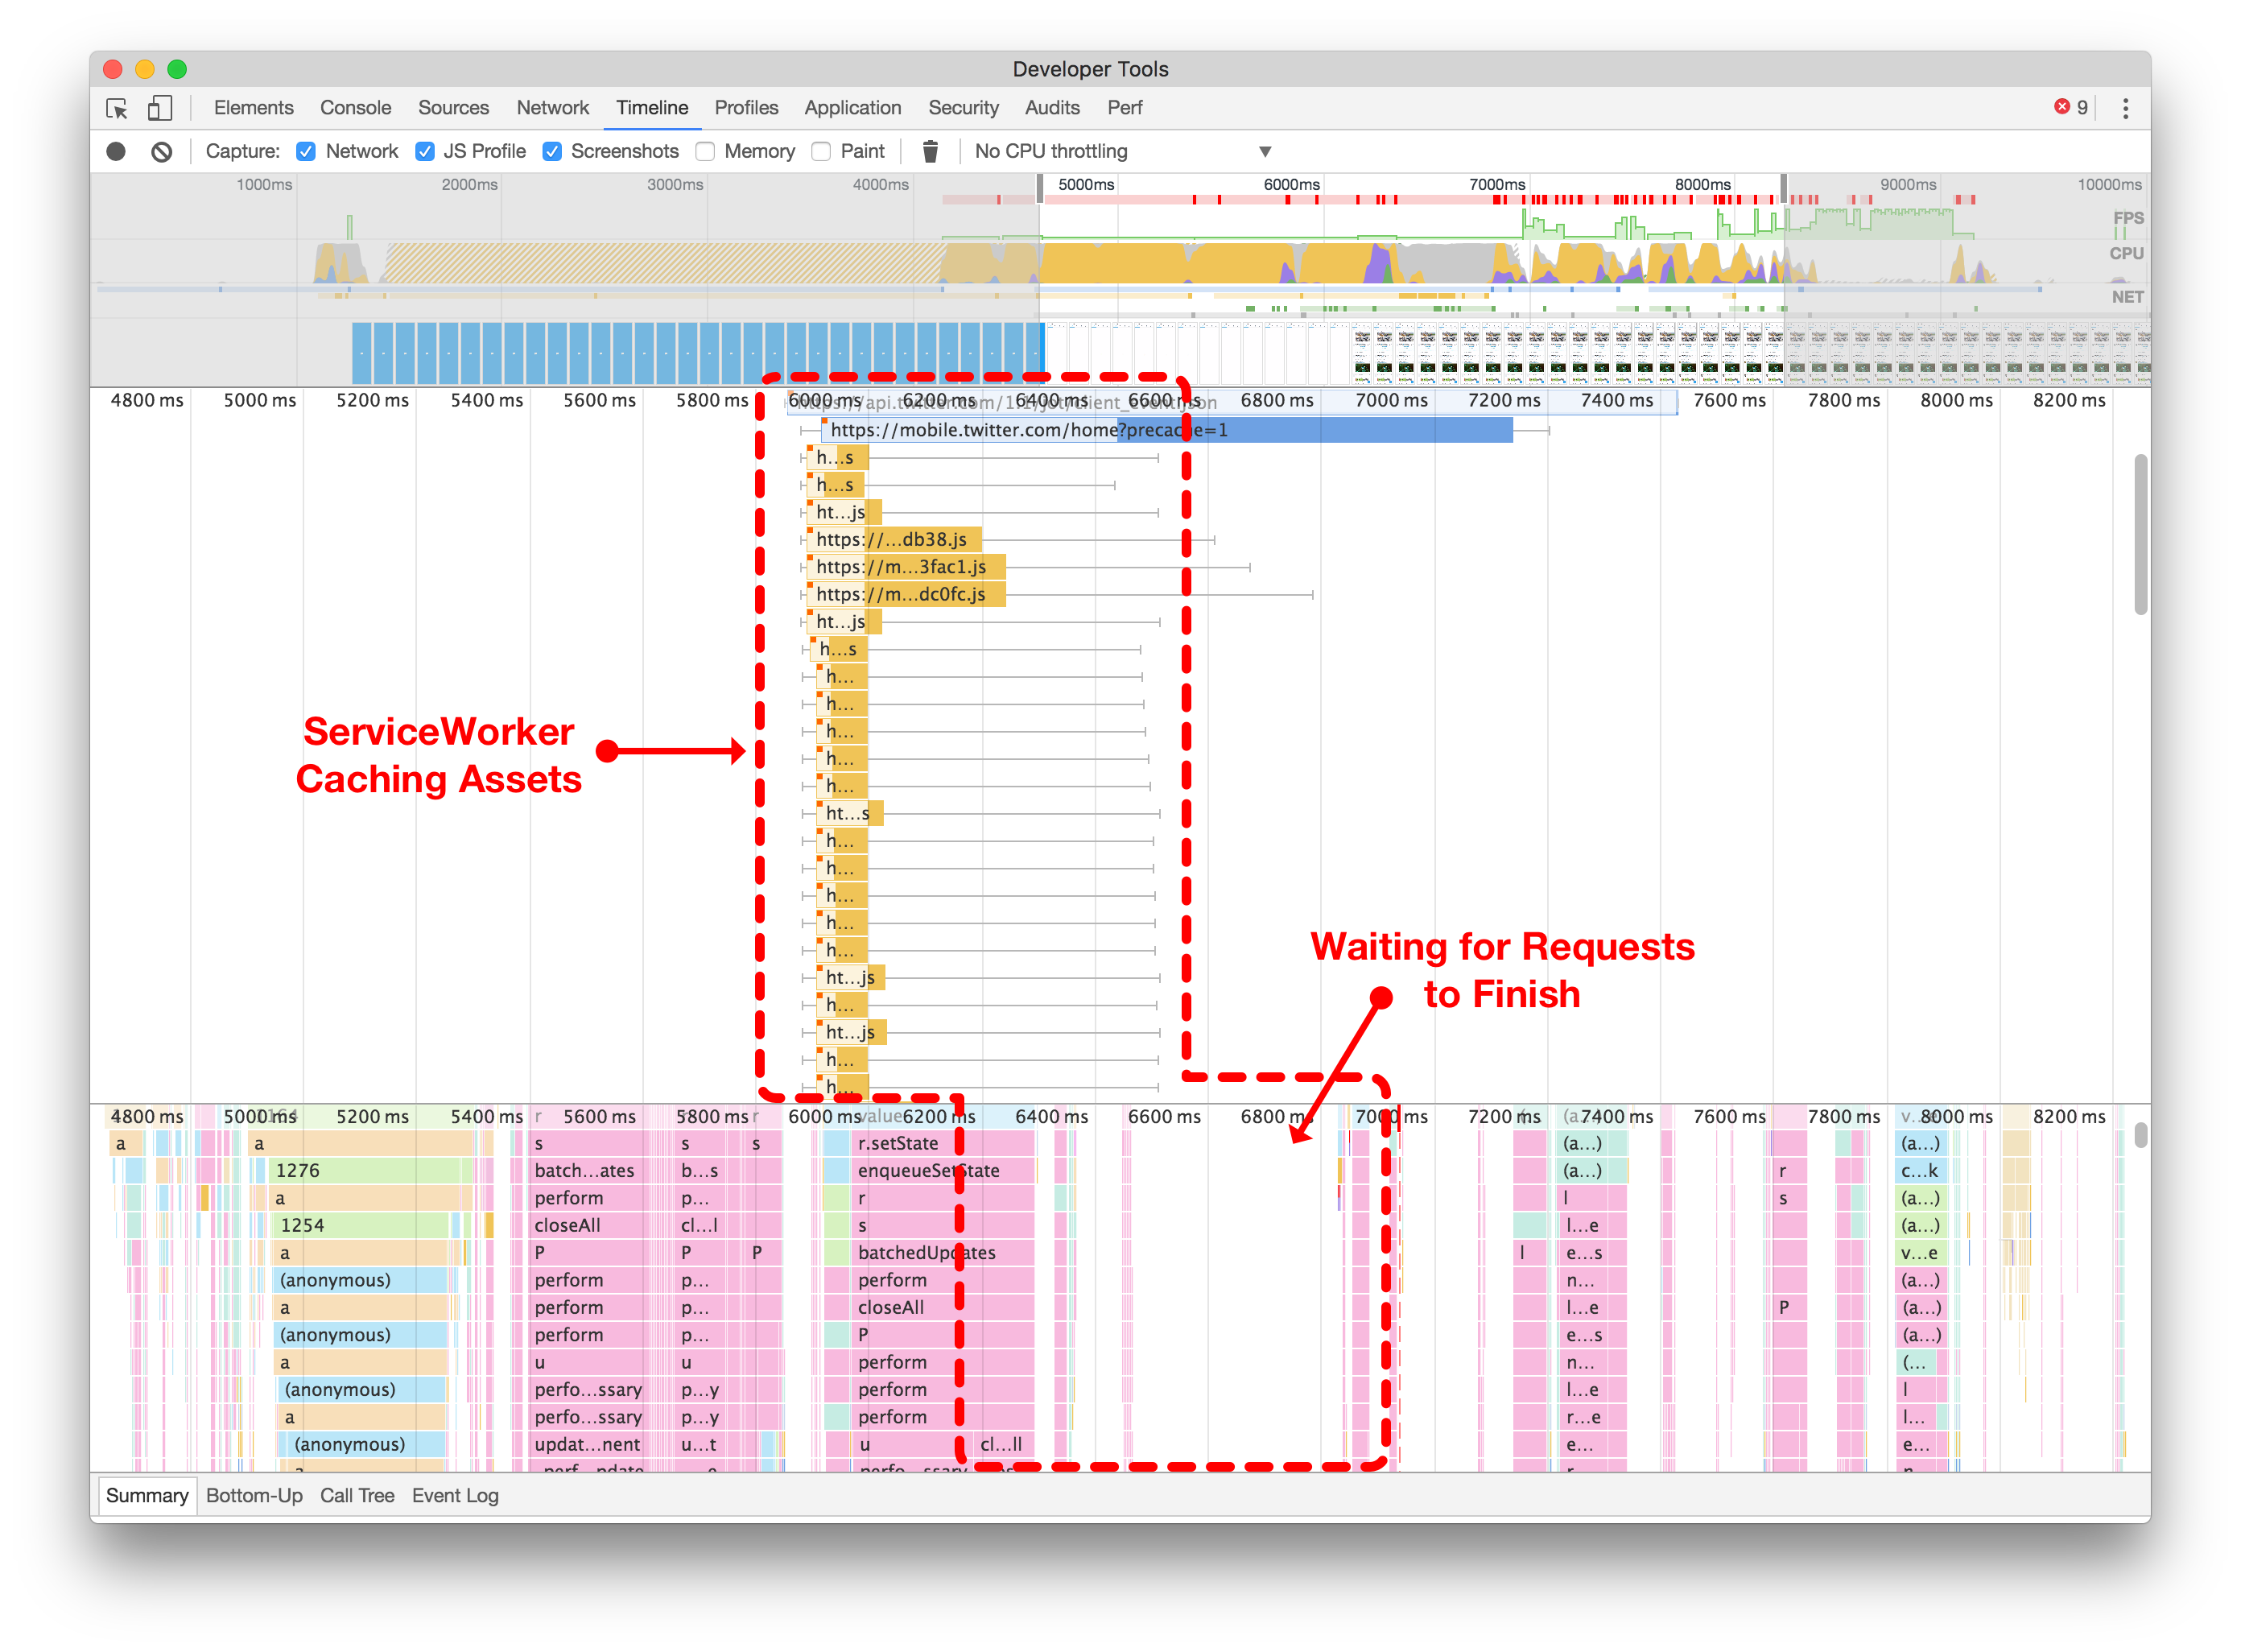
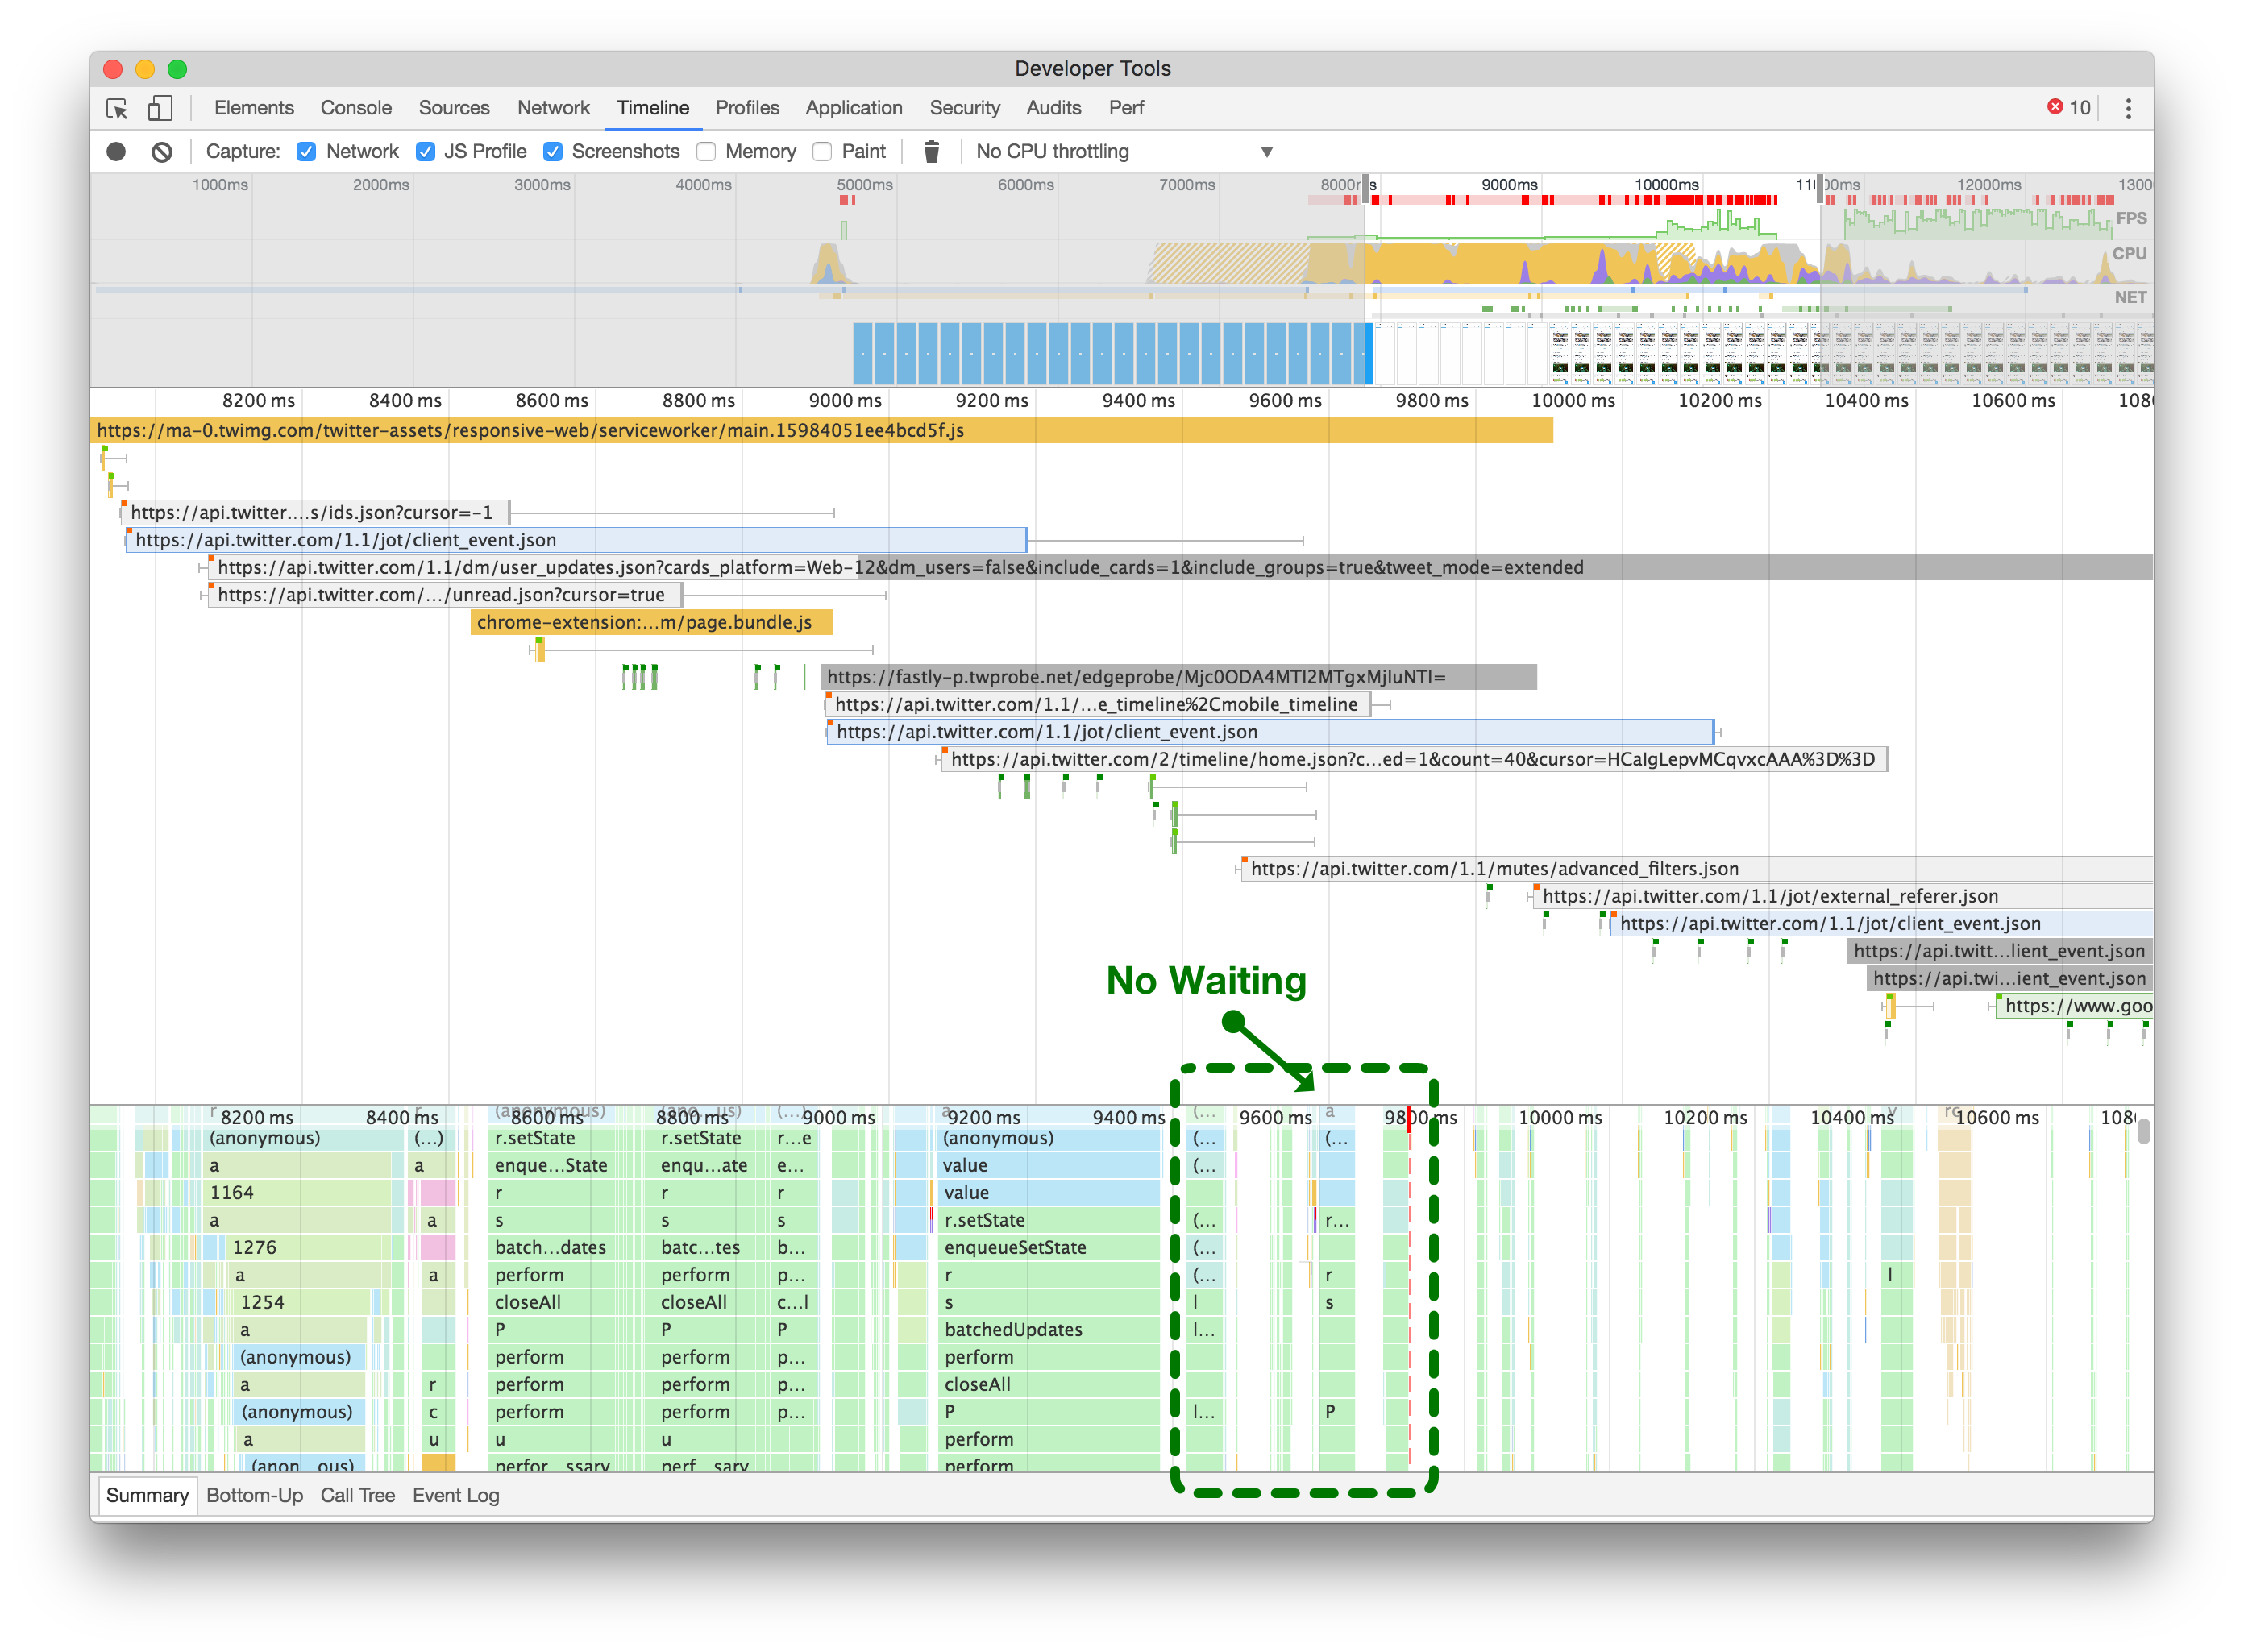
请注意,当立即注册您的服务工作者时,它可以阻止所有其他网络请求(左侧)。推迟服务工作者(右侧)允许您的初始页面加载进行所需的网络请求,而不会被浏览器的并发连接限制阻塞。点击或轻触进行缩放。
By delaying the ServiceWorker registration until we’ve finished loading extra API requests, CSS and image assets, we allow the page to finish rendering and be responsive, as illustrated in the after screenshot (above right).
通过延迟ServiceWorker的注册,直到我们完成加载额外的API请求、CSS和图像资源,我们可以使页面完成渲染并具有响应性,如上图所示(右侧)。
Overall, this is a list of just some of the many improvements that we’ve made over time to Twitter Lite. There are certainly more to come and we hope to continue sharing the problems we find and the ways that we work to overcome them. For more about what’s going on in real-time and more React & PWA insights, follow me and the team on Twitter.
总的来说,这是我们随着时间推移对Twitter Lite进行的一些改进的列表。肯定还有更多的改进即将到来,我们希望继续分享我们发现的问题以及我们努力克服问题的方法。想要了解更多关于实时情况和React&PWA的见解,请在Twitter上关注我和团队。