

Abstract 摘要
Background 背景
Talus cartilage injury leads to changes in biomechanics of the ankle joint and ultimately affects ankle joint function, but which talus cartilage defects require surgery is still uncertain. This research used a finite element method to simulate the effect of different depth of talus cartilage defects on the stress and stability of the ankle joint in a certain area.
距骨软骨损伤会导致踝关节生物力学的改变,并最终影响踝关节功能,但哪些距骨软骨缺损需要手术仍不确定。本研究采用有限元方法模拟不同深度的距骨软骨缺损对踝关节在特定区域应力和稳定性的影响。
Material/Methods 材料/方法
A three-dimensional finite element model with different depths of osteochondral defects was created to simulate and calculate joint stress and displacement of the articular surface of the distal tibia and the proximal talus while the ankle joint was in the push-off, midstance, and heel-strike phases.
建立了一个具有不同深度软骨缺损的三维有限元模型,模拟并计算踝关节处于蹬地、站立中期和脚跟触地阶段时,胫骨远端和距骨近端关节面的关节应力和位移。
Results 结果
The equivalent stress of the proximal talus did not change significantly at a defect depth of 1 mm, whereas the equivalent stress of the upper talus increased significantly at a defect depth of ≥3 mm or more, reaching a maximum value at a defect depth of 10 mm. The equivalent stress of the tibial cartilage and the equivalent stress and displacement in the corresponding forces in the midstance phase and heel-strike phase were significantly different from those in the normal group, but the difference in stress in each defect group was not obvious.
距骨近端的等效应力在缺损深度为 1 mm 时变化不显著,而当缺损深度≥3 mm 时,距骨上端的等效应力显著增加,在缺损深度为 10 mm 时达到最大值。胫骨软骨的等效应力以及站立中期和脚跟触地阶段相应的力引起的等效应力和位移与正常组相比差异显著,但各缺损组之间的应力差异不明显。
Conclusions 结论
The effect of cartilage defects of the talus on biomechanics of the ankle is clear, especially in the midstance and push-off phases. When the defect reaches the subchondral bone (at a depth of 3 mm), the most obvious change in ankle joint stability occurs, and it does not increase linearly with the increase in depth of the defect.
距骨软骨缺损对踝关节生物力学的影响是明显的,尤其是在站立中期和蹬地阶段。当缺损达到软骨下骨(深度为 3 mm)时,踝关节稳定性发生最明显的改变,并且它并不随着缺损深度的增加而线性增加。
MeSH Keywords: Ankle Injuries, Finite Element Analysis, Joint Instability
MeSH 关键词:踝关节损伤,有限元分析,关节不稳定
Background 背景
Ankle sprains are common joint injuries. Every day, 27,000 such injuries occur in the United States and osteochondral lesions occur in up to 70% of sprains and fractures involving the ankle [1,2]. Therefore, talus osteochondral injuries are common ankle injuries requiring clinical attention. Cartilage injuries of the talus include cartilage injuries and subchondral bone injuries, and the avascular characteristics of the talus cartilage prevent it from naturally healing after injury. Therefore, when appropriate treatment is not provided, talus bone cartilage injuries gradually progress, and the area and depth of damage will gradually increase and develop into ankle arthritis, seriously impacting a patient’s quality of life [3,4]. At present, the treatment goal for talus injuries is controversial. Although immediate functional recovery and pain relief are important, long-term outcome should also be fully considered in the treatment process [2]. Factors that affect repair of the talus cartilage include the defect area, location, and depth. Many studies have noted that the defect area in the talus cartilage is an important factor, and choice of treatment is based on the defect area of the cartilage. Currently, however, research is insufficient on the effect of the depth of talus cartilage defects on repair outcome [5,6].
踝关节扭伤是常见的关节损伤,美国每天有 27,000 例此类损伤发生,而距骨骨软骨损伤发生在高达 70%的涉及踝关节的扭伤和骨折中 [ 1 , 2 ]。因此,距骨骨软骨损伤是需要临床关注的常见踝关节损伤。距骨软骨损伤包括软骨损伤和软骨下骨损伤,而距骨软骨的无血管特性使其在受伤后无法自然愈合。因此,当未提供适当治疗时,距骨骨软骨损伤会逐渐进展,损伤的面积和深度将逐渐增加,并发展为踝关节炎,严重影响患者的生活质量 [ 3 , 4 ]。目前,对于距骨损伤的治疗目标存在争议。尽管即时功能恢复和疼痛缓解很重要,但在治疗过程中也应充分考虑长期结果 [ 2 ]。影响距骨软骨修复的因素包括缺损面积、位置和深度。许多研究指出,距骨软骨的缺损面积是一个重要因素,治疗选择基于软骨缺损面积。然而,目前关于距骨软骨缺损深度对修复结果的影响研究尚不充分 [ 5 , 6 ]。
Biomechanical studies on human or cadaver specimens are relatively difficult because of the impact of technical, ethical, cost, and equipment issues. With development of computer technology, three-dimensional (3D) finite element analysis has become a common form of biomechanical simulation. Compared with a conventional specimen model, it has the characteristics of more accurate model research, lower experimental cost, unlimited experimental conditions, and repeatable row height. With finite element analysis, an object is divided into finite elements, which are each assigned material properties and boundary conditions. Simple equations modeling these elements are then constructed and then solved to calculate the internal stress on the entire object being analyzed. In the equations, stress is the force in per unit area, the unit is N/m2 or Pa, and displacement is the deformation that occurs under loading. Therefore, to understand the influence of osteochondral defect depths on ankle mechanics, this study used a 3D finite element simulation of cartilage defects of different depths in the talus ankle joint, considering the ankle’s motion mechanics and gait cycle. The landing phase is the moment when the heel touches the ground, which is the beginning of the supporting phase; in the neutral phase, stress increases in Zone 4 and reaches the maximum value of support. The ground phase is the beginning of the swing period. These three phases represent the support and swing in the gait cycle, and are the three positions that best reflect normal gait and pathological function. By constructing a finite element model of the ankle joint, this research group selected normal cartilage, and 1-, 3-, 5-, and 10-mm defect depth to conduct a 3D finite element analysis to assess ankle joint biomechanics and stability influence.
人体或尸体标本的生物力学研究由于技术、伦理、成本和设备等问题而相对困难。随着计算机技术的发展,三维 (3D) 有限元分析已成为一种常见的生物力学模拟方法。与传统的标本模型相比,它具有模型研究更精确、实验成本更低、实验条件不受限制以及重复性高等特点。在有限元分析中,物体被划分成有限元,每个单元都赋予材料属性和边界条件。然后构建对这些单元进行建模的简单方程,并求解这些方程以计算被分析物体的内部应力。在方程中,应力是单位面积上的力,单位为 N/m²或 Pa,位移是在载荷作用下发生的变形。因此,为了了解骨软骨缺损深度对踝关节力学的影响,本研究使用三维有限元模拟了距骨踝关节不同深度的软骨缺损,考虑了踝关节的运动力学和步态周期。着陆阶段是脚后跟接触地面的时刻,是支撑阶段的开始;在中立阶段,4 区应力增加并达到支撑的最大值;地面阶段是摆动期的开始。 这三个阶段代表了步态周期中的支撑相和摆动相,是能够最好反映正常步态和病理功能的三个位置。通过构建踝关节的有限元模型,该研究小组选择了正常软骨以及 1 毫米、3 毫米、5 毫米和 10 毫米深度缺损进行三维有限元分析,以评估踝关节生物力学及稳定性的影响。
Material and Methods 材料与方法
Software and hardware 软件与硬件
CT scanner: 64 slices, SIEMENS, US;
CT 扫描仪:64 层,西门子,美国;Hardware on the computer used for the simulation: Intel(R) Core(TM) i7-7700K 4.20 GHz, 32G;
用于模拟的计算机硬件:英特尔(R)酷睿(TM)i7-7700K 4.20 GHz,32G;Operating system on the computer used for the simulation: Windows 7 Professional (64 bit);
用于模拟的计算机操作系统:Windows 7 专业版(64 位);Software used for the simulation:
用于模拟的软件:
Geomagic 2012, reverse engineering software, Geomagic, US;
Geomagic 2012,逆向工程软件,Geomagic,美国;Solidworks 2014, CAD modeling software, Dassault, France;
Solidworks 2014,CAD 建模软件,达索,法国;Ansys Workbench 18, general finite element calculation software, Ansys, US.
Ansys Workbench 18,通用有限元计算软件,Ansys,美国。
Modeling process 建模过程
Processing of computed tomography (CT) files and 3D solid reconstruction
计算机断层扫描(CT)文件处理与三维实体重建
An image of the right ankle joint of an adult man in a neutral position was obtained by CT and input into the 3D reconstruction software Mimics in the Dicom format to obtain a clear skeleton outline. After mask processing, the image was read in Geomagic in the STL format, reverse engineering reconstruction was completed, and 3D graphics in the IGES file format were generated (Figure 1).
通过 CT 获取成年男性右踝关节在中立位的图像,并以 Dicom 格式输入到三维重建软件 Mimics 中,得到清晰的骨骼轮廓。经过掩膜处理后,图像以 STL 格式读入 Geomagic,完成逆向工程重建,并生成 IGES 文件格式的三维图形( Figure 1 )。
Figure 1. 图 1.

Diagram of image processing with Geomagic.
Construction of the working condition model
After the foot skeleton and foot contour were built, all ligaments were connected with lines in the physiological position, and a complete foot model was generated. Using anatomical data from the joint surface, cartilage boundaries were established, and cartilage joints were built with Geomagic with an offset thickness of 1 mm. According to requirements of the analysis, only the fibula and tibia of the calcaneal talus, as well as the related cartilages and ligaments, were required to be retained; thus, a relatively complete 3D finite element model of the ankle joint of a normal adult was built. On the basis of the normal model, the talar cartilage was divided into nine regions by the nine-grid partition method. Studies have shown that Area 4 is the most common area for talar cartilage injuries [7]. In this study, defects in the cartilage and subchondral bone in Region 4 of the talus were simulated. The existing literature does not include studies of the depth of finite element and talus injury. Therefore, when conducting the finite element analysis, we started with an experimental measurement depth of 1 mm and increased from there step by step. When we reached 5 mm, we found that increased stress was not linear related with depth, so we added an additional set of 10-mm-depth experiments to verify. Therefore, a defect area with a size of 8×8 mm was set, with cartilage and subchondral bone missing at 1, 3, 5, and 10 mm downward (Figure 2).
Figure 2.

Location and depth of osteochondral loss.
Meshing
The assembled solid model was imported into Ansys Workbench, a Boolean operation was carried out, material parameters were assigned, contact was defined, and then the grid division process was completed. The solid unit comprised Solid 187 and Solid 95, the ligament was a Link180 unit, and its nonlinear characteristics were set under tension without pressure (Figure 3).
Figure 3.
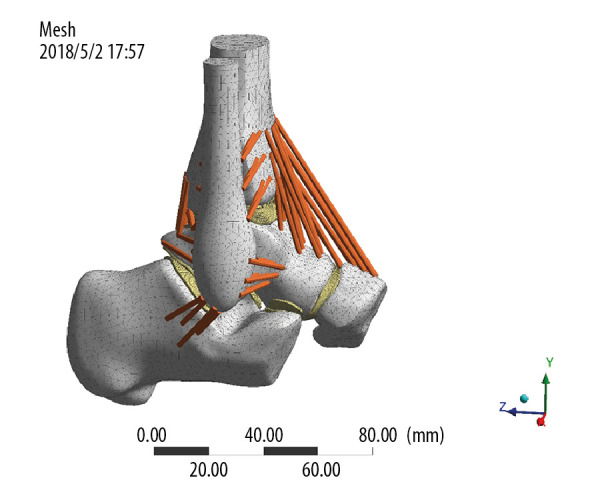
Meshing.
Material parameters
All kinds of tissue materials involved in this model were simplified into isotropic homogeneous elastic materials. Material parameters are listed in Tables 1 and 2.
Table 1.
Properties of bone and cartilage materials.
| Material | Modulus of elasticity (MPa) | Poisson’s ratio |
|---|---|---|
| Bone | 7300 | 0.3 |
| Cartilage | 12 | 0.42 |
Table 2.
Material properties of ligaments.
| Ligament | Modulus of elasticity (MPa) | Poisson’s ratio | Sectional area (mm2) |
|---|---|---|---|
| AtiF | 260 | 0.4 | 18.4 |
| PtiF | 260 | 0.4 | 18.4 |
| AtaFi | 255.5 | 0.4 | 12.9 |
| PtaFi | 216.5 | 0.4 | 21.9 |
| CaTi | 512 | 0.4 | 9.7 |
| AtiTa | 184.5 | 0.4 | 13.5 |
| PtiTa | 99.5 | 0.4 | 22.6 |
| TiCa | 512 | 0.4 | 9.7 |
| TiNa | 320.7 | 0.4 | 7.1 |
AtiF – anterior tibiofibular ligament; PtiF – posterior tibiofibular ligament; AtaFi – anterior talofibular ligament; PtaFi –posterior talofibular ligament; CaTi – calcaneofibular ligament; AtiTa – anterior tibial ligament; PtiTa – posterior tibial talus ligament; TiCa – tibiocalcanean ligament; TiNa – tibionavicular ligament.
Contact settings
Contact between the components was set according to the actual condition. The cartilage was bound to the corresponding bones, and the friction coefficient between the articular surfaces of the cartilage was 0.01.
Applying loads and constraints
Grid direction of the corresponding sites of the calcaneus and scaphoid were constrained so that the degree of freedom was 0. Three gait patterns were selected for analysis according to previous studies, as shown below, and it was assumed that the body weight was 600 N and the foot length was 25.4 cm (Figure 4). After the model was created, we verified that it was similar to those used in previous studies [8,9].
Figure 4.
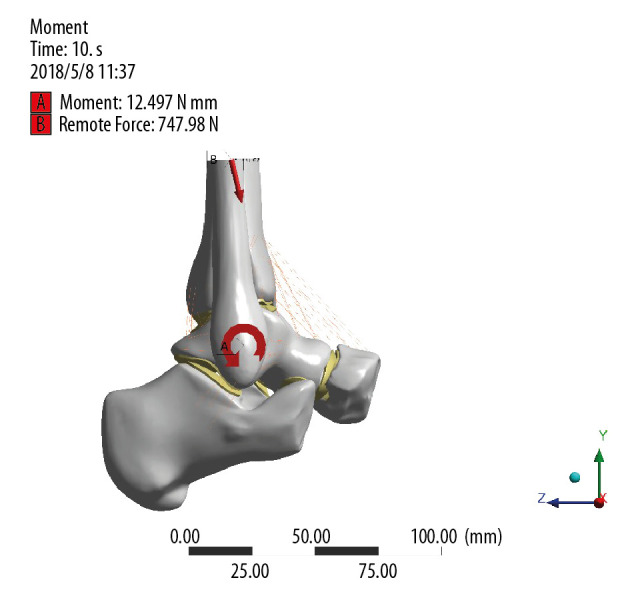
Diagram of constraint and load.
Experimental groups and data acquisition process
After the above model was created, five groups were established for the experiment: the normal talus osteochondral group and groups with defect depths of 1, 3, 5, and 10 mm. In each group, the finite element method and the above model were used to simulate stress on the ankle joint when it was in the push-off, midstance, and heel-strike phases to determine the contact pressure on the joint surface, equivalent stress of the cartilage of the proximal talus and distal tibia in each phase, and displacement of the talus. Stress, contact state and displacement of each component of the ankle joint in the different groups were observed to determine their maximum values and location. Maximum pressure was recorded as the experimental data and analyzed to obtain the column diagram, and the changes in pressure were discussed.
Results
Useing a 3D finite element simulation of osteochondral defects at different depths of the talus, the following was found:
Contact pressure of the articular surface in the heel-strike phase increased with increasing osteochondral defect depths, but the stress did not change significantly. In the midstance and push-off phases, stress increased, but the change was not obvious, and pressure in the midstance phase slightly increased with increasing depths of the defect, but the difference was not obvious. Stress was at the highest level (6.2716 MPa) in the push-off phase when the defect was 1 mm, gradually decreased when the defect was 5 mm, and increased when the defect was 10 mm, but the differences were not obvious. Sstress reached a maximum of 6.4983 MPa when the defect was 10 mm (Table 3).
Equivalent stress at the proximal talus reached its maximum value when defect depth was 10 mm in the heel-strike, midstance, and push-off phases (4.8782 MPa, 13.166 MPa, 12.815 MPa, respectively), and maximum stress value occurred when the depth was 10 mm (13.166 MPa). When the defect was 1 mm, the stress change was not obvious; when the defect was ≥3 mm, equivalent stress on the proximal talus increased significantly, and equivalent stress on the upper talus increased as the depth of the defect increased (Table 4).
Equivalent stress on the tibial cartilage in the heel-strike phase was not significantly different between the defect and normal groups, but there were significant changes in stress in the midstance and push-off phases. There was no significant change in stress between the defect groups. The changes in stress in the talus cartilage were similar to the equivalent stress on the tibial cartilage, and the peak value in stress occurred when the defect depth was 1 mm (5.7413 MPa). Displacement of the talus increased in both the midstance and push-off phases, but there was no significant difference in displacement among the defect groups (Tables 3, 4).
Table 3.
Pressure on the ankle joint surface and displacement of the talus in the heel-strike, midstance, and push-off phases.
| Parameters | Contact pressure | Displacement of the talus | ||||
|---|---|---|---|---|---|---|
| Heel-strike phase | Midstance phase | Push-off phase | Heel-strike phase | Midstance phase | Push-off phase | |
| Normal | 3.7599 | 4.8247 | 4.6199 | 1.9665 | 5.8657 | 5.3314 |
| 8×8×1 | 3.9323 | 6.3312 | 6.2716 | 2.2125 | 7.0086 | 6.3655 |
| 8×8×3 | 4.1333 | 6.3545 | 6.1694 | 2.2113 | 7.0095 | 6.3405 |
| 8×8×5 | 3.9445 | 6.4276 | 5.9603 | 2.2129 | 7.0078 | 6.3649 |
| 8×8×10 | 3.9373 | 6.4983 | 6.1592 | 2.2148 | 6.9936 | 6.3465 |
Table 4.
Equivalent stress on the upper talus and tibial and talus cartilages in the heel-strike, midstance, and push-off phases.
| Parameters | Equivalent stress of upper talus | Equivalent stress of tibial cartilage | Equivalent stress of talus cartilage | ||||||
|---|---|---|---|---|---|---|---|---|---|
| Heel-strike phase | Midstance phase | Push-off phase | Heel-strike phase | Midstance phase | Push-off phase | Heel-strike phase | Midstance phase | Push-off phase | |
| Normal | 2.106 | 4.4531 | 3.1456 | 1.6477 | 2.479 | 2.2873 | 2.2804 | 2.7872 | 2.4853 |
| 8×8×1 | 2.183 | 6.1385 | 4.3914 | 2.2682 | 5.5435 | 3.7991 | 2.4564 | 5.7413 | 5.2679 |
| 8×8×3 | 3.967 | 11.657 | 11.395 | 2.2993 | 5.5473 | 3.7808 | 2.4583 | 5.7256 | 5.2857 |
| 8×8×5 | 4.8589 | 12.185 | 11.71 | 2.2767 | 5.5437 | 3.8008 | 2.4571 | 5.7183 | 5.2519 |
| 8×8×10 | 4.8782 | 13.166 | 12.815 | 2.2621 | 5.5379 | 3.7733 | 2.4376 | 5.7011 | 5.2039 |
Discussion
The main findings of this study are that intra-cartilage defects (1 mm) can have a significant effect on ankle joint contact pressure and, tibial and talus cartilage, and and that stress is on the upper end of the talus is equivalent in the neutral and off-ground phases. When the depth of the defect reaches the subchondral bone, the impact on the ankle joint increases significantly, but as the depth of the defect deepens further, its impact does not increase linearly. Cartilage defects of any depth will cause harm to the ankle joint. When the damage reaches the subchondral bone (3 mm), the stability of the ankle joint changes most obviously. Afterwards, as the depth of the defect increases, its impact does not increase linearly.
The ankle joint bears a heavy load in the human body. Any injury to its anatomical structure will damage its stability. Talus osteochondral injuries are common ankle joint injuries that affect the ankle joint considerably [10]. Changes in intra-articular biomechanics after osteochondral injuries of the talus contribute to progression of ankle arthritis and ultimately affect the function of the ankle joint [11,12]. Currently, clinical treatment options for talus cartilage injury include surgery treatment and conservative therapy. The choice depends on the patient’s age, symptom severity, and type of lesion [13]. Conservative therapy typically is used for Hepple modified magnetic resonance imaging (MRI) type I and milder type II injuries, which involve a smaller lesion area, stable exfoliated bone mass, and non-displaced talus cartilage [14], whereas surgery is require for Hepple type III to V injuries with severe symptoms, when conservative treatment for 3 to 6 months for talus cartilage injury with acute separation and displacement is ineffective, or the area of injury is large [15,16]. Reports in the literature underscore the fact that the area of the talus cartilage defect is an important influencing factor [17–19], and that a lesion range of 15 mm, lack of fracture displacement, and locaton of injury in the anterolateral talus [20,21] often suggest a better prognosis. In contrast, the prognosis is poor when the range is larger than 15 mm, the lesion is located on the medial side, and there is subchondral cystic degeneration and intra-articular osteophyte formation [22]. Study of the effect of the depth of the talus cartilage defect on repair is still insufficient [5,6].
In our study, through finite element simulation of talus cartilage defects at different depths, we found that with increase in the defect depth, equivalent stress at the upper end of the talus increased nonlinearly in the landing, neutral, and off-ground phases. The increase in equivalent stress in the ankle joint articular surface and tibial and talus cartilages in the three phases was not obviously related to the increase of the defect depth. This result suggests that once a defect occurs, it significantly increases stress in each joint surface in the neutral and ground phases of the ankle joint. At the same time, different defect depths have different effects on the increase in stress increase on each joint surface during different phases. Even a defect with a depth of 1 mm will significantly increase the equivalent stress on articular cartilage surfaces of the tibial and talus cartilages, and this increase in equivalent stress is not significantly related to the defect depth. The fundamental reason for this result in our analysis is that the change in equivalent stress depends on the size of the defect area and the strength of the applied pressure. In this experiment, the defect area was relatively fixed, as was the equivalent stress on the articular cartilage. There was no obvious positive correlation between the increase and the defect depth. This was consistent with our previous observations in clinical cases.
The equivalent stress at the upper end of the talus increases with the depth of the defect, and although that change is nonlinear, we suspect that it is due to deformation of the cartilage when the normal joint is loaded, and the arched fiber structure carries the pressure along the direction of the collagen fiber. Relying on calcified cartilage with lower hardness than subchondral bone, it is dispersed to subchondral bone through fluctuation in the tidal line and deformation of the osteochondral interface. In this process, cartilage can only cushion 1% to 3% of the pressure, and normal subchondral bone can absorb about 30% of the joint load [23]. A deeper defect affects the subchondral bone structure and joint load of the talus. As the depth of the defect increases, the equivalent stress on the upper end of the talus increases accordingly. Currently, first-line treatment of talus cartilage injury is still mainly that used for arthroscopic micro-fractures [24]. Previous data, such as the 3D geometric profile of the ankle established using MRI and x-ray, also have found that the depth of the patient’s defect is an important prognostic factor for stage 1 osteochondral lesions of the talus (OCLTs), and can be used as the basis for preoperative surgical decision-making [25]. Although the depth of talus cartilage injury is still somewhat controversial for predicting treatment prognosis, our research results show that once a talus cartilage defect occurs, regardless of its depth, it will significantly increase stress in the talus, therefore, suggesting a need to actively and effectively treat and reduce the volume of talus lesions. We need to give full consideration to treating OCLTs [2].
The change in equivalent stress in the proximal talus in the three gait phases of the talus cartilage defect model was a very significant finding, and one on which we would like to focus. Compared with normal cartilage, equivalent stress in the ankle joint increases at as the depth of talus cartilage defect becomes larger, especially in the neutral and off-ground phases. That can trend can continue to increase by a factor of two, whereas in the ground phase, the impact is relatively small. Although there are various methods for observing and analyzing gait, including video capture in the laboratory or wearable inertial sensor devices [26], a single gait cycle is still divided into support and swing phases, and the heeling ground, neutral, and ground-free phases are taken as the landmark events in the gait cycle [27]. The landing phase, the moment when the heel touches the ground, is the beginning of the support phase. At that time, the front articular surface of the talus (7/8/9 area, Figure 3) is in contact with the tibia, and the area of the talus defect we selected was 4 (Figure 3). Zone 4 is located more posteriorly and medially, and the stress is smaller, so the stress changes at the heel period are not obvious. In the neutral and off-ground phases, however, the stress in the talus Zone 4 increases and reaches its maximum in the neutral phase. Location of stress in the talus during movement of the ankle joint is different. We believe that is the main reason that the biological stress caused by the defect of the talus cartilage increases in three different phases.
In our study, we also studied the relationship between depth of talus defect and displacement of the talus. The distance of talus displacement indicates the stability of the ankle joint, which is one of the important factors in ankle joint biomechanics. Although several non-traumatic causes of OCLTs have beenare recognized, its occurrence is still mostly related to ankle sprains and fractures [28]. This study found that compared with normal cartilage, changes in talus movement at various depths of talus cartilage defects mainly occur in the neutral and off-ground phases, and have little effect on ground-phase talus displacement. As the depth of talus cartilage defect increases gradually, talus displacement increases slowly and there is a nonlinear positive correlation between the two. It has been suggested that once a defect in talus cartilage is found, it may cause ankle instability. We speculate that the reason may be related to the anatomy of the anterior wide and narrow talus. When in the ground phase, the ankle joint is in the dorsal extension position, and the ankle joint is relatively stable; while in the neutral and off-ground phases, the stability of the ankle joint is reduced, so the biomechanical impact of the talus cartilage defect is more obvious. From the perspective of the depth of the defect, an intra-cartilage defect (1 mm) can have a significant impact on the stability of the ankle joint. When the subchondral bone (3 mm) is reached, the stability of the ankle joint changes most significantly, and when the depth of the defect increases, the impact doesl not increase linearly. That finding shows that the influence of osteochondral defects on the stability of ankle joints has little to do with the depth of the defect. Any depth of cartilage defects will cause harm to the ankle joint. After the defect reaches the subchondral bone, the harm to the ankle joint is more obvious. Therefore, for any depth of talus cartilage defect, the impact on joint stress and stability should be considered in decision-making about targeted treatment so as to reduce damage caused by the defect to the ankle joint. If the defect depth reaches the subchondral bone or a deeper level, bone grafting should be actively considered to restore the smoothness of the articular surface of the talus, reduce changes in ankle joint stress, and reduce damage to the ankle joint in later weight-bearing activities.
Currently, application of a 3D finite element model has led to advances in research and progress in study of biomechanics of the foot and ankle, but there are still certain deficiencies. The mechanical properties of the talus during gait are quite complicated. Although our model can simulate the anatomy of the talus and surrounding structures more realistically and accurately, we are studying ways to improve the model materials and simply the finite element model. The next step in our research is to further verify the results of this experiment in clinical or cadaver samples.
Conclusions
With the use of a finite element model, we have demonstrated the effect of cartilage defects of the talus on the biomechanics of the ankle, especially in the midstance and push-off phases. When the defect reaches the subchondral bone (at a depth of 3 mm), the most obvious change in the stability of the ankle joint occurs, and the effect does not increase linearly with the increase in depth of the defect.
Footnotes
Source of support: Departmental sources
References
- 1.Savage-Elliott I, Ross KA, Smyth NA, et al. Osteochondral lesions of the talus: A current concepts review and evidence – based treatment paradigm. Foot Ankle Spec. 2014;7:414–22. doi: 10.1177/1938640014543362. [DOI] [PubMed] [Google Scholar]
- 2.Hannon CP, Smyth NA, Murawski CD, et al. Osteochondral lesions of the talus: Aspects of current management. Bone Joint J. 2014;96-B:164–71. doi: 10.1302/0301-620X.96B2.31637. [DOI] [PubMed] [Google Scholar]
- 3.Gianakos AL, Yasui Y, Hannon CP, Kennedy JG. Current management of talar osteochondral lesions. World J Orthop. 2017;8:12–20. doi: 10.5312/wjo.v8.i1.12. [DOI] [PMC free article] [PubMed] [Google Scholar]
- 4.Li X, Zhu Y, Xu Y, et al. Osteochondral autograft transplantation with biplanar distal tibial osteotomy for patients with concomitant large osteochondral lesion of the talus and varus ankle malalignment. BMC Musculoskelet Disord. 2017;18:23. doi: 10.1186/s12891-016-1367-2. [DOI] [PMC free article] [PubMed] [Google Scholar]
- 5.Shimozono Y, Yasui Y, Ross AW, Kennedy JG. Osteochondral lesions of the talus in the athlete: up to date review. Curr Rev Musculoskelet Med. 2017;10:131–40. doi: 10.1007/s12178-017-9393-8. [DOI] [PMC free article] [PubMed] [Google Scholar]
- 6.Liao W, Li Z, Li T, et al. Proteomic analysis of synovial fluid in osteoarthritis using SWATHmass spectrometry. Mol Med Rep. 2018;17:2827–36. doi: 10.3892/mmr.2017.8250. [DOI] [PMC free article] [PubMed] [Google Scholar]
- 7.Raikin SM, Elias I, Zoga AC, et al. Osteochondral lesions of the talus: localization and morphologic data from 424 patients using a novel anatomical grid Scheme. Foot Ankle Int. 2007;28(2):154–161. doi: 10.3113/FAI.2007.0154. [DOI] [PubMed] [Google Scholar]
- 8.Lu CH. Establishment of talus numerical simulation model and finite element analysis. Southern Medical University; 2011. [Google Scholar]
- 9.Giddings VL, Beaupr GS, Whalen RT, et al. Calcaneal loading during walking and running. Med Sci Sports Exercise. 2000;32(3):627–34. doi: 10.1097/00005768-200003000-00012. [DOI] [PubMed] [Google Scholar]
- 10.Georgiannos D, Bisbinas I, Badekas A. Osteochondral transplantation of autologous graft for the treatment of osteochondral lesions of talus: 5- to 7-year follow-up. Knee Surg Sports Traumatol Arthrosc. 2016;24:3722–29. doi: 10.1007/s00167-014-3389-3. [DOI] [PubMed] [Google Scholar]
- 11.Torcato LB, Pellizzer EP, Verri FR, et al. Influence of parafunctional loading and prosthetic connection on stress distribution: A 3D finite element analysis. J Prosthet Dent. 2015;114:644–51. doi: 10.1016/j.prosdent.2015.04.018. [DOI] [PubMed] [Google Scholar]
- 12.Hong YN, Shin CS. Gender differences of sagittal knee and ankle biomechanics during stair-to-ground descent transition. Clin Biomech (Bristol, Avon) 2015;30:1210–17. doi: 10.1016/j.clinbiomech.2015.08.002. [DOI] [PubMed] [Google Scholar]
- 13.Laffenetre O. Osteochondral lesions of the talus: Current concept. Orthop Traumatol Surg Res. 2010;96(5):554–66. doi: 10.1016/j.otsr.2010.06.001. [DOI] [PubMed] [Google Scholar]
- 14.Zengerink M, Struijs PA, Tol JL, et al. Treatment of osteochondral lesions of the talus: A systematic review. Knee Surg Sports Traumatol Arthrosc. 2010;18(2):238–46. doi: 10.1007/s00167-009-0942-6. [DOI] [PMC free article] [PubMed] [Google Scholar]
- 15.Rungprai C, Tennant JN, Gentry RD, et al. Management of osteochondral lesions of the talar dome. Open Orthop J. 2017;11:743–61. doi: 10.2174/1874325001711010743. [DOI] [PMC free article] [PubMed] [Google Scholar]
- 16.Myerson MS. Osteochondral lesions of the talus. Foot Ankle Clin. 2013;18(1):278–82. doi: 10.1016/j.fcl.2012.12.011. [DOI] [PubMed] [Google Scholar]
- 17.Hannon CP, Murawski CD, Fansa AM, et al. Microfracture for osteochondral lesions of the talus: A systematic review of reporting of outcome data. Am J Sports Med. 2012;41(3):689–95. doi: 10.1177/0363546512458218. [DOI] [PubMed] [Google Scholar]
- 18.Ramponi L, Yasui Y, Murawski CD, et al. Lesion size is a predictor of clinical outcomes after bone marrow stimulation for osteochondral lesions of the talus: A systematic review. Am J Sports Med. 2017;45(7):1698–705. doi: 10.1177/0363546516668292. [DOI] [PubMed] [Google Scholar]
- 19.Toale J, Shimozono Y, Mulvin C, et al. Midterm outcomes of bone marrow stimulation for primary osteochondral lesions of the talus: A systematic review. Orthopaedic J Sports Med. 2019;7(10) doi: 10.1177/2325967119879127. 2325967119879127. [DOI] [PMC free article] [PubMed] [Google Scholar]
- 20.Chuckpaiwong B, Berkson EM, Theodore GH. Microfracture for osteochondral lesions of the ankle: Outcome analysis and outcome predictors of 105 cases. Arthroscopy. 2008;24(1):106–12. doi: 10.1016/j.arthro.2007.07.022. [DOI] [PubMed] [Google Scholar]
- 21.Choi WJ, Jo J, Lee JW. Osteochondral lesion of the talus: Prognostic factors affecting the clinical outcome after arthroscopic marrow stimulation technique. Foot Ankle Clin. 2013;18(1):67–78. doi: 10.1016/j.fcl.2012.12.004. [DOI] [PubMed] [Google Scholar]
- 22.Yoshimura I, Kanazawa K, Takeyama A, et al. Arthroscopic bone marrow stimulation techniques for osteochondral lesions of the talus: Prognostic factors for small lesions. Am J Sports Med. 2013;41(3):528–34. doi: 10.1177/0363546512472979. [DOI] [PubMed] [Google Scholar]
- 23.Pan J, Zhou X, Li W, et al. In situ measurement of transport between subchondral bone and articular cartilage. J Orthop Res. 2009;27:1347–52. doi: 10.1002/jor.20883. [DOI] [PMC free article] [PubMed] [Google Scholar]
- 24.Choi SW, Lee GW, Lee KB. Arthroscopic microfracture for osteochondral lesions of the talus: functional outcomes at a mean of 6.7 years in 165 consecutive ankles. Am J Sports Med. 2020;48(1):153–58. doi: 10.1177/0363546519887957. [DOI] [PubMed] [Google Scholar]
- 25.Angthong C, Yoshimura I, Kanazawa K, et al. Critical three-dimensional factors affecting outcome in osteochondral lesion of the talus. Knee Surg Sports Traumatol Arthrosc. 2013;21(6):1418–26. doi: 10.1007/s00167-013-2364-8. [DOI] [PubMed] [Google Scholar]
- 26.Benson LC, Clermont CA, Bošnjak E, Ferber R. The use of wearable devices for walking and running gait analysis outside of the lab: A systematic review. Gait Posture. 2018;63:124–38. doi: 10.1016/j.gaitpost.2018.04.047. [DOI] [PubMed] [Google Scholar]
- 27.Grant AD. Gait analysis: Normal and pathological function. JAMA. 2010;304(8):907. [Google Scholar]
- 28.Looze CA, Capo J, Ryan MK, et al. Evaluation and management of osteochondral lesions of the talus. Cartilage. 2017;8(1):19–30. doi: 10.1177/1947603516670708. [DOI] [PMC free article] [PubMed] [Google Scholar]