这是用户在 2024-3-25 15:06 为 https://snip.mathpix.com/haoyuw57/notes/692d4814-054f-4034-b1e8-3a7565b5f639/edit 保存的双语快照页面,由 沉浸式翻译 提供双语支持。了解如何保存?
According to Hair et al. [61], the definition of convergent validity is the degree to which a measure is positively correlated with the alternative measures of the same construct. The validity was assessed on the basis of two criteria: (i) the standardised factor loading (or item loading) should be greater than 0.50 and significant [61], and (ii) the average variance extracted (AVE) for all constructs must be at least 0.50 [62]. As can be seen in Table 4, the standardised factor loading for all items are greater than the threshold value of 0.50 , where the minimum item loading is 0.654 and is thus significant. In addition, the values of all AVE range between 0.517 and 0.857 , which are greater than the 0.50 threshold value recommended by Fornell and Larcker [62]. Therefore, the convergent validity has been proven to be good as all constructs fulfilled the above-mentioned criteria.

\subsection*{4.2.3. Discriminant Validity}

The definition of discriminant validity given by Hair et al. [61] is the degree to which a construct is truly distinct from others based on empirical standards. This validity is measured by comparing the AVE value of each construct with the squared correlation between these constructs as well as with all other constructs [35]. The results presented in Table 4 shows that the AVE values for all constructs are higher than the squared correlation and meet the requirement proposed by Fornell and Larcker [62]. Thus, the discriminant validity in this study is acceptable.

\subsection*{4.3. Evaluation of the Structural Model}

After confirming the validity and reliability of the measurement model, the recommended hypotheses were evaluated using covariance-based structural equation model (CB-SEM). Results showed that the model for exploring the determinants of passengers' satisfaction with the Kuala Lumpur LRT service is well-fitted as all values of the goodnessof-fit indices $\left(\chi^{2} / \mathrm{df}=2.63, \mathrm{CFI}=0.95, \mathrm{NFI}=0.93, \mathrm{GFI}=0.95, \mathrm{AGFI}=0.93, \mathrm{RMSEA}=0.07\right)$ satisfy the requirement for fit criteria. The overall model structure with the standardised estimates and the significance of the relationship between the constructs is illustrated in Figure 3. The structural equation model (see Figure 3) explained $28 \%$ of the variance in perceived quality, $61 \%$ of the variance in perceived value, and $76 \%$ of the variance in passenger satisfaction.

![](https://cdn.mathpix.com/cropped/2024_03_22_30fd31a2d83817f3f9dcg-09.jpg?height=691&width=1248&top_left_y=857&top_left_x=587)

Figure 3. Structural equation model.

Hypotheses 1 to 3 suggest that passenger expectation has a positive impact on perceived quality, perceived value and passenger satisfaction. The standardised regression coefficient presented in Figure 3 shows that passenger expectation has a significant positive and direct effect on perceived quality $(\beta=0.526, p<0.001)$ and perceived value $(\beta=0.115$, $p<0.05)$ and not significant effect on passenger satisfaction $(\beta=0.075, p>0.05)$. Thus, hypotheses 1 and 2 are supported, while hypothesis 3 is not supported. The positive relationship between perceived quality and perceived value and between perceived quality and passenger satisfaction is stated in hypotheses 4 and 5 . The results indicate that perceived quality has a significant positive influence on perceived value $(\beta=0.532, p<0.001)$ and passenger satisfaction $(\beta=0.361, p<0.001)$. These results confirm hypotheses 4 and 5. Hypothesis 6 states that perceived value has a positive impact on passenger satisfaction, and the result showed a significant positive relationship between the two constructs $(\beta=0.238, p<0.001)$. Therefore, hypothesis 6 is accepted. A summary of the hypothesis testing model is given in Table 5.

Table 5. Summary of hypothesis testing model.

\begin{tabular}{cccccc}
\hline Hypothesis & & Relationship & & Hypothesis \\
\hline H1 & Passenger expectation & with & Perceived quality & $0.526^{* *}$ & Supported \\
H2 & Passenger expectation & with & Perceived value & $0.115^{*}$ & Supported \\
H3 & Passenger expectation & with & Passenger satisfaction & $0.075^{\text {n.s. }}$ & Not supported \\
H4 & Perceived quality & with & Perceived value & $0.532^{* *}$ & Supported \\
H5 & Perceived quality & with & Passenger satisfaction & $0.361^{* *}$ & Supported \\
H6 & Perceived value & with & Passenger satisfaction & $0.238^{* *}$ & Supported \\
\hline
\end{tabular}

Note: H, Hypothesis; $\beta$, Standardised regression coefficient; ${ }^{*} p<0.05,{ }^{* *} p<0.001 ;$ n.s., not significant.

\section*{5. Discussion of the Results}

\subsection*{5.1. Theoretical Implications}

This study aims to explore the determinants of passenger satisfaction in the context of light rail transit (LRT) service in Kuala Lumpur, Malaysia, which is an alpha city in the South Asian region, by investigating the role of passenger expectation, perceived quality and perceived value based on the passengers' past experience with the Kuala Lumpur's LRT service. The interrelationship of the model was tested using a set of data obtained through a customer satisfaction survey of the urban rail transit in Kuala Lumpur, Malaysia using a structural equation model approach. The conceptual framework in this study was assessed and validated, and this theoretically contributed to the understanding of the factors influencing passengers' satisfaction with the urban rail transit. It is crucial to explore the factors influencing passengers' satisfaction with the urban rail transit, especially in the context of Malaysia, given that rail transit is one of the government's strategies to reduce the dependency on private motorised transport and to increase the public transport modal share up to $40 \%$ in 2030 [63]. Specifically, the rail transit in the urban area of the future will be the backbone of the public transport network in the city.

According to this study, three factors-namely passenger expectation, perceived quality and perceived value - can have a direct or indirect impact on passenger satisfaction. The outcomes of this study are congruent with the earlier research in transportation. The present study found that passenger expectation has a direct and significant effect on perceived quality, perceived value and passengers' satisfaction level towards the LRT service. Put differently, passenger expectation not only has a direct influence on their level of satisfaction, but it also has an indirect influence on passenger satisfaction via perceived quality and perceived value. This finding is congruent with those made by Shen et al. [22] and Zhang et al. [33]. The findings also confirmed the positive influence of perceived quality on perceived value and passenger satisfaction reported in various previous research $[23,43-48]$. Similar with the evidences provided by previous studies, the structural equation model used in this study justifies the significant and positive influence of perceived value on satisfaction with the LRT service [53-58]. Hence, passenger expectation, perceived quality and perceived value can be considered as antecedents to passengers' satisfaction with the LRT service in Kuala Lumpur.

Of the three factors influencing the satisfaction level of the passengers of Kuala Lumpur LRT service, perceived quality was found to be the strongest determinant of the feeling of satisfaction among passengers. This finding is consistent with those of recent works in the field of public transport [22,23,38,53]. It is apparent that passengers who use urban rail transit service, in this context the LRT, have a higher level of satisfaction when the service provided is beyond their expectation. In other words, the high-quality service brings about a higher level of satisfaction with the LRT service. According to Ibrahim et al. [13], punctuality, number of trips per day, ticket price or types of passes, cleanliness and comfort in both in the train and at the station, safety on the train and at the station, customer service and more are the main elements of service quality that have been proven to affect perceived service quality as well as passengers' satisfaction with rail-based public transport. This study also found that passengers would be more satisfied with the LRT service if they felt that the trip with the LRT was good value. In this study, value is made up of perceived cost (monetary) and perceived benefits (non-monetary) [52]. The low cost of the trip, short travel time, and comfort during the journey are the indicators that contribute to the perceived value in public transport generally and in urban rail transit specifically. Given that these factors have a direct effect on passenger satisfaction, they have to be given serious consideration in the effort to enhance passengers' satisfaction with the LRT service.

standard


影响阿尔法城市轻轨乘客满意度的因素:利用结构方程模型分析马来西亚吉隆坡的证据

Ahmad Nazrul Hakimi Ibrahim 1[(), Muhamad Nazri Borhan 1,2,*(1), Muhamad Razuhanafi Mat Yazid 1,2(1),Riza Atiq Rahmat 1 1 ^(1){ }^{1}1 and Sotaro Yukawa 3 3 ^(3){ }^{3}31 Department of Civil Engineering, Faculty of Engineering and Built Environment, Universiti KebangsaanMalaysia, Bangi 43600, Malaysia; nazrulhakimi@siswa.ukm.edu.my (A.N.H.I.);razuhanafi@ukm.edu.my (M.R.M.Y.); rizaatiq@ukm.edu.my (R.A.R.)
2 工程与建筑环境学院可持续城市交通研究中心(SUTRA)、
Universiti Kebangsaan Malaysia, Bangi 43600, Malaysia
3 大阪商科大学经济学部,东大阪市御栗屋前町、
Osaka 577-8505, Japan; s77yukawa@nifty.com* Correspondence: mnazri_borhan@ukm.edu.my


引用:Ibrahim, A.N.H.; Borhan, M.N.; Mat Yazid, M.R.; Rahmat, R.A.; Yukawa, S. Factors Influencing Passengers' Satisfaction with the Light Rail Transit Service in Alpha Cities:使用结构方程建模从马来西亚吉隆坡获得的证据》。Mathematics 2021, 9, 1954. https://doi.org/10.3390/math9161954IF: 2.4 Q1
Academic Editors: Gregorio Esteban Giménez and Javier Valbuena

收到:2021 年 7 月 27 日

接受:2021 年 8 月 12 日

出版日期:2021 年 8 月 16 日

出版商注:MDPI 对出版地图和机构隶属关系中的管辖权主张保持中立。

版权所有:(c) 2021 年,作者。授权方:MDPI,瑞士巴塞尔。本文是根据知识共享署名(CC BY)许可条款和条件发布的开放存取文章(https:// creativecommons.org/licenses/by/ 4.0 / 4.0 / 4.0//4.0 /4.0/ )。

 摘要


政策制定者和服务提供者必须充分了解乘客对轻轨交通(LRT)满意度的决定因素,以便能够制定有效的战略,确保乘客满意,从而有助于留住现有乘客并吸引新乘客。这被视为轻轨服务长期财务业绩的最重要决定因素。在此背景下,本研究试图确定乘客期望、感知质量和感知价值对其服务满意度的影响。本研究从马来西亚吉隆坡的轻轨乘客中收集了 417 份自填问卷。使用结构方程模型对提出的模型进行了检验。结果证明,感知质量和感知价值对乘客满意度有明显的直接影响。在这些因素中,感知质量是决定轻轨乘客满意度的最关键因素。本研究最后得出了对交通运输领域的理论和管理影响。本研究提供了有益的信息,有助于服务提供商、当局、政策制定者、规划者和研究人员制定有效的战略,以提高轻轨服务的使用率,尤其是在马来西亚吉隆坡以及其他阿尔法城市和大都市。


关键词:轻轨;公共交通;铁路;服务质量;满意度;结构方程模型

 1.导言


全球许多城市的人口快速增长和城市发展导致了大规模的城市化和城市面貌的复杂变化。这是越来越多的农村人口为了寻求更好的就业和教育机会而向城市地区迁移所面临的现象之一;这也促进了更高程度的城市聚集。例如,欧洲国家约 80 % 80 % 80%80 \%80% 的城市人口就是城市化现象的结果[1]。这一现象的主要影响是对交通的更高需求。在这方面,提供适当的公共交通网络对于减少对机动交通的依赖至关重要。Kwan 等人[2]强调,不完善的公共交通网络会导致人们依赖机动交通工具出行。这造成了一系列社会经济负担,包括严重的交通拥堵、道路事故风险、更长的旅行时间、更高的成本以及空气污染和高二氧化碳排放等环境问题[2-4]。此外,使用机动车


由于空气和噪音污染以及非自愿采用久坐不动的生活方式,交通会对人类健康产生不利影响 [ 5 , 6 ] [ 5 , 6 ] [5,6][5,6][5,6] 。.

作为东南亚最发达的国家之一,马来西亚经历了显著的城市化和城市聚集。预计到 2020 年,马来西亚的城市化率将达到约 70%[7]。吉隆坡是马来西亚都市区迅速扩张和城市大规模发展的城市之一。吉隆坡是马来西亚的金融、文化和经济中心,也是马来西亚三个联邦直辖区之一[8]。吉隆坡的人口密度非常高,有 6891 人 / k m 2 / k m 2 //km^(2)/ \mathrm{km}^{2}/km2 。.2016 年吉隆坡人口为 176 万,预计到 2020 年吉隆坡人口将达到 220 万 [ 8 , 9 ] [ 8 , 9 ] [8,9][8,9][8,9] 。.作为首府城市,吉隆坡是高科技发展、教育培训、商业和金融、国际商业和贸易等多项活动的中心,所有这些都影响着市内的出行次数。吉隆坡地区的出行主要使用汽车和摩托车等私人机动交通工具。Chuen 等人[10] 和 Kwan 等人[2] 发现,吉隆坡仅有 17% (124 万人次)的出行使用公共交通, 83 % 83 % 83%83 \%83% (600 万人次)的出行使用公共交通。(600万)的出行是乘坐私人机动交通工具。此外,Mohamad 和 Kiggudu [11] 报告称,早高峰时段在主要道路上行驶的 70 % 70 % 70%70 \%70% 辆车是单人车。这些证据证明,吉隆坡居民使用的通勤方式效率极低。这也导致了之前的研究[10-13]中讨论的对私人机动车的依赖所带来的负面影响。

大量交通文献都认为,公共交通是全球促进可持续交通 [ 2 , 13 , 14 ] [ 2 , 13 , 14 ] [2,13,14][2,13,14][2,13,14] 的重要因素。.例如,在吉隆坡,轨道交通服务提供了一种高效、可靠、经济且环保的出行方式。然而,根据 Masirin 等人的研究[15],吉隆坡轨道交通的乘客量仍然很低,尽管政府在过去几十年中一直在进行大量投资,以鼓励使用轨道交通并增加轨道交通的乘客量。同样,Zulkifli 等人[16]和 Ibrahim 等人[17]报告说,亚洲交通文献中最令人担忧的问题之一就是轨道交通的低乘客率。吉隆坡轨道交通的低乘客率与全球许多其他地区公共交通的低使用率类似 [ 13 , 18 ] [ 13 , 18 ] [13,18][13,18][13,18] 。.一般来说,公共交通使用率低的原因是与公共交通相比,使用私人交通工具更方便,包括更灵活、更舒适、更私密和更快捷[1,19]。

根据 Kwan 等人的研究[2],吉隆坡居民使用铁路通勤的意愿较低,原因之一是轨道交通网络仅连接了 10 20 % 10 20 % 10-20%10-20 \%1020% 市区。此外,一些研究报告指出,乘客对使用轨道交通缺乏热情的原因是轨道交通未能提供乘客所期望的高质量服务 [ 13 , 20 , 21 ] [ 13 , 20 , 21 ] [13,20,21][13,20,21][13,20,21] 。.这引起了乘客对所提供服务的不满。根据 Shen 等人的研究[22],对公共交通服务不满意的乘客不会忠诚于该服务,也不会向他人推荐该服务。许多研究对乘客对轨道交通的满意度进行了调查[22-24],结果表明,乘客对所提供服务的满意度是影响他们决定今后是否使用和向他人推荐铁路服务的主要因素。因此,提供符合乘客期望的优质服务将使乘客满意,进而确保乘客留住乘客,吸引潜在乘客使用服务。

正如各种市场营销和运输文献所指出的,公共交通服务能否在运输市场上生存,能否与其他形式的出行方式竞争,其成功的指标之一就是该系统能够留住和吸引的乘客数量 [ 22 , 25 ] [ 22 , 25 ] [22,25][22,25][22,25] 。.因此,有一个关键的


当局和轨道交通服务提供商需要确定所提供的服务是否能充分满足乘客的需求和满意度。此外,还必须确定影响乘客对轨道交通满意度的因素,以便研究人员、政策制定者、工程师、服务提供商和当局能够制定战略措施,提高乘客对轨道交通的满意度,从而增加乘客数量。因此,本文试图以吉隆坡轻轨(LRT)为例,研究影响轨道交通乘客满意度的因素。本文采用基于协方差的结构方程模型(CB-SEM)方法来评估乘客期望、感知质量、感知价值和乘客对轻轨服务满意度等构念之间的关系。这种方法有几个优点。从统计学的角度来看,SEM 是一种先进的线性模型方法,涉及多元回归分析,以研究假设模型与所收集数据的一致性[26]。此外,Williams 等人[27]指出,SEM 是一种多变量分析方法,用于评估和评价构建物之间复杂的因果关系,即使这种关系是假设的直接关系或无法直接观察到。一般来说,SEM 方法在社会科学和管理学研究中比较流行和受青睐,因为它可以有效地评估测量模型和结构路径,尤其是当结构模型由多个因变量、基于多项目指标变量的潜在构念以及结构模型中的多个阶段/层次的构念组成时[28]。由于其稳健性,SEM 方法在交通领域受到关注。本研究希望提供有用的信息,帮助服务提供商、当局、政策制定者、规划者和研究人员制定有效的战略,提高轨道交通的使用率,尤其是在吉隆坡以及其他阿尔法城市和大都市。

本文的其余部分安排如下。第 2 节讨论所查阅的文献和假设的提出。第 3 节介绍所采用的方法。第 4 节介绍并分析研究结果,第 5 节解释其影响。第 6 节得出本研究的结论。


2.假设的提出和概念框架

2.1. Passenger Expectation


乘客期望来自于乘客之前使用其他产品或服务提供商的经验,这种经验会影响乘客对任何公司未来提供产品或服务能力的期望[29,30]。Fornell [29]认为,乘客期望与感知绩效、服务质量、感知价值和客户满意度直接呈正相关。奥利弗[31,32]基于期望-不确认模型框架支持这一论点,认为期望是感知质量、感知价值和用户满意度最重要的前因之一。

交通领域的大量研究都指出,乘客期望是影响乘客满意度的重要因素。Shen 等人[22]对城市轨道交通进行了调查,发现乘客期望会影响感知质量、感知价值和乘客满意度。Zhang 等人[33]对中国公共交通服务的另一项研究也显示了类似的关系趋势,他们的研究结果与 Shen 等人[22]的研究结果相吻合。Hussain 等人[34]报告说,乘客期望对感知质量有相当大的积极影响,尽管研究人员在对阿拉伯联合酋长国(UAE)航空服务的调查中未能证明乘客期望对感知价值有任何显著影响。这一结果与对中国苏州公共交通的调查结果一致[35]。根据文献综述,乘客期望可能会影响感知质量、感知价值和乘客满意度。因此,在此基础上提出了以下假设:

假设 1 (H1)。乘客对轻轨服务的期望对感知质量有积极影响。

假设 2 (H2)。乘客对轻轨服务的期望对感知价值有积极影响。

假设 3 (H3)。乘客对轻轨服务的期望对轻轨乘客的满意度有积极影响。

 2.2.感知质量


迄今为止,对服务质量理论和实践的探索日益受到不同领域从业人员和研究人员的关注。服务质量被定义为客户对服务提供商表现的总体评价[36]。此外,Lai 和 Chen [23]提出,服务质量是所提供服务满足消费者需求的程度。在许多文献中,服务质量被认为是顾客满意度的重要预测指标[37-40]。服务质量高,顾客的感知质量就高。感知质量或感知服务质量是指消费者对实体所提供服务的感知,包括对服务优越性的充分认识[41],一些研究报告指出,感知质量是影响顾客(或乘客)满意度的关键因素,包括在运输领域。

Mouwen[40]在一项关于铁路公共交通的研究中发现,旅行速度和准时性是对用户满意度影响最大的服务质量之一。Lai 和 Chen[23]发现,高雄捷运(KMRT)提供的服务质量是影响乘客感知价值、满意度和参与度的重要统计因素。此外,Shen 等人[22] 报道,感知质量对苏州轨道交通服务的感知价值和乘客满意度有显著的正向直接影响。关于土耳其地铁[42]和高铁[24]服务质量的两项研究发现,这两个服务提供商提供的服务质量与用户满意度成正比。其他关于公共交通的研究[43-48]也报告了与上述研究一致的结果。总之,感知质量可能会影响感知价值和用户满意度。因此,在全面回顾文献的基础上,我们提出了以下假设:

假设 4 (H4)。感知质量对感知价值有积极影响。

假设 5 (H5)。感知质量对轻轨乘客的满意度有积极影响。

 2.3.认知价值


感知价值源于公平理论,涉及客户和服务提供商的投入或成果比率[49]。博尔顿和德鲁[50]认为,公平理论的基本概念是顾客认为正确、公平或应该的产品的感知价值。具体来说,它是顾客(或乘客)根据他们对供应商(或服务提供商)提供的产品(或服务)的感知做出的判断[51]。Lai 和 Chen[23]认为,感知价值取决于顾客的感知成本和感知收益。Yang 和 Peterson[52]将感知价值分为货币投资和非货币投资。在货币投资中,消费者使用纸币支付所提供产品(或服务质量)的费用。然而,非货币投资与压力体验、时间和精力消耗等因素有关。

一些交通研究报告指出,感知价值对乘客满意度有积极影响。Shen 等人[22] 在中国进行的一项调查显示,苏州轨道交通系统的感知价值与乘客满意度之间存在直接的正相关关系。Irtema [53]使用结构方程模型(SEM)分析了吉隆坡 412 名公共交通用户的反馈意见,结果发现


乘客的满意度与公共交通的感知价值之间存在显著的统计学相关性。对台湾高明捷运的案例研究表明,感知价值与乘客满意度之间存在明显的相关性[23]。同样,在印度尼西亚雅加达,Sumaedi 等人[54]报告说,准公共交通乘客的感知价值对其满意度有直接和积极的影响。这一发现与公共交通实证研究的结果一致[55-58]。总之,感知价值对乘客满意度有显著影响。因此,如果用户对公共交通的优势和好处表现出高度认可,他们就更有可能对所提供的服务更加满意,从而更愿意在未来使用该服务并向他人推荐该服务。通过全面的文献综述,我们提出了以下假设:

假设 6 (H6)。感知价值对轻轨乘客的满意度有积极影响。

2.4. Conceptual Framework


根据文献综述和本研究提出的假设,将乘客期望(PE)、感知质量
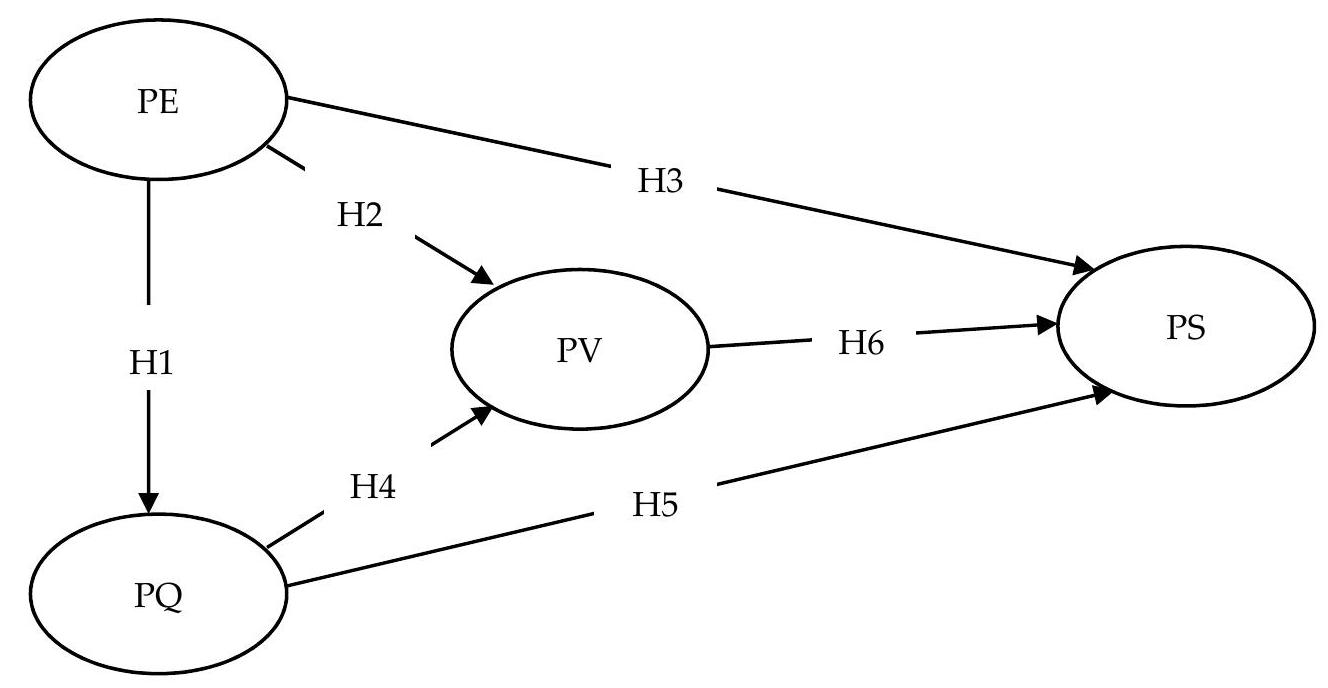
 ( P Q ) ( P Q ) (PQ)(\mathrm{PQ})(PQ) 、感知价值(PV)和满意度(PS)联系起来的概念框架如图 1 所示。、感知价值(PV)和满意度(PS)的概念框架如图 1 所示。因此,本研究将全面探讨这些因素(PE、PQ 和 PV)对马来西亚吉隆坡轻轨乘客满意度的影响及其相互关系。

图 1.研究模式的概念框架。

3. Methodology


本文以吉隆坡的轻轨(LRT)系统为例进行研究。图 2 显示了由三条线路组成的轻轨系统:安邦线跨度 18 k m 18 k m 18km18 \mathrm{~km}18 km ,设有 18 个站点;斯里八打灵线跨度 45.1 k m 45.1 k m 45.1km45.1 \mathrm{~km}45.1 km 长,设有 29 个站点;吉拉那再也线跨度 46.4 k m 46.4 k m 46.4km46.4 \mathrm{~km}46.4 km ,设有 37 个站点[59]。表 1 显示了本研究采用的工具。研究工具采用了先前的研究,并进行了修改,还被反译成了马来语。在最终数据收集之前,问卷在雪兰莪州 Bandar Baru Bangi 随机抽取了 50 名受访者进行试点测试。试点测试可评估所设计工具的任何不足之处,并帮助研究人员在实际调查之前改进问卷[3]。根据试点测试受访者的反馈,问卷中省略了几个问题,因为受访者没有回答或回答错误。对其他问题进行了修改,以提高清晰度和可靠性。表 1 显示了试点研究的信度分析结果。本研究最终用于数据收集的问卷包括两个主要部分:(i) 第 1 部分:受访者人口特征;(ii) 第 2 部分:轻轨乘客满意度评价、


如附录 A 所示。用于测量第 2 部分问题的五点李克特量表范围从
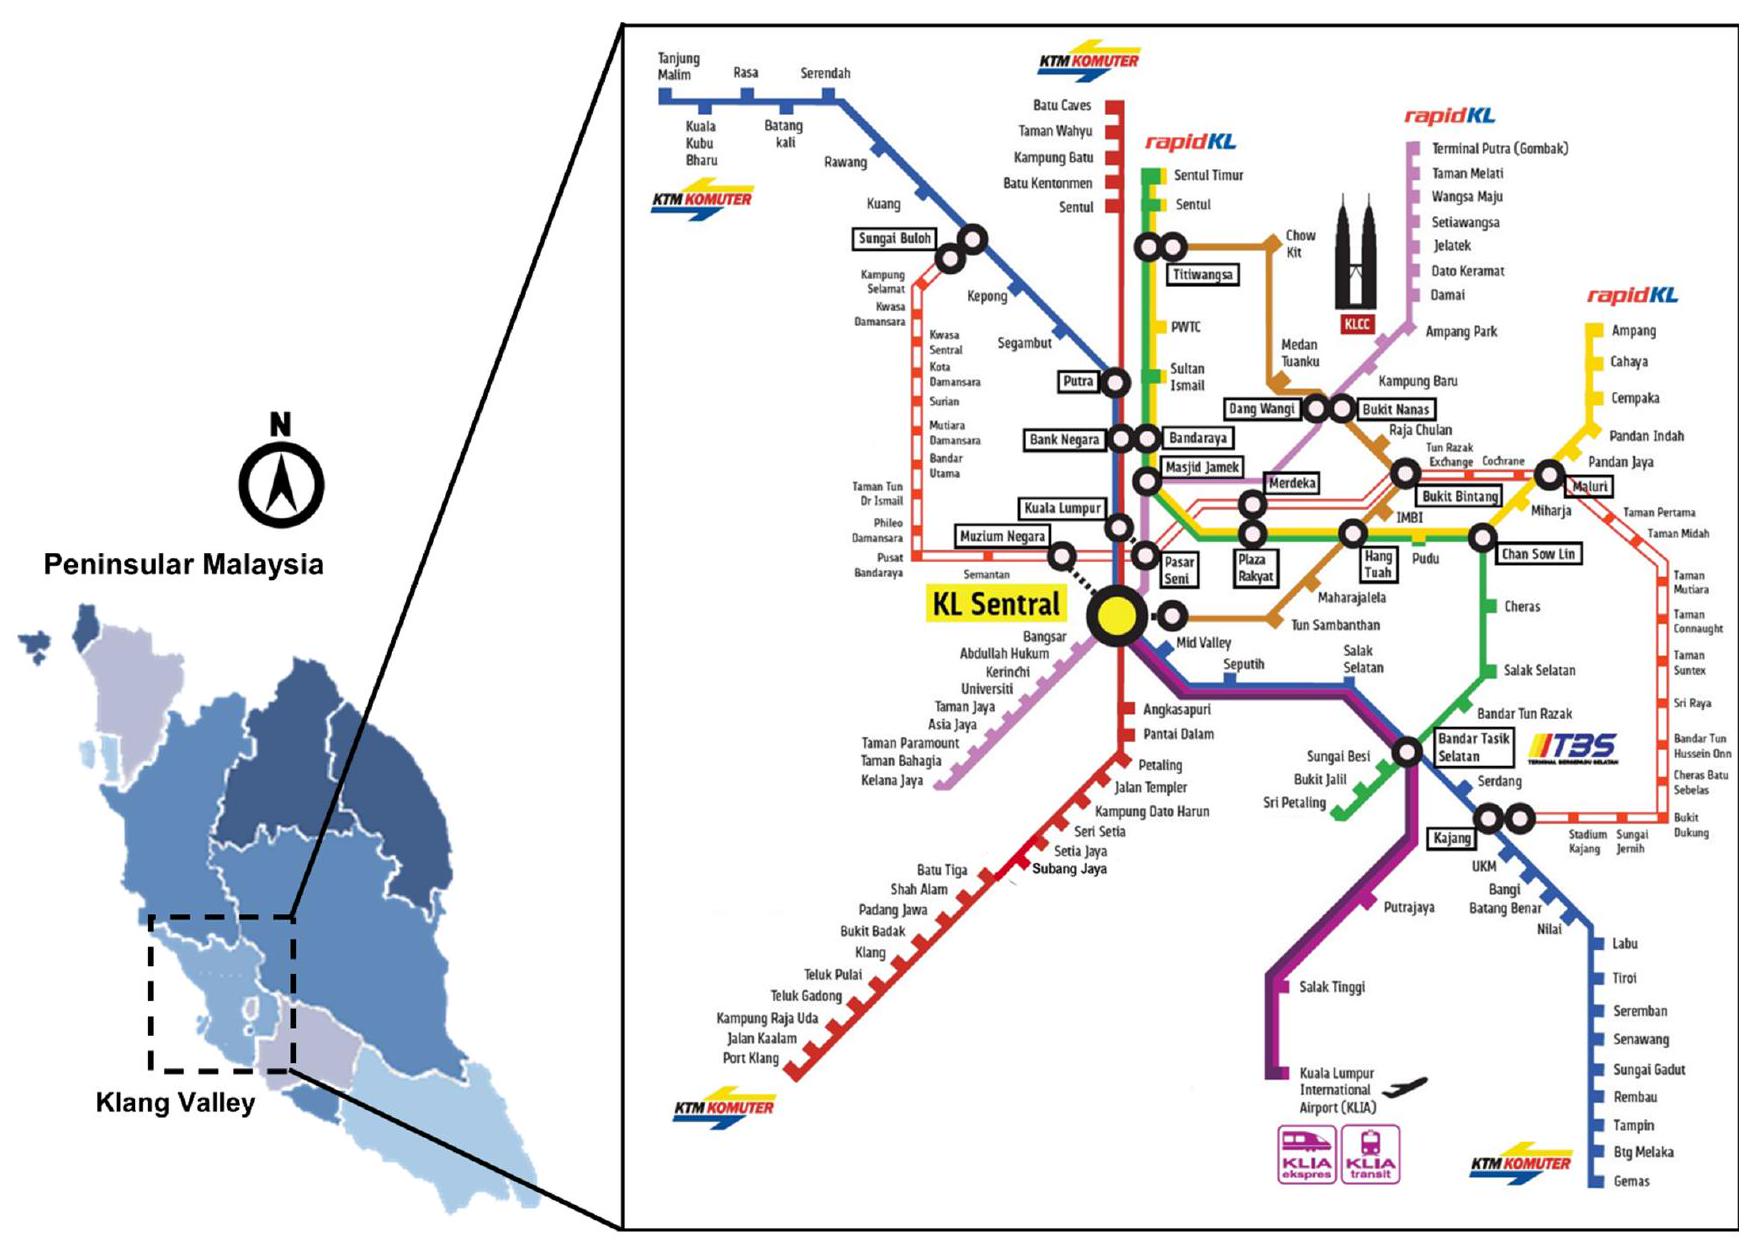
 1 = 1 = 1=1=1= 非常不同意到 5 = 5 = 5=5=5= 非常不同意。非常不同意到 {{1}非常同意。高分表示对某项措施的兴趣较高。
Figure 2. The Ampang line (yellow), Sri Petaling line (light green), and Kelana Jaya line (pink) of the rail transit network in Kuala Lumpur.

表 1.工具的结构项目和可靠性分析。
Construct  通过自  项目数量 Cronbach Alpha ( α ) ( α ) (alpha)(\boldsymbol{\alpha})(α)
Passenger Expectation [ 22 ] [ 22 ] [22][22][22] 3 0.871
 质量感知 [ 22 , 53 ] [ 22 , 53 ] [22,53][22,53][22,53] 8 0.883
 认知价值 [ 22 , 53 ] [ 22 , 53 ] [22,53][22,53][22,53] 5 0.905
Passenger Satisfaction [ 22 , 53 ] [ 22 , 53 ] [22,53][22,53][22,53] 4 0.870
Construct Adopted From: Number of Items Cronbach Alpha (alpha) Passenger Expectation [22] 3 0.871 Perceived Quality [22,53] 8 0.883 Perceived Value [22,53] 5 0.905 Passenger Satisfaction [22,53] 4 0.870| Construct | Adopted From: | Number of Items | Cronbach Alpha $(\boldsymbol{\alpha})$ | | :---: | :---: | :---: | :---: | | Passenger Expectation | $[22]$ | 3 | 0.871 | | Perceived Quality | $[22,53]$ | 8 | 0.883 | | Perceived Value | $[22,53]$ | 5 | 0.905 | | Passenger Satisfaction | $[22,53]$ | 4 | 0.870 |

本研究以便利抽样为基础,在乘客人数最多的两个主要车站,即吉隆坡中央车站和Terminal Bersepadu Selatan车站(TBS)进行了横断面问卷调查。在进行调查之前,调查员先听取了关于调查目的的简单介绍,并询问潜在受访者是否愿意参与调查。调查问卷只发放给那些愿意参与调查的人,以确保他们对问卷中的所有项目做出准确可靠的回答。这种方法可以提高调查的回复率[60]。访谈是面对面进行的,在 10-15 分钟的调查结束后,受访者会得到一份小礼物以示感谢。在 2019 年 9 月 20 日至 2019 年 12 月 10 日期间,共发放了 500 份自填问卷。83 个问题


由于答复无效或/和不完整,问卷被剔除,417 份问卷被考虑作进一步分析,有效答复率为 83.40 % 83.40 % 83.40%83.40 \%83.40% 。.数据使用 IBM SPSS 统计软件 24.0 版和 IBM SPSS 矩结构分析软件(Amos)24.0 版进行分析。本研究将受访者的人口统计特征以及测量和结构模型作为数据分析系统程序的一部分。

 4.成果

4.1. Respondents' Demographic Characteristics


表 2 列出了 417 位受访者的人口统计学特征。在所有受访者中, 50.8 % 50.8 % 50.8%50.8 \%50.8% 为男性, 49.2 % 49.2 % 49.2%49.2 \%49.2% 为女性。大多数受访者(近 44 % 44 % 44%44 \%44% 年龄段为 21 30 21 30 21-3021-302130 。-岁年龄组, 37.4 % 37.4 % 37.4%37.4 \%37.4% 31 40 31 40 31-4031-403140 岁年龄组,{{6} 为{{7} 岁年龄组。-岁年龄组, 9.1 % 9.1 % 9.1%9.1 \%9.1% 不到 20 岁, 8.6 % 8.6 % 8.6%8.6 \%8.6% 属于 41 50 41 50 41-5041-504150 年龄组。-岁年龄组, 1.2 % 1.2 % 1.2%1.2 \%1.2% 超过 50 岁。超过一半的受访者 ( 74.6 % ) ( 74.6 % ) (74.6%)(74.6 \%)(74.6%) 拥有大学学位。超过一半的受访者 ( 55.9 % ( 55.9 % (55.9%(55.9 \%(55.9% 是全职雇员, 32.4 % 32.4 % 32.4%32.4 \%32.4% 是学生, 5.8 % 5.8 % 5.8%5.8 \%5.8% 是失业者, 5.5 % 5.5 % 5.5%5.5 \%5.5% 从事兼职工作, 0.5 % 0.5 % 0.5%0.5 \%0.5% 属于其他类别。在收入方面, 29.3 % 29.3 % 29.3%29.3 \%29.3% 位受访者的月收入低于 2000 马币,只有 1.0 % 1.0 % 1.0%1.0 \%1.0% 位受访者的月收入超过 8000 马币, 18.7 % 18.7 % 18.7%18.7 \%18.7% 位受访者选择不填写月收入。问卷还询问受访者是否持有驾驶执照,其家庭是否拥有汽车。大多数受访者( 85.4 % 85.4 % 85.4%85.4 \%85.4% )持有驾驶执照, 14.6 % 14.6 % 14.6%14.6 \%14.6% 没有驾驶执照。此外, 27.8 % 27.8 % 27.8%27.8 \%27.8% 的受访者没有汽车,其余 72.2 % 72.2 % 72.2%72.2 \%72.2% 的受访者中, 33.6 % 33.6 % 33.6%33.6 \%33.6% 拥有一辆汽车, 23.3 % 23.3 % 23.3%23.3 \%23.3% 拥有两辆汽车, 15.3 % 15.3 % 15.3%15.3 \%15.3% 拥有三辆或更多汽车。

表 2.受访者概况 ( n = 417 ) ( n = 417 ) (n=417)(n=417)(n=417) ..
n n n\mathbf{n}n o o o\mathbf{o}o n n n\mathbf{n}n % % %\mathbf{\%}%
Gender Income Range
Male 212 50.8 Less than 2000 122 29.3
Female 205 49.2 2001 4000 2001 4000 2001-40002001-400020014000 72 17.3
 年龄(岁) - - 4001 6000 4001 6000 4001-60004001-600040016000 121 29.0
Less than 20 38 9.1 6001 8000 6001 8000 6001-80006001-800060018000 20 4.8
21 30 21 30 21-3021-302130 182 43.6 More than 8000 4 1.0
31 40 31 40 31-4031-403140 156 37.4 Private 78 18.7
41-50 36 8.6
驾驶执照所有权
- -
 50 岁及以上 5 1.2 Yes 356 85.4
Education - - No 61 14.6
Primary School 5 1.2 Car Ownership - -
Secondary School 30 7.2 0 116 27.8
College 68 16.3 1 140 33.6
University Degree 311 74.6 2 97 23.3
 其他 3 0.7 More than 3 64 15.3
 职业 - - - - -
Full-Time Employee 233 55.9 Note: MYR 1 1 1~~1 \approx1 USD 0.23 - -
Part-Timer Employee 23 5.5 - - -
Unemployed 24 5.8 - - -
Student 135 32.4 - - -
 其他 2 0.5 -
n o n % Gender Income Range Male 212 50.8 Less than 2000 122 29.3 Female 205 49.2 2001-4000 72 17.3 Age (Years) - - 4001-6000 121 29.0 Less than 20 38 9.1 6001-8000 20 4.8 21-30 182 43.6 More than 8000 4 1.0 31-40 156 37.4 Private 78 18.7 41-50 36 8.6 Driving License Ownership - - 50 and above 5 1.2 Yes 356 85.4 Education - - No 61 14.6 Primary School 5 1.2 Car Ownership - - Secondary School 30 7.2 0 116 27.8 College 68 16.3 1 140 33.6 University Degree 311 74.6 2 97 23.3 Other 3 0.7 More than 3 64 15.3 Occupation - - - - - Full-Time Employee 233 55.9 Note: MYR 1~~ USD 0.23 - - Part-Timer Employee 23 5.5 - - - Unemployed 24 5.8 - - - Student 135 32.4 - - - Other 2 0.5 - | | $\mathbf{n}$ | $\mathbf{o}$ | $\mathbf{n}$ | $\mathbf{\%}$ | | | :---: | :---: | :---: | :---: | :---: | :---: | | Gender | Income Range | | | | | | Male | 212 | 50.8 | Less than 2000 | 122 | 29.3 | | Female | 205 | 49.2 | $2001-4000$ | 72 | 17.3 | | Age (Years) | - | - | $4001-6000$ | 121 | 29.0 | | Less than 20 | 38 | 9.1 | $6001-8000$ | 20 | 4.8 | | $21-30$ | 182 | 43.6 | More than 8000 | 4 | 1.0 | | $31-40$ | 156 | 37.4 | Private | 78 | 18.7 | | 41-50 | 36 | 8.6 | Driving License Ownership | - | - | | 50 and above | 5 | 1.2 | Yes | 356 | 85.4 | | Education | - | - | No | 61 | 14.6 | | Primary School | 5 | 1.2 | Car Ownership | - | - | | Secondary School | 30 | 7.2 | 0 | 116 | 27.8 | | College | 68 | 16.3 | 1 | 140 | 33.6 | | University Degree | 311 | 74.6 | 2 | 97 | 23.3 | | Other | 3 | 0.7 | More than 3 | 64 | 15.3 | | Occupation | - | - | - | - | - | | Full-Time Employee | 233 | 55.9 | Note: MYR $1 \approx$ USD 0.23 | - | - | | Part-Timer Employee | 23 | 5.5 | - | - | - | | Unemployed | 24 | 5.8 | - | - | - | | Student | 135 | 32.4 | - | - | - | | Other | 2 | 0.5 | - | | | | | | | | | |


4.2.测量模型的评估


表 3 列出了本研究测量模型的拟合指数。所有拟合指数值--即气方与自由度之比( x 2 / d f ) x 2 / d f ) x2//df)\mathrm{x} 2 / \mathrm{df})x2/df) )、比较拟合指数(CFI)、规范拟合指数(NFI)、拟合优度指数(GFI)、调整拟合优度指数(GFI、比较拟合指数(CFI)、规范拟合指数(NFI)、拟合优度指数(GFI)、调整拟合优度指数(AGFI)和近似均方根误差(RMSEA)--均符合交通领域前人研究推荐的截断标准。测量模型的拟合指数结果表明,该模型与实证结果相符。


数据。随后,测量模型通过三种方法进行了验证:一致性信度、收敛效度和判别效度。

表 3.测量模型拟合指数汇总。
 拟合指数 Result  截止标准 Status  参考资料
X / d f / d f //df/ \mathrm{df}/df 2.54 < 3.00 < 3.00 < 3.00<3.00<3.00 Acceptable
CFI 0.96 > 0.90 > 0.90 > 0.90>0.90>0.90 Acceptable
NFI 0.94 > 0.90 > 0.90 > 0.90>0.90>0.90 Acceptable [ 3 , 12 , 24 , 35 ] [ 3 , 12 , 24 , 35 ] [3,12,24,35][3,12,24,35][3,12,24,35]
GFI 0.95 > 0.90 > 0.90 > 0.90>0.90>0.90 Acceptable
AGFI 0.94 > 0.90 > 0.90 > 0.90>0.90>0.90 Acceptable
RMSEA 0.07 < 0.10 < 0.10 < 0.10<0.10<0.10 Acceptable
Fit Indices Result Cut off Criterion Status Reference X //df 2.54 < 3.00 Acceptable CFI 0.96 > 0.90 Acceptable NFI 0.94 > 0.90 Acceptable [3,12,24,35] GFI 0.95 > 0.90 Acceptable AGFI 0.94 > 0.90 Acceptable RMSEA 0.07 < 0.10 Acceptable | Fit Indices | Result | Cut off Criterion | Status | Reference | | :---: | :---: | :---: | :---: | :---: | | X $/ \mathrm{df}$ | 2.54 | $<3.00$ | Acceptable | | | CFI | 0.96 | $>0.90$ | Acceptable | | | NFI | 0.94 | $>0.90$ | Acceptable | $[3,12,24,35]$ | | GFI | 0.95 | $>0.90$ | Acceptable | | | AGFI | 0.94 | $>0.90$ | Acceptable | | | RMSEA | 0.07 | $<0.10$ | Acceptable | |

注: χ 2 / d f χ 2 / d f chi2//df\chi 2 / d fχ2/df ,卡方与自由度之比;CFI,比较拟合指数;NFI,规范拟合指数;GFI,拟合优度指数;AGFI,调整后的拟合优度。CFI,比较拟合指数;NFI,规范拟合指数;GFI,拟合优度指数;AGFI,调整后拟合优度指数;RMSEA,均方根近似误差。


4.2.1.结构可靠性


Ibrahim 等人[3]指出,构念信度衡量的是数据测量工具对每个构念系数的内部一致性。计算 Cronbach's alpha 和综合信度是为了确定构念的信度。根据 Hair 等人[61]的观点,Cronbach's α 和综合信度大于 0.70 即为满意。从表 4 中可以看出,Cronbachα 和综合信度值分别介于 0.863 0.916 0.863 0.916 0.863-0.9160.863-0.9160.8630.916 0.900 0.947 0.900 0.947 0.900-0.9470.900-0.9470.9000.947 之间。之间,这表明这些构念是可靠的。

表 4.构建信度、收敛效度和判别效度的结果。
Construct Item Loading (Range) Cronbach Alpha ( α α alpha\alphaα ) Composite Reliability AVE Factor Correlation
PE PQ PV PS
PE 0.874 0.963 0.874 0.963 0.874-0.9630.874-0.9630.8740.963 0.916 0.947 0.857 0.93 - - -
PQ 0.693 0.880 0.693 0.880 0.693-0.8800.693-0.8800.6930.880 0.866 0.928 0.517 0.71 0.72 - -
PV 0.654 0.914 0.654 0.914 0.654-0.9140.654-0.9140.6540.914 0.887 0.900 0.647 0.68 0.58 0.80 -
PS 0.781 0.883 0.781 0.883 0.781-0.8830.781-0.8830.7810.883 0.863 0.907 0.709 0.70 0.64 0.61 0.84
Construct Item Loading (Range) Cronbach Alpha ( alpha ) Composite Reliability AVE Factor Correlation PE PQ PV PS PE 0.874-0.963 0.916 0.947 0.857 0.93 - - - PQ 0.693-0.880 0.866 0.928 0.517 0.71 0.72 - - PV 0.654-0.914 0.887 0.900 0.647 0.68 0.58 0.80 - PS 0.781-0.883 0.863 0.907 0.709 0.70 0.64 0.61 0.84| Construct | Item Loading (Range) | Cronbach Alpha ( $\alpha$ ) | Composite Reliability | AVE | Factor Correlation | | | | | :---: | :---: | :---: | :---: | :---: | :---: | :---: | :---: | :---: | | | | | | | PE | PQ | PV | PS | | PE | $0.874-0.963$ | 0.916 | 0.947 | 0.857 | 0.93 | - | - | - | | PQ | $0.693-0.880$ | 0.866 | 0.928 | 0.517 | 0.71 | 0.72 | - | - | | PV | $0.654-0.914$ | 0.887 | 0.900 | 0.647 | 0.68 | 0.58 | 0.80 | - | | PS | $0.781-0.883$ | 0.863 | 0.907 | 0.709 | 0.70 | 0.64 | 0.61 | 0.84 |

注: p < 0.05 p < 0.05 p < 0.05p<0.05p<0.05 ;AVE,提取的平均方差;PE,乘客期望值;PQ,感知质量;PV,感知价值;PS,乘客满意度。

4.2.2. Convergent Validity


根据 Hair 等人的研究[61],收敛效度的定义是一个测量指标与同一构念的其他测量指标呈正相关的程度。收敛效度的评估基于两个标准:(i) 标准化因子载荷(或项目载荷)应大于 0.50 且显著[61];(ii) 所有构念的平均方差提取(AVE)必须至少达到 0.50 [62]。从表 4 中可以看出,所有项目的标准化因子载荷均大于 0.50 的临界值,其中最小项目载荷为 0.654,因此具有显著性。此外,所有的 AVE 值在 0.517 和 0.857 之间,均大于 Fornell 和 Larcker 推荐的 0.50 临界值[62]。因此,由于所有构念都符合上述标准,收敛效度被证明是良好的。

4.2.3. Discriminant Validity


海尔等人[61]给出的判别效度定义是,根据经验标准,一个构念与其他构念真正不同的程度。这种有效性是通过比较每个构念的 AVE 值与这些构念之间以及与所有其他构念之间的相关平方来衡量的[35]。表 4 中的结果显示,所有构念的 AVE 值都高于相关平方值,符合 Fornell 和 Larcker 提出的要求[62]。因此,本研究的判别效度是可以接受的。


4.3.结构模型评估


在确认测量模型的有效性和可靠性后,使用基于协方差的结构方程模型(CB-SEM)对建议的假设进行了评估。结果表明,探究吉隆坡轻轨服务乘客满意度决定因素的模型拟合良好,所有拟合优度指数 ( χ 2 / d f = 2.63 , C F I = 0.95 , N F I = 0.93 , G F I = 0.95 , A G F I = 0.93 , R M S E A = 0.07 ) χ 2 / d f = 2.63 , C F I = 0.95 , N F I = 0.93 , G F I = 0.95 , A G F I = 0.93 , R M S E A = 0.07 (chi^(2)//df=2.63,CFI=0.95,NFI=0.93,GFI=0.95,AGFI=0.93,RMSEA=0.07)\left(\chi^{2} / \mathrm{df}=2.63, \mathrm{CFI}=0.95, \mathrm{NFI}=0.93, \mathrm{GFI}=0.95, \mathrm{AGFI}=0.93, \mathrm{RMSEA}=0.07\right)(χ2/df=2.63,CFI=0.95,NFI=0.93,GFI=0.95,AGFI=0.93,RMSEA=0.07) 值均满足拟合标准要求。图 3 展示了模型的整体结构、标准化估计值以及各构面之间关系的显著性。结构方程模型(见图 3)解释了感知质量方差的 28 % 28 % 28%28 \%28% 、感知价值方差的 61 % 61 % 61%61 \%61% 和乘客满意度方差的 76 % 76 % 76%76 \%76%
Figure 3. Structural equation model.

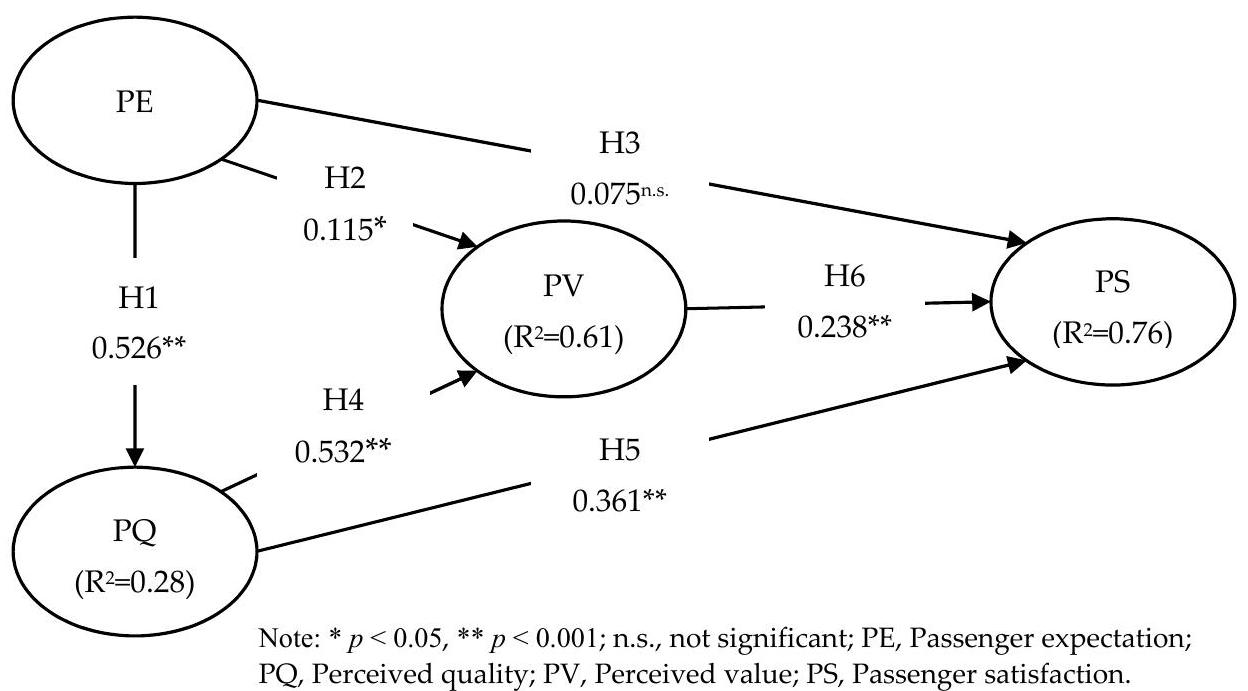
假设 1 至 3 表明,乘客期望对感知质量、感知价值和乘客满意度有积极影响。图 3 所示的标准化回归系数表明,乘客期望对感知质量 ( β = 0.526 , p < 0.001 ) ( β = 0.526 , p < 0.001 ) (beta=0.526,p < 0.001)(\beta=0.526, p<0.001)(β=0.526,p<0.001) 和感知价值 ( β = 0.115 ( β = 0.115 (beta=0.115(\beta=0.115(β=0.115 有显著的正向直接影响,而对乘客满意度 ( β = 0.075 , p > 0.05 ) ( β = 0.075 , p > 0.05 ) (beta=0.075,p > 0.05)(\beta=0.075, p>0.05)(β=0.075,p>0.05) 没有显著影响。 p < 0.05 ) p < 0.05 ) p < 0.05)p<0.05)p<0.05) ,而对乘客满意度 ( β = 0.075 , p > 0.05 ) ( β = 0.075 , p > 0.05 ) (beta=0.075,p > 0.05)(\beta=0.075, p>0.05)(β=0.075,p>0.05)的影响不明显。.因此,假设 1 和 2 得到支持,而假设 3 未得到支持。假设 4 和 5 表明,感知质量与感知价值之间以及感知质量与乘客满意度之间存在正相关关系。结果表明,感知质量对感知价值 ( β = 0.532 , p < 0.001 ) ( β = 0.532 , p < 0.001 ) (beta=0.532,p < 0.001)(\beta=0.532, p<0.001)(β=0.532,p<0.001) 和乘客满意度 ( β = 0.361 , p < 0.001 ) ( β = 0.361 , p < 0.001 ) (beta=0.361,p < 0.001)(\beta=0.361, p<0.001)(β=0.361,p<0.001) 有显著的正向影响。.这些结果证实了假设 4 和 5。假设 6 指出,感知价值对乘客满意度有积极影响,结果显示这两个构念之间存在显著的正相关关系 ( β = 0.238 , p < 0.001 ) ( β = 0.238 , p < 0.001 ) (beta=0.238,p < 0.001)(\beta=0.238, p<0.001)(β=0.238,p<0.001) 。.因此,接受假设 6。假设检验模型摘要见表 5。

表 5.假设检验模型摘要。
 假设 Relationship  假设
H1 Passenger expectation    质量感知 0.526 0.526 0.526^(****)0.526^{* *}0.526  支持
H2 Passenger expectation    认知价值 0.115 0.115 0.115^(**)0.115^{*}0.115  支持
H3 Passenger expectation   Passenger satisfaction 0.075 n.s. 0.075 n.s.  0.075^("n.s. ")0.075^{\text {n.s. }}0.075n.s.   不支持
H4  质量感知    认知价值 0.532 0.532 0.532^(****)0.532^{* *}0.532  支持
H5  质量感知   Passenger satisfaction 0.361 0.361 0.361^(****)0.361^{* *}0.361  支持
H6  认知价值   Passenger satisfaction 0.238 0.238 0.238^(****)0.238^{* *}0.238  支持
Hypothesis Relationship Hypothesis H1 Passenger expectation with Perceived quality 0.526^(****) Supported H2 Passenger expectation with Perceived value 0.115^(**) Supported H3 Passenger expectation with Passenger satisfaction 0.075^("n.s. ") Not supported H4 Perceived quality with Perceived value 0.532^(****) Supported H5 Perceived quality with Passenger satisfaction 0.361^(****) Supported H6 Perceived value with Passenger satisfaction 0.238^(****) Supported| Hypothesis | | Relationship | | Hypothesis | | | :---: | :---: | :---: | :---: | :---: | :---: | | H1 | Passenger expectation | with | Perceived quality | $0.526^{* *}$ | Supported | | H2 | Passenger expectation | with | Perceived value | $0.115^{*}$ | Supported | | H3 | Passenger expectation | with | Passenger satisfaction | $0.075^{\text {n.s. }}$ | Not supported | | H4 | Perceived quality | with | Perceived value | $0.532^{* *}$ | Supported | | H5 | Perceived quality | with | Passenger satisfaction | $0.361^{* *}$ | Supported | | H6 | Perceived value | with | Passenger satisfaction | $0.238^{* *}$ | Supported |

注:H,假设; β β beta\betaβ ,标准化回归系数;{{1} n,不显著。标准化回归系数;{{1} n.s.,不显著。


5.结果讨论


5.1.理论意义


马来西亚吉隆坡是南亚地区的 "阿尔法城市",本研究旨在通过研究乘客对吉隆坡轻轨服务的期望、感知质量和感知价值的作用,探讨轻轨服务中乘客满意度的决定因素。通过对马来西亚吉隆坡城市轨道交通进行客户满意度调查获得的一组数据,采用结构方程模型方法对模型的相互关系进行了检验。本研究的概念框架得到了评估和验证,这从理论上有助于理解影响乘客对城市轨道交通满意度的因素。鉴于轨道交通是马来西亚政府的战略之一,旨在减少对私人机动交通的依赖,并在 2030 年将公共交通模式的比例提高到 40 % 40 % 40%40 \%40% ,因此探讨影响乘客对城市轨道交通满意度的因素至关重要,尤其是在马来西亚的背景下[63]。具体而言,未来城市地区的轨道交通将成为城市公共交通网络的骨干。

根据这项研究,乘客期望、感知质量和感知价值这三个因素会对乘客满意度产生直接或间接的影响。本研究的结果与交通领域的早期研究结果一致。本研究发现,乘客期望对感知质量、感知价值和乘客对轻轨服务的满意度有直接和显著的影响。换句话说,乘客期望不仅直接影响乘客的满意度,还通过感知质量和感知价值间接影响乘客的满意度。这一结果与 Shen 等人[22]和 Zhang 等人[33]的研究结果一致。研究结果还证实了以往各种研究中报告的感知质量对感知价值和乘客满意度的积极影响 [ 23 , 43 48 ] [ 23 , 43 48 ] [23,43-48][23,43-48][23,4348] 。.与以往研究提供的证据类似,本研究使用的结构方程模型也证明了感知价值对轻轨服务满意度的显著正向影响[53-58]。因此,乘客期望、感知质量和感知价值可被视为吉隆坡轻轨乘客满意度的前因。

在影响吉隆坡轻轨乘客满意度的三个因素中,发现感知质量是乘客满意度的最强决定因素。这一结果与近期公共交通领域的研究结果一致[22,23,38,53]。很明显,使用城市轨道交通服务(此处指轻轨)的乘客,如果所获得的服务超出了他们的预期,他们的满意度会更高。换句话说,高质量的服务会提高乘客对轻轨服务的满意度。根据 Ibrahim 等人的研究[13],准点率、每天的车次、票价或通票类型、列车和车站的清洁度和舒适度、列车和车站的安全性、客户服务等是服务质量的主要要素,这些要素已被证明会影响乘客对服务质量的感知以及乘客对铁路公共交通的满意度。这项研究还发现,如果乘客认为乘坐轻轨出行物有所值,那么他们对轻轨服务的满意度会更高。在本研究中,价值由感知成本(货币)和感知收益(非货币)组成[52]。旅行成本低、旅行时间短、旅途舒适,这些都是一般公共交通,特别是城市轨道交通的感知价值指标。鉴于这些因素对乘客满意度有直接影响,因此在努力提高乘客对轻轨服务的满意度时必须认真考虑这些因素。

在东南亚地区,特别是在马来西亚,为制定更好的战略以提高乘客满意度并增加轨道交通服务的乘客数量,对影响用户满意度的因素进行了解的努力在交通领域的文献中仍然有限。Das 等人[45] 评估了乘客对轨道交通服务的满意度。


通过重要绩效分析 (IPA),以马来西亚吉隆坡的单轨铁路服务为重点,调查了乘客对轻轨交通的满意度。Phoong 等人最近的一项研究[64]通过因子分析和相关分析方法调查了吉隆坡轻轨乘客最满意的服务质量要素。因此,本研究有助于丰富现有的知识体系以及与东南亚地区(特别是马来西亚)轻轨乘客满意度相关的文献。本研究对乘客期望、感知质量和感知价值等多个要素的考虑增强了对满意度这种复杂感觉的预测能力。这是本研究另一个值得注意的理论贡献。


5.2.对管理的影响


从管理的角度来看,本研究的结果对轻轨服务提供商努力提高乘客对所提供服务的满意度,以及制定有效战略留住现有乘客并吸引潜在乘客具有重要意义。这些研究结果将使轻轨服务在吉隆坡这样的城市交通市场中保持竞争力。这与以往研究的结论一致,即对所提供服务满意的乘客会更加忠诚于该服务,并向他人宣传该服务 [ 17 , 18 , 65 ] [ 17 , 18 , 65 ] [17,18,65][17,18,65][17,18,65] 。.

根据上述结果,影响乘客对吉隆坡轻轨服务满意度的最关键因素是感知质量。因此,轻轨服务提供商应投入更多资源,更加重视实际政策,以便能够提供符合乘客期望的高质量服务,进而使乘客在使用服务后感到满意。有鉴于此,轻轨服务提供商应提供高质量的服务,例如确保列车上和车站内有良好的设施,提供足够数量的自动售货机、候车座位、适当和足够的扶手或握带供站立的乘客使用、轻轨站和列车上的安全环境、合理的票价、广泛的网络覆盖、准时和高频率的服务、车站内有足够的停车空间以及列车上和车站内的便利性。此外,提供往返轻轨站的快速、准时、经济的接驳巴士服务可提高乘客的满意度,这反过来又有助于增加乘客量。这与 Jain 等人[66]和 Chandra 等人[67]的观点一致,即第一英里和最后一英里的交通连接设施(接驳巴士)对增加乘客量有重大影响。

为提高列车和车站的清洁度和舒适度,可以采取一系列政策,包括在特定地点提供足够数量的垃圾桶,禁止在列车上饮食,在车站开展回收活动,提供回收桶并张贴回收活动海报。此外,车站和列车内的安全保障水平也是影响乘客满意度的重要因素 [ 13 , 59 ] [ 13 , 59 ] [13,59][13,59][13,59] 。.因此,可以采取多项措施来提高轻轨服务的安全和安保水平,包括安装闭路电视(CCTV)以监控乘客的行动和任何可疑行为,鼓励公众向安保人员报告可疑活动,以及在月台和车站配备足够数量的安保人员。其他提高乘客满意度的措施还包括为老年人提供特别帮助,以及为女性乘客提供专用客车。

根据本研究的结果,轻轨服务提供商应努力通过提升感知价值来提高乘客对服务的满意度。这与以往类似研究[53-58]的结果一致,即感知价值与乘客满意度之间存在直接的正相关关系。为提高感知价值,可采取多项措施,包括与巴士等竞争者相比,收取合理的服务费、


出租车和电子叫车服务。有鉴于此,建议轻轨服务提供商推出多种类型的乘车证,如日票、周票和月票,并为老年人、学生、儿童和残疾人等特定乘客群体提供不同的票价结构和折扣。此外,非货币成本也不容忽视,如精力、体力和时间。服务提供商必须确保所提供服务的可感知效益和生态友好性必须优于其他类型的公共交通、非正规公共交通(如电子医疗服务(如 Grab 和 MyCar))和私人交通。在这种情况下,提供高质量的服务,如准时、安全、清洁、无障碍和便捷的轻轨服务,可能会提高感知效益,从而部分提升轻轨服务的感知价值。

总之,提供符合乘客期望的服务质量和服务价值将使乘客对马来西亚吉隆坡的轻轨服务感到满意。上文讨论的措施和政策是提高乘客对该服务满意度的方法之一,从而有助于留住现有乘客并吸引潜在乘客使用该服务。本研究的结果为轻轨服务提供商提供了制定战略和进行投资的依据,以增加乘客量,从而与马来西亚政府将轨道交通作为吉隆坡未来交通网络骨干和增加城市地区公共交通模式份额的议程保持一致[63]。

 6.结论


本研究证明了乘客期望、感知质量和感知价值对乘客对轻轨(LRT)服务满意度的影响。据笔者所知,这是首次在东南亚地区一个阿尔法城市的轨道交通(尤其是轻轨)中评估这些决定因素(乘客期望、感知质量和感知价值)之间关系的研究。总之,本研究的结果表明,乘客期望、感知质量和感知价值对提高轻轨乘客的满意度有相当大的影响。这些发现有助于在理论和管理两方面进行改进。在理论方面,本研究通过评估拟议模型中四个构念之间的复杂关系,有助于增强与影响乘客对轻轨服务满意度的因素有关的基础知识。因此,本研究的结果为交通文献提供了重要信息。在管理方面,研究结果表明,构念的权重会影响乘客满意度。这对于帮助服务提供商、当局、政策制定者、规划者和研究人员制定有效的战略以提高轨道交通的使用率至关重要,特别是在吉隆坡以及其他阿尔法城市和大都市。

作者贡献:构思,A.N.H.I.和 M.N.B.;方法,A.N.H.I、软件,A.N.H.I.和 M.R.M.Y.;验证,A.N.H.I.和 S.Y.;形式分析,A.N.H.I.和 M.R.M.Y.;数据整理,A.N.H.I.和 S.Y.。数据整理,A.N.H.I.和 M.N.B.;写作-原稿准备,A.N.H.I.和 M.R.M.Y.;写作-审阅和编辑,A.N.H.I.、M.N.B. 和 S.Y.;监督,M.N.B. 和 R.A.R.;项目管理,M.N.B.;资金获取,M.N.B. 所有作者已阅读并同意手稿的出版版本。

资助:本研究由马来西亚国民大学(UKM)通过项目 GUP-2019-015 赞助。

机构审查委员会声明:由于本研究不涉及人体生物实验和患者数据,因此免于伦理审查和批准。

知情同意声明:所有参与研究的受试者均已获得知情同意。

数据可用性声明:所有相关数据均在论文中提供。

致谢:第一作者感谢 Yayasan Canselor UKM 2019 年 Skim Zamalah Yayasan Canselor 博士奖学金。此外,作者还要感谢匿名审稿人提出的有益建议和意见。

利益冲突:作者声明无利益冲突。

Appendix A

Construct/Item Abrv. Standardised Loading
Passenger Expectation PE -

使用服务前对轻轨服务的总体期望
PE1 0.939

对轻轨服务能够达到的程度的期望

使用服务前的乘客要求
Expectation of the degree to which the LRT service is able to fulfil passenger requirement prior to using the service| Expectation of the degree to which the LRT service is able to fulfil | | :--- | | passenger requirement prior to using the service |
PE2 0.963

使用服务前对服务可靠性的预期
PE3 0.874
 质量感知 PQ -

乘客对车站标识的满意度
PQ1 0.713

乘客对舒适度的满意度
PQ2 0.695

乘客对服务速度的满意度
PQ3 0.773

乘客对安全水平的满意度
PQ4 0.745

乘客对票务服务的满意度
PQ5 0.880

乘客对所提供设施的满意度
PQ6 0.836

乘客对客户服务的满意度
PQ7 0.723

乘客对提供信息的满意度
PQ8 0.693
 认知价值 PV -

根据当前票价评估服务
PV1 0.876

根据现有服务水平评估票价
PV2 0.870

使用轻轨服务的费用低廉
PV3 0.654

我使用轻轨服务的时间非常合理
PV4 0.669

对我使用轻轨的总体评价

服务 "物超所值"
The overall assessment for my experience of using the LRT service is "excellent value"| The overall assessment for my experience of using the LRT | | :--- | | service is "excellent value" |
PV5 0.914
Passengers Satisfaction PS -

对轻轨服务质量的总体满意度
PS1 0.827

我对所提供服务的看法超出了我的
 预料之中
My perception towards the service provided is beyond my expectation| My perception towards the service provided is beyond my | | :--- | | expectation |
PS2 0.781

我对所提供服务的全面性的看法

出乎意料
My perception of the comprehensiveness of the services provided is beyond my expectation| My perception of the comprehensiveness of the services provided | | :--- | | is beyond my expectation |
PS3 0.873

我认为使用轻轨服务让我受益匪浅
PS4 0.883
Construct/Item Abrv. Standardised Loading Passenger Expectation PE - Overall expectation of the LRT service prior to using the service PE1 0.939 "Expectation of the degree to which the LRT service is able to fulfil passenger requirement prior to using the service" PE2 0.963 Expectation of the reliability of the service prior to using it PE3 0.874 Perceived Quality PQ - Passenger satisfaction with the signage at the station PQ1 0.713 Passenger satisfaction with the comfort level PQ2 0.695 Passenger satisfaction with the speed of the service PQ3 0.773 Passenger satisfaction with the safety level PQ4 0.745 Passenger satisfaction with the ticketing service PQ5 0.880 Passenger satisfaction with the provided facilities PQ6 0.836 Passenger satisfaction with the customer service PQ7 0.723 Passenger satisfaction with the provision of information PQ8 0.693 Perceived Value PV - Evaluation of service based on current ticket price PV1 0.876 Evaluation of ticket price based on the current level of service PV2 0.870 The cost for using the LRT service is cheap PV3 0.654 The time I spent using the LRT service is very reasonable PV4 0.669 "The overall assessment for my experience of using the LRT service is "excellent value"" PV5 0.914 Passengers Satisfaction PS - Overall satisfaction with the quality of LRT service PS1 0.827 "My perception towards the service provided is beyond my expectation" PS2 0.781 "My perception of the comprehensiveness of the services provided is beyond my expectation" PS3 0.873 I think I have benefited from using the LRT service PS4 0.883| Construct/Item | Abrv. | Standardised Loading | | :---: | :---: | :---: | | Passenger Expectation | PE | - | | Overall expectation of the LRT service prior to using the service | PE1 | 0.939 | | Expectation of the degree to which the LRT service is able to fulfil <br> passenger requirement prior to using the service | PE2 | 0.963 | | Expectation of the reliability of the service prior to using it | PE3 | 0.874 | | Perceived Quality | PQ | - | | Passenger satisfaction with the signage at the station | PQ1 | 0.713 | | Passenger satisfaction with the comfort level | PQ2 | 0.695 | | Passenger satisfaction with the speed of the service | PQ3 | 0.773 | | Passenger satisfaction with the safety level | PQ4 | 0.745 | | Passenger satisfaction with the ticketing service | PQ5 | 0.880 | | Passenger satisfaction with the provided facilities | PQ6 | 0.836 | | Passenger satisfaction with the customer service | PQ7 | 0.723 | | Passenger satisfaction with the provision of information | PQ8 | 0.693 | | Perceived Value | PV | - | | Evaluation of service based on current ticket price | PV1 | 0.876 | | Evaluation of ticket price based on the current level of service | PV2 | 0.870 | | The cost for using the LRT service is cheap | PV3 | 0.654 | | The time I spent using the LRT service is very reasonable | PV4 | 0.669 | | The overall assessment for my experience of using the LRT <br> service is "excellent value" | PV5 | 0.914 | | Passengers Satisfaction | PS | - | | Overall satisfaction with the quality of LRT service | PS1 | 0.827 | | My perception towards the service provided is beyond my <br> expectation | PS2 | 0.781 | | My perception of the comprehensiveness of the services provided <br> is beyond my expectation | PS3 | 0.873 | | I think I have benefited from using the LRT service | PS4 | 0.883 |

 参考资料


  1. Borhan, M.N.; Ibrahim, A.N.H.; Syamsunur, D.; Rahmat, R.A. Why Public Bus is a Less Attractive Mode of Transport:马来西亚普特拉贾亚案例研究》。时期。Polytech.Transp.Eng. 2017, 47, 82-90.[CrossRef](交叉参考文献

  2. Kwan, S.C.; Sutan, R.; Hashim, J.H. Trip characteristics as the determinants of intention to shift to rail transport among private motor vehicle users in Kuala Lumpur, Malaysia.Sustain. Cities Soc.Cities Soc. 2018, 36, 319-326.[CrossRef](交叉参考文献

  3. Ibrahim, A.N.H.; Borhan, M.N.; Rahmat, R.A.O. Understanding Users' Intention to Use Park-and-Ride Facilities in Malaysia:信任作为计划行为理论中的新结构的作用》。可持续发展 2020》,12, 2484。[CrossRef](交叉参考文献

  4. Borhan, M.N.; Akhir, N.M.; Ismail, A.; Rahmat, R.A.A.O. Modeling Between Service Quality, Environmental Impression, Attitude and Intention to Use Park-and-Ride.J. Kejuruter.2015, 27, 63-70.[CrossRef](交叉参考文献

  5. Khreis, H.; Warsow, K.M.; Verlinghieri, E.; Guzman, A.; Pellecuer, L.; Ferreira, A.; Jones, I.; Heinen, E.; Rojas-Rueda, D.; Mueller, N.; et al. The health impacts of traffic-related exposures in urban areas:了解实际影响、潜在驱动力和共同创造未来方向。J. Transp.Health 2016, 3, 249-267.[CrossRef].

  6. Lachapelle, U.; Frank, L.; Saelens, B.; Sallis, J.F.; Conway, T.L. 《公共交通通勤与身体活动》:居住地、工作地和到达方式。J. Phys.Health 2011, 8, S72-S82.[CrossRef] (参考文献

  7. Ibrahim, R.; Clayden, A.; Cameron, R. 马来西亚吉隆坡的热带城市公园:挑战公园管理团队的态度,采用更具环境可持续性的方法。Urban For.Urban Green.2020, 49, 126605.[CrossRef].

  8. Noor, N.M.; Rosni, N.A.; Hashim, M.; Abdullah, A. Developing land use geospatial indices (LUGI) for sprawl measurement in alpha cities:马来西亚吉隆坡案例研究。Cities 2018, 82, 127-140.[CrossRef].

  9. Maruthaveeran, S.; Bosh, C.K.V.D. Fear of crime in urban parks-What the residents of Kuala Lumpur have to say?Urban For.Urban Green.2015, 14, 702-713.[CrossRef](交叉参考文献

  10. 马来西亚巴生谷私人交通与公共交通的模式选择》。Sci. World J. 2014, 2014, 1-14.[CrossRef].

  11. Mohamad, J.; Kiggundu, A.T. The Rise of the Private Car in Kuala Lumpur, Malaysia.IATSS Res. 2007, 31, 69-77.[CrossRef]

  12. Borhan, M.N.; Ibrahim, A.N.H.; Miskeen, M.A.A. Extending the theory of planned behaviour to predict the intention to take the new high-speed rail for intercity travel in Libya:评估寻求新奇感、信任和外部影响的影响。Transp.Part A Policy Pract.2019, 130, 373-384.[CrossRef].

  13. Ibrahim,A.N.H.;Borhan,M.N.;Md Yusoff,N.I.;Ismail,A. Rail-based Public Transport Service Quality and User Satisfaction-A Literature Review.2020,32,423-435。[CrossRef]
  14. Ibrahim, A.N.H.; Borhan, M.N. Sex Disparity in Satisfaction and Loyalty towards Urban Rail Transit: A Survey of Light Rail Transit (LRT) Passengers in Kuala Lumpur, Malaysia. Int. J. Integr. Eng. 2021, 13, 223-228. [CrossRef]

  15. Masirin, M.I.M.; Salin, A.M.; Zainorabidin, A.; Martin, D.; Samsuddin, N. Review on Malaysian Rail Transit Operation and Management System:问题与整合解决方案。IOP Conf.Series Mater.Sci. Eng. 2017, 226, 012029.[CrossRef].

  16. Zulkifli, S.N.A.M.; Hamsa, A.A.K.; Noor, N.M.; Ibrahim, M. Evaluation of land use density, diversity and ridership of Rail Based Public Transportation System.Transp.Res. Procedia 2017, 25, 5266-5281.[CrossRef].
  17. Ibrahim, A.N.H.; Borhan, M.N.; Zakaria, N.A.; Zainal, S.K. Effectiveness of Commuter Rail Service toward Passenger's Satisfaction: A Case Study from Kuala Lumpur, Malaysia. Int. J. Eng. Technol. 2019, 8, 50-55. [CrossRef]

  18. Van Lierop, D.; Badami, M.G.; El-Geneidy, A.M. What influences satisfaction and loyalty in public transport?文献综述。Transp.Rev. 2018, 38, 52-72.[CrossRef].

  19. Spickermann, A.; Grienitz, V.; Von Der Gracht, H.A.; Abbas, R.; Michael, K.; Michael, M.; Redman, L.; Friman, M.; Gärling, T.; Hartig, T. 吸引汽车用户的公共交通质量属性:研究综述。Transp.Policy 2013, 25, 119-127.[CrossRef]
  20. Belwal, R. Public transportation in Oman: A strategic analysis. Adv. Transp. Stud. 2017, 42, 99-116. [CrossRef]

  21. Chowdhury, S.; Ceder, A. (Avi) 用户乘坐综合公共交通服务的意愿:文献综述。Transp.Policy 2016, 48, 183-195.[交叉参考文献]

  22. Shen, W.; Xiao, W.; Wang, X. 城市轨道交通乘客满意度评价模型:基于偏最小二乘法的结构方程模型。Transp.Policy 2016, 46, 20-31.[交叉参考文献]

  23. Lai, W.-T.; Chen, C.-F.公共交通乘客的行为意向--服务质量、感知价值、满意度和参与度的作用。Transp.Policy 2011, 18, 318-325.[交叉参考文献]

  24. Yilmaz, V.; Ari, E. 土耳其高速铁路服务中服务质量、形象和客户满意度对客户投诉和忠诚度的影响:结构方程模型建议。Transp.A Transp.2016, 13, 67-90.[CrossRef](交叉参考文献

  25. De Oña,J.;de Oña,R.;Eboli,L.;Mazzulla,G. 公交服务中的感知服务质量:结构方程法。Transp.政策》,2013 年,29 期,219-226 页。[交叉参考文献]

  26. Lei, P.-W.; Wu, Q. Introduction to Structural Equation Modeling:Issues and Practical Considerations.Educ.Issues Pract.2007, 26, 33-43.[CrossRef].

  27. Williams, L.J.; Vandenberg, R.J.; Edwards, J.R. 12 Structural Equation Modeling in Management Research:A Guide for Improved Analysis.Acad.Manag.Ann.2009, 3, 543-604.[CrossRef](交叉参考文献

  28. Astrachan, C.B.; Patel, V.K.; Wanzenried, G. A comparative study of CB-SEM and PLS-SEM for theory development in family firm research.J. Fam.Bus.Strat.2014, 5, 116-128.[CrossRef].

  29. Fornell, C.; Johnson, M.D.; Anderson, E.W.; Bryant, B.E. The American Customer Satisfaction Index:性质、目的和结果》。J. Mark.1996, 60, 7-18.[CrossRef]

  30. Johnson, M.D.; Gustafsson, A.; Andreassen, T.W.; Lervik, L.; Cha, J. The evolution and future of national customer satisfaction index models.J. Econ.Psychol.2001, 22, 217-245.[CrossRef]

  31. Oliver, R.L. A Cognitive Model of the Antecedents and Consequences of Satisfaction Decisions.J. Mark.1980,17,460-469。[CrossRef](交叉参考文献

  32. Oliver, R.L. Satisfaction:A Behavioral Perspective on the Consumer, 2nd ed.; McGraw Hill:美国纽约州纽约市,2010 年。

  33. 基于 PLS-SEM 模型的乘客满意度指数评估:来自中国公共交通服务的证据.Transp.Part A Policy Pr. 2019, 120, 149-164.[CrossRef].

  34. Hussain, R.; Al Nasser, A.; Hussain, Y.K. 一家阿联酋航空公司的服务质量和客户满意度:实证调查。J. Air Transp.Manag.2015, 42, 167-175.[CrossRef]

  35. Fu, X.-M.; Zhang, J.-H.; Chan, F.T. 公共交通忠诚度的决定因素:满意-忠诚理论与期望-确认理论的整合模型。Transp.2018, 113, 476-490.[CrossRef].

  36. Lien,C.-H.;Wu,J.-J.;Chen,Y.-H.;Wang,C.-J.. 信任转移与服务质量对医疗行业信任的影响。Manag.服务。Qual.Int.J. 2014, 24, 399-416.[CrossRef](交叉参考文献

  37. Parasuraman, A.; Zeithaml, V.A.; Berry, L.L. A Conceptual Model of Service Quality and Its Implications for Future Research.J. Mark.1985, 49, 41.[CrossRef]

  38. Jiang, H.; Zhang, Y. An investigation of service quality, customer satisfaction and loyalty in China's airline market.J. Air Transp.Manag.2016, 57, 80-88.[CrossRef].

  39. Hu, H.-H.; Kandampully, J.; Juwaheer, T.D. 服务质量、感知价值、客户满意度和形象的关系及影响:实证研究。Serv.J. 2009, 29, 111-1.J. 2009, 29, 111-125.[交叉参考文献]

  40. Mouwen, A. Drivers of customer satisfaction with public transport services.Transp.2015, 78, 1-20.[CrossRef] (交叉参考文献

  41. Marakanon, L.; Panjakajornsak, V. 影响客户对环保电子产品忠诚度的感知质量、感知风险和客户信任。Kasetsart J. Soc. Sci. 2017, 38, 24-30.[CrossRef].
  42. Yanık, S.; Aktas, E.; Topcu, I. Traveler satisfaction in rapid rail systems: The case of Istanbul metro. Int. J. Sustain. Transp. 2017, 11, 642-658. [CrossRef]

  43. Weinstein, A. Customer Satisfaction Among Transit Riders:顾客如何评定各种服务属性的相对重要性。Transp.Res.Rec.J. Transp.Board 2000, 1735, 123-132.[CrossRef]

  44. Tyrinopoulos, Y.; Antoniou, C. Public transit user satisfaction:Variability and policy implications.Transp.Policy 2008, 15, 260-272.[CrossRef]

  45. Das, A.M.; Ladin, M.A.; Ismail, A.; Rahmat, R.O.K. 吉隆坡公共交通单轨用户的消费者满意度。J. Eng.Sci. Technol.2013, 8, 272-283.

  46. De Oña, J.; de Oña, R.; Eboli, L.; Mazzulla, G. Heterogeneity in Perceptions of Service Quality among Groups of Railway Passengers.Int. J. Sustain.Int. J. Sustain.2014,9,612-626。[CrossRef] [参考文献
  47. Eboli, L.; Fu, Y.; Mazzulla, G. Multilevel Comprehensive Evaluation of the Railway Service Quality. Procedia Eng. 2016, 137, 21-30. [CrossRef]

  48. Paramita, P.; Zheng, Z.; Haque, M.; Washington, S.; Hyland, P. 用户对火车票价的满意度:澳大利亚五个城市的比较分析。PLoS ONE 2018, 13, e0199449.[CrossRef].
  49. Oliver, R.L.; Desarbo, W.S. Response Determinants in Satisfaction Judgments. J. Consum. Res. 1988, 14, 495-507. [CrossRef]

  50. Bolton, R.; Drew, J.H. A Longitudinal Analysis of the Impact of Service Changes on Customer Attitudes.J. Mark.1991, 55, 1. [CrossRef].

  51. Zeithaml, V.A. Consumer Perceptions of Price, Quality, and Value:平均值模型与证据综述》。J. Mark.1988, 52, 2-22.[交叉参考文献]

  52. Yang, Z.; Peterson, R.T. Customer perceived value, satisfaction, and loyalty:转换成本的作用。Psychol.Mark.2004, 21, 799-822.[CrossRef](交叉参考文献

  53. Irtema,H.I.M.;Ismail,A.;Borhan,M.N.;Das,A.M.;Alshetwi,A.B. 吉隆坡公共交通乘客行为意向案例研究。Case Stud.Transp.Policy 2018, 6, 462-474.[CrossRef].

  54. Sumaedi, S.; Mahatma, I.G.; Bakti, Y.; Yarmen, M. 公共交通乘客行为意向的实证研究:服务质量、感知牺牲、感知价值和满意度的作用(案例研究:印度尼西亚 Ja-karta 的准公共交通乘客)。Int.Int. J. Traffic Transp.2012, 2, 83-97.
  55. Widianti, T.; Sumaedi, S.; Bakti, I.G.M.Y.; Rakhmawati, T.; Astrini, N.J.; Yarmen, M. Factors influencing the behavioral intention of public transport passengers. Int. J. Qual. Reliab. Manag. 2015, 32, 666-692. [CrossRef]

  56. Kim, S.A. Study on the Service Model of the Public Libraries for Dyslexics.J. Korean Libr.Inf.Sci. Soc. 2009, 40, 183-206.[CrossRef]

  57. Pratiwi, P.U.D.; Landra, N.; Kusuma, G.A.T. The Construction of Public Transport Service Model to Influence the Loyalty of Customer.Sci.J. 2018, vi, 56-63.

  58. Cheng, Y.-H.; Tseng, W.-C.探索感知价值、免费换乘和惩罚对地铁公交联运用户换乘意向的影响。Transp.Policy 2016, 47, 127-138.[CrossRef](交叉参考文献

  59. Ibrahim, A.; Borhan, M.; Yusoff, N.M.; Ismail, A.; Yazid, M.M.; Yunin, N.M.; Sotaro, Y. Gender and Age Do Matter:探索马来西亚吉隆坡乘客性别和年龄对轻轨服务质量感知的影响》。Sustainability 2021, 13, 990.[CrossRef].

  60. Borhan, M.N.; Ibrahim, A.N.H.; Aziz, A.; Yazid, M.R.M. The relationship between the demographic, personal, and social factors of Malaysian motorcyclists and risk taking behavior at signalized intersections.Accid.Anal.Prev.2018, 121, 94-100.[CrossRef].
  61. Hair, J.F.; Black, W.C.; Babin, B.J.; Anderson, R.E. Multivariate Data Analysis; Prentice Hall: Ithaca, NY, USA, 2010; ISBN 9781292021904.
  62. Fornell, C.; Larcker, D.F. Evaluating Structural Equation Models with Unobservable Variables and Measurement Error. J. Mark. Res. 1981, 18, 39-50. [CrossRef]

  63. Kwan, S.C.; Tainio, M.; Woodcock, J.; Sutan, R.; Hashim, J.H. The carbon savings and health co-benefits from the introduction of mass rapid transit system in Greater Kuala Lumpur, Malaysia.J. Transp.Health 2017, 6, 187-200.[CrossRef].
  64. Phoong, S.Y.; Moghavvemi, S.; Phoong, K.H. User Perception on Urban Light Rail Transit. Civ. Eng. Arch. 2019, 7, 43-49. [CrossRef]
  65. Joewono, T.B.; Kubota, H. Paratransit Service in Indonesia: User Satisfaction and Future Choice. Transp. Plan. Technol. 2008, 31, 325-345. [CrossRef]

  66. Jain, S.; Aggarwal, P.; Kumar, P.; Singhal, S.; Sharma, P. Identifying public preferences using multi-criteria decision making for assessing the shift of urban commuters from private to public transport:德里案例研究。Transp.Res. Part F Traffic Psychol.Behav.2014, 24, 60-70.[CrossRef](交叉参考文献

  67. Chandra, S.; Bari, M.E.; Devarasetty, P.C.; Vadali, S. Accessibility evaluations of feeder transit services.Transp.2013, 52, 47-63. [CrossRef].[CrossRef].