


Applied Energy 应用能源
第 228 卷,2018 年 10 月 15 日,第 1147-1158 页

Mathematical modelling and sensitivity analysis of solar photovoltaic panel integrated with phase change material
集成相变材料的太阳能光伏板的数学建模和敏感性分析
Highlights 亮点
- •Enhanced conductivity method is adopted to incorporate PCM convective effect into 1-D thermal resistance model.
采用增强传导法将 PCM 对流效应纳入一维热阻模型。 - •An improved thermal resistance model, offering a good compromise between accuracy and simplicity, is developed.
我们开发了一种改进的热阻模型,在准确性和简便性之间取得了良好的平衡。 - •Neglecting PCM convective effect or radiative heat transfer in numerical simulation may result in significant errors.
在数值模拟中忽略 PCM 对流效应或辐射传热可能会导致重大误差。 - •A sensitivity analysis suggests that the optimal PCM melting temperature is about 5 °C higher than ambient.
灵敏度分析表明,最佳 PCM 熔化温度比环境温度高约 5 °C。
Abstract 摘要
据报道,光伏(PV)温度每升高一度,发电量就会减少 0.4-0.65%。相变材料(PCM)可以吸收大量的热量而不会使自身温度升高,本研究采用这种材料来控制光伏组件的温度并增加发电量。这种集成系统就是所谓的 PV-PCM 系统。近年来,在利用 PCM 进行光伏面板热调节方面已经开展了一些数值和实验工作,但仍有一些问题尚未解决或不明确,例如模拟案例数量有限、PCM 对流效应建模困难、数值模拟中一些常见假设的影响和不确定性。为了研究这些问题,通过应用增强传导法开发了一种改进的热阻模型,将 PCM 对流效应纳入一维模型,在精确性和简便性之间实现了良好的折中。数值模拟结果表明,忽略 PCM 对流和辐射传热将导致重大误差。最后,基于 300 多个案例的模拟,双变量分析表明,太阳辐射每增加 100 W/m 2 可导致峰值温度增加约 5 °C,当 PCM 的熔化温度略高于环境温度(如 5 °C)时,可实现最佳性能。
Keywords 关键词
太阳能光伏 (PV)相变材料 (PCM)PV-PCM热调节热阻模型增强传导法
Nomenclature 术语
- density (kg/m3)
密度(千克/米 3 ) - dynamic viscosity of phase change material (N s/m2)
相变材料的动态粘度(N s/m 2 ) - specific heat (J/(kg K)) 比热(焦耳/(千克 K)
- gravity acceleration (m/s2)
重力加速度(米/秒 2 ) - time interval (s) 时间间隔(秒)
- area of PV panel (m2)
光伏板面积 (m 2 ) - solar radiation on PV panel (W/m2)
光伏板上的太阳辐射 (W/m 2 ) - actual efficiency of PV panel (%)
光伏板的实际效率 (%) - emissivity of PV surface 光伏表面的发射率
- view factor of PV surface
光伏表面视角系数 - the Stefan–Boltzmann constant
斯特凡-波兹曼常数 - surface temperature of PV-PCM system (°C)
PV-PCM 系统的表面温度(°C) - sky temperature (°C) 天空温度(°C)
- natural heat convection coefficient (W/(m2 K))
自然热对流系数(W/(m 2 K) - forced heat convection coefficient (W/(m2 K))
强制热对流系数(W/(m 2 K) - emissivity of aluminum 铝的发射率
- back surface temperature of PV-PCM system (°C)
PV-PCM 系统的背面温度(°C) - ground temperature (°C) 地面温度(°C)
- net solar radiation input (W)
净太阳辐射输入(瓦) - total heat input (W) 总输入热量(瓦)
- radiative heat loss to sky (W)
天空辐射热损失(瓦) - ambient temperature (°C) 环境温度(°C)
- radiative heat loss to ground (W)
地面辐射热损失(瓦) - thermal conductivity (W/(m K))
导热系数(瓦/(米 K) - height of PV panel (m)
光伏板高度(米) - Raleigh number 罗利号码
- density of PCM in solid state (kg/m3)
固态 PCM 的密度(千克/米 3 ) - density of PCM in liquid state (kg/m3)
液态 PCM 的密度(千克/米 3 ) - specific heat of PCM in solid state (J/(kg K))
固态 PCM 的比热(焦耳/(千克 K) - specific heat of PCM in liquid state (J/(kg K))
液体状态下 PCM 的比热(焦耳/(千克 K) - liquidus temperature of phase change material (°C)
相变材料的液相温度(°C) - solidus temperature of phase change material (°C)
相变材料的固相温度(°C) - energy absorbed by phase change material (J/kg)
相变材料吸收的能量(焦耳/千克) - energy required to rise to the solidus temperature of phase change material (J/kg)
相变材料上升到固相温度所需的能量(焦耳/千克) - latent heat capacity of phase change material (J/kg)
相变材料的潜热容量(焦耳/千克) - output power of PV panel (W)
光伏电池板的输出功率(瓦) - reference efficiency of PV panel
光伏板的参考效率 - coefficient between PV temperature and efficiency
光伏温度与效率之间的系数 - thermal conductivity of PCM layer (W/(m K))
PCM 层的导热系数(瓦/(米 K)
1. Introduction 1.导言
如今,光伏(PV)电池板所利用的太阳能被认为是应对世界能源危机和全球变暖最有前途的能源之一[1]。为了用相同数量的太阳能产生更多的电能,科学家们不断追求更高的光伏转换效率[2]。然而,决定光伏转换效率的不仅是光伏板本身的特性,周围环境也会对其产生影响 [3]。虽然在实验室条件下,光电转换效率可达 30% 以上 [4],但在实际条件下,只有约 5-20% 的太阳能可以转化为电能 [5]。各种环境因素,如太阳辐射强度和光伏表面的积尘,都会影响效率。此外,光伏温度过高会对光伏转换效率产生-0.4%/°C 至-0.65%/°C 的负面影响[6],学术界对此已有大量报道,例如[7]、[8]。在沙漠地区,由于光伏温度可升至 80 °C,甚至高于 100 °C,光伏发电量显著减少 [9]。
在这种情况下,研究人员采用了各种热管理技术来缓解和控制光伏表面温度[10],例如自然/强制空气冷却[11]、水冷却[12]和热管[13]。一般来说,这些冷却技术可分为两类:主动冷却和被动冷却 [14]。主动冷却系统需要消耗额外的电力驱动冷却水或其他冷却剂来冷却光伏板,与被动冷却系统相比,主动冷却系统能达到更好的冷却效果,但通常成本较高。1978 年,Stultz 等人[15] 提出使用相变材料(PCM)冷却光伏板,因为 PCM 具有潜热能力,可以从光伏板吸收大量热量。从那时起,在 PCM 用于光伏温度调节领域,即所谓的 PV-PCM 系统方面,已经开展了一些研究。Huang 等人早年对 PV-PCM 系统的性能进行了全面研究,例如首次采用二维计算流体动力学(CFD)模型分析了 PV-PCM 系统的微观运行变量[16],即温度、速度场和涡流形成,发现 PCM 的存在可显著提高光伏转换效率[17]。此后,又有更多论文对不同问题进行了研究,如不同类型 PCM 的影响、附着在 PCM 腔上的翅片的影响、PCM 的熔化行为 [18] 以及三维和二维 CFD 模型的比较 [19]。
与此同时,其他学者也进行了更深入的研究,以拓宽 PV-PCM 的研究范围。例如,Hasan 等人[20]在都柏林和维哈里两个气候不同的地点对 PV-PCM 系统进行了技术经济研究。模拟结果表明,在 Vehari 的夏日,纯 PV 系统和 PV-PCM 系统的峰值温度分别为 63 °C 和 42 °C,平均效率可提高约 10%。研究还得出结论,PV-PCM 系统在气候炎热的维哈里是经济可行的,但在气候温和的都柏林则不可行。在阿拉伯联合酋长国进行的一项全年数值研究表明,在极端炎热的气候条件下,PV-PCM 系统可将年发电量提高 5.9%[21]。还有一项研究是关于带有 PCM 的建筑一体化光伏板 (BIPV),其中考察了 PV-PCM 系统的室内热效应,并与纯光伏系统进行了比较,结果表明 PV-PCM 系统不仅能提高光伏效率,还能降低进入室内环境的热通量[22]。此外,一项多地研究表明,在威尼斯、赫尔辛基和阿布扎比,BIPV-PCM 系统成功地将室内制冷负荷降低了 20-30%,同时,发电峰值提高了 5-8%[23]。另一项研究也证明,在韩国,PV-PCM 系统每年可将发电量提高 1-1.5%[24]。相反,Japs 等人的一项实验研究[25]表明,与传统光伏组件相比,德国 7-8 月间的发电量和经济效益改善大多为负值,这主要归因于 PCM 的低导热性。 不过,最近在印度完成的一项关于 BIPV-PCM 系统的实验研究再次证明,与参考 BIPV 系统相比,其效率每天可提高 10%[26]。此外,Smith 等人[27] 提出了一项全球分析。该分析表明,通过选择最佳的 PCM 熔化温度,墨西哥和非洲东部的发电量可提高 6% 以上。在许多地区,如中美洲和南美洲、非洲和南亚,可以提高 5%的发电量,而欧洲可能是不利地区,因为只能提高约 2-5% 的发电量。与 Hasan 的室内研究[22]类似,在美国东田纳西州进行的一项关于带有 PCM 的通风太阳能屋顶的实地研究表明,采用 PV-PCM 屋顶可显著降低制冷负荷[28]。此外,还引入了各种数值建模方法,包括 CFD 模型[29]、热阻模型[30]和有限元模型[31],以模拟 PV-PCM 在各种条件下的性能。
PV-PCM 研究的另一个领域是将 PCM 用于其他类型的光伏系统,如聚光光伏 (CPV) 系统、光伏/热 (PV/T) 系统和光伏-热电 (PV/TE) 系统。由于 CPV 技术可以获得非常高的温度,因此对 CPV-PCM 系统进行了大量研究。据报道,安装了相变材料矩阵的 V 型槽式 CPV 比参考系统多发 55% 的电 [32]。另一项研究表明,具有 45° 倾斜角的 CPV-PCM 系统性能最佳,光伏表面温度分布均匀 [33]。相信在不久的将来,CPV 与 PCM 集成可能会成为 PV-PCM 系统的一个前景广阔的实际应用[34]。此外,一些研究尝试将传统的 PV/T 系统与 PCM 系统相结合 [35]。一项关于 PV/T-PCM 系统的数值研究表明,在太阳辐射较强、环境温度较低的情况下,该系统的发电量可增加 9%,水温可提高 20 °C[36]。Cui 等人[37]对 PV/TE-PCM 系统这一相对新颖的概念进行了研究,认为在现有技术条件下,该系统似乎并不可行,因为 PV 模块的发电量占 98%,而热电模块仅占 2%。此外,还研究了一些新的 PCM 改进方法,如微胶囊 PCM [38]、[39] 和使用猪脂肪作为 PCM 的廉价来源 [40]。
尽管许多学者在这一领域取得了明显进展,但仍有几个问题尚不清楚,这些研究也没有发现。例如,数值研究在数学建模时通常会有一些假设[41],如忽略辐射传热[42]或忽略 PCM 内部的对流传热[43],而这些假设对模拟结果的影响在文献中讨论不多。此外,为了获得最佳系统配置,在数值[44]和实验研究[45]中,通过改变单个设计参数或边界条件,对有限的情况(通常在 2-20 个范围内)进行了比较。这些比较是一个良好的开端,但这种研究无法为实际应用实现真正的最佳 PV-PCM 系统配置。造成这些问题的一个主要原因是数学模型和数值方法的局限性。由于液体 PCM 中实际上存在对流,因此需要对 Navier-Stokes 方程进行数值求解。因此,计算时间变得相当长,几乎不可能在一次研究中进行大量模拟。为了避免这个问题,一些研究人员假设可以放弃对流效应,只考虑传导传热[41]、[43]。然而,这种假设并没有得到充分证明。幸运的是,有关 PCM 传热的研究为其提供了有效的解决方案 [46]。基于缩放理论和增强传导法,可以通过增加传导率来考虑 PCM 中的对流效应 [47]。通过应用这种方法,可以避免纳维-斯托克斯方程的计算。例如,Kahraman 等人的研究就采用了这种方法。 应用增强传导性方法模拟矩形外壳中冰的融化,结果与数值解非常吻合[48],[49]。Costa 等人也使用类似方法模拟了 PCM 储能系统[50]。近年来,一些研究(如参考文献 [51]、[52])应用增强传导性方法有效地模拟了 PCM 的熔化前沿运动。有研究表明,应用这种方法可以大大缩短计算时间 [51]。
因此,在回顾了该领域的前人研究和 PCM 传热的相关研究后,对 PV-PCM 系统进行了全面研究,以克服上述问题。建立了 CFD 模型和一维热阻模型进行数值模拟,并对两种方法的优缺点进行了比较分析。在比较的基础上,通过应用增强传导法开发了改进的一维热阻模型,以突出 PCM 内部发生的对流传热过程。此外,还在 MATLAB 中检查了 PV-PCM 系统建模中的几个常用假设,以研究其影响和不确定性,旨在弥补研究差距,并为未来类似的数值研究提供有意义的见解。最后,模拟了 300 多个具有不同设计参数和边界条件的 PV-PCM 系统案例,并通过双变量分析方法对结果进行了创新性研究,以获得清晰的认识,为 PV-PCM 优化提供参考。
2. System configuration and mathematical models
2.系统配置和数学模型
2.1. System configuration
2.1.系统配置
PV-PCM 系统基本上由两大部分组成,即 PV 面板和 PCM 室。由于晶体硅光伏的广泛应用和较高的温度系数,该系统通常使用晶体硅光伏。文献[10]中记载了几种形状的 PCM 腔体,如矩形腔体、半圆形腔体、三角形腔体和翅片腔体,一般选择矩形腔体。
本研究中的 PV-PCM 系统由一个 PV 模块和一个充满 PCM 的铝制腔体组装而成。图 1(a) 是 PV-PCM 系统的三维图形,图 1(b) 是剖面图。铝室中的鳍片是可选项,在本研究的一维热阻模型中没有应用。表 1 总结了本研究中使用的光伏电池、玻璃盖板、EVA 和腔体的基本属性。本研究采用 RUBITHERM Technologies 公司生产的 RT35 作为 PCM,因为它在市场上可以买到,并且在文献 [14] 和 [25] 中被广泛用于相同的目的。此外,RT35 不可燃、无腐蚀性,可以安全地填充到铝制腔体中。

Fig. 1. (a) Three-dimensional view of PV-PCM system; (b) sectional view of the system configuration.
图 1:(a)PV-PCM 系统的三维图;(b)系统配置的剖面图。
Table 1. The properties of PV module and PCM chamber.
表 1.光伏组件和 PCM 室的特性。
| Property 物业 | Glass 玻璃 | EVA | Silicon cells 硅电池 | Tedlar | Polyester 聚酯纤维 | RT35 (PCM) | Aluminum 铝 |
|---|---|---|---|---|---|---|---|
| Density (kg/m3) 密度(千克/米 3 ) | 2500 | 935 | 2330 | 1500 | 1390 | 800 | 2791 |
| Specific heat (J/(kg K)) 比热(焦耳/(千克 K) | 750 | 2500 | 700 | 1090 | 1172 | 2000 | 871 |
| Thickness (mm) 厚度(毫米) | 3.2 | 5.0 | 0.2 | 0.0375 | 0.25 | 20–50 20-50 | 5 |
| Thermal conductivity (W/(m K)) 导热系数(瓦/(米 K) | 1.04 | 0.29 | 150 | 0.35 | 0.155 | 0.2 | 202.4 |
| Emissivity 发射率 | 0.95 | / | / | / | / | / | 0.095 |
| Solidus temperature (°C) 凝固温度(°C) | / | / | / | / | / | 29 | / |
| Liquidus temperature (°C) 液相温度(°C) | / | / | / | / | / | 36 | / |
| Latent heat capacity (kJ/kg) 潜热容量(千焦/千克) | / | / | / | / | / | 130 | / |
近年来,基于 PCM 的光伏热调节方法引起了学者们的广泛关注,目前世界上也有一些示范项目。然而,推广这项技术的主要问题是经济性问题,考虑到光伏板的初始成本和 PCM 的额外成本,其投资回收期相对较长。不过,如果 PCM 中储存的热能可用于建筑物的相关用途,如空间供暖、通风和热水,那么其经济效益就会得到改善,并显示出广阔的前景[10]。
2.2. Mathematical models 2.2.数学模型
应首先建立 PV-PCM 系统的数学模型,以便对系统性能进行数值研究,这些模型还可用于研究设计参数和边界条件对系统性能的影响。文献中使用了多种建模方法,包括 CFD 模型 [29]、热阻模型 [30] 和有限元模型 [31]。本研究采用了两种数值建模方法,即 CFD 模拟和一维热阻模型。对于典型的 PV-PCM 系统,数学模型一般可分为四个主要部分,即流体模型、传热模型、相变模型和发电模型。
2.2.1. Fluid model 2.2.1.流体模型
根据图 1(b) 中的二维坐标系,动量方程(即纳维-斯托克斯方程)如下所示: (1) (2) 其中 是流体密度(千克/米 3 ); 和 是 x-速度和 y-速度(米/秒); 是重力加速度(kg m/s 2 ); 和 分别是液体 PCM 和固体 PCM 的粘度(N s/m 2 )。密度 也使用了相同的表示方法。
2.2.2. Heat transfer model
2.2.2.传热模型
图 1(b) 描述了典型 PV-PCM 系统中的热传递情况。除发电外,光伏板吸收的太阳能大部分转化为热量,随后传递给 PCM。由于 PV-PCM 系统的面积相对较小,因此假定其周围没有热量损失。系统固体部分(即光伏组件、铝板和固体 PCM)内的热传导可表示为 (3) 其中 为各固体部分的比热(J/(kg K)), 为各部分的导热系数(W/(m K))。
在 PV-PCM 系统的前后表面,与周围环境的热交换以对流和辐射传热为主。能量平衡方程见式 (4)、(5): (4) (5) 其中,吸收率 是封装玻璃、层压材料的吸收和反射特性以及光伏电池材料的吸收特性的函数,在本研究中设为 0.9 [44]; 是光伏组件上的太阳辐射(W/m 3 ); 和 分别是玻璃和铝板的发射率; 、 、 和 分别为前表面、天空、后表面和地面的温度(°C); 为对流换热率(W/(m 2 K)),可进一步定义为自由对流和强制对流,见式(11)和(12)。(11), (12).投射到光伏前表面的净太阳辐射为 (6) 其中 是 PV-PCM 系统的表面积(m 2 )。
由于部分能量通过光伏效应转化为电能,因此净输入热量 受公式 (7) 控制。 (7) 其中 是光伏组件的实际效率。前后表面的辐射传热由式 (8)、(9) 和 (10) 控制。 (8) (9) (10) 其中,与天空和地面的辐射传热分别用 和 表示(W)。天空温度是根据 Biwole 等人的研究[53]估算的,地面温度假定等于环境温度。还考虑了 PV-PCM 系统前后表面的对流热损失。自然对流率 和强制对流率 的估算见式 (11)、(12)[54]。 (11) (12) 其中, 为光伏板高度(m); 为雷利数; 为雷诺数; 为普朗特数。
2.2.3. Phase change model
2.2.3.相变模型
对于 PCM,液态和固态的热扩散方程为 (13)
由于 PCM 同时具有潜热容量和显热容量,相变过程中的温度可分为三个阶段,如公式 (14) 所示。 (14) 其中, 、 和 分别表示 PCM 已吸收的热量、开始相变过程所需的最小热量和 PCM 的潜热容量(J); 、 和 分别表示当前的 PCM 温度、PCM 的固相温度和液相温度(°C)。 和 分别是固体 PCM 和液体 PCM 的比热。
2.2.4. Power generation model
2.2.4.发电模型
光伏电池的发电方程由式 (15) 模拟。 (15) 其中, 表示光伏电池板的能量输出(瓦); 为实际光伏转换效率。
温度上升与光伏效率下降之间的相关性见式 (16)。 (16) 其中,根据制造商提供的信息,参考光伏效率 为 17.1%; 是光伏效率的温度系数(0.5%/°C); 和 分别代表标准测试条件下的实际光伏温度和参考温度(°C)。
3. CFD simulation and 1-D thermal resistance modelling
3.CFD 模拟和一维热阻建模
在研究了上述 PV-PCM 系统的数学模型后,本节讨论了两种数值方法,即 CFD 仿真和一维热阻建模,并分析了它们的优缺点。最后,选择了计算时间更短的改进型一维热阻模型进行进一步研究。以下分析也可为选择建模方法提供参考。
3.1. CFD simulation 3.1.CFD 模拟
我们之前的研究[55]使用 ANSYS Fluent 17.0 建立了 CFD 模型。在该研究中,我们进行了网格独立性测试,并完成了与其他研究的实验和数值结果的比较,结果表明光伏温度曲线的模式与实验结果非常吻合。在 ANSYS 中构建的 PV-PCM 系统网格示例如图 2 所示。为避免网格依赖性程序,进行了网格灵敏度测试,结果如图 3 所示。三次模拟之间的温度差异非常小,这表明在随后的数值模拟中将电池尺寸设置为 1 mm ∗ 1 mm 是合理的。

Fig. 2. A sample mesh of the PV-PCM system.
图 2.PV-PCM 系统的网格示例。

Fig. 3. The grid sensitivity test of the PV-PCM system with different cell sizes.
图 3.不同电池尺寸的 PV-PCM 系统的电网灵敏度测试。
图 4 显示了 CFD 建模的样本结果。可以清楚地观察到系统中液体 PCM 的温度分布和流动过程。此外,通过 CFD 建模还可以轻松进行微观分析,例如每个小网格的温度变化和流体行为。然而,CFD 模拟的计算时间很长,进行一次完整的案例模拟往往需要数天时间。这也是文献中只模拟了 2-20 个不同 PV-PCM 系统案例的主要原因。

Fig. 4. The CFD simulation result of a PV-PCM system.
图 4.PV-PCM 系统的 CFD 模拟结果。
3.2. 1-D thermal resistance modelling
3.2.一维热阻建模
PV-PCM 系统的优化需要对大量案例进行比较,而 CFD 模拟似乎过于复杂,不是此类研究的理想方法。因此,本研究采用了另一种建模方法,即使用有限差分法的热阻模型。一维热阻模型示意图如图 5 所示。如图所示,PV-PCM 系统可分为若干层,每一层都是热阻模型的一个节点,代表某种材料,如玻璃、EVA、PV 电池、Tedlar 等。特别是将 PCM 分成若干层,每个节点的厚度为 1 毫米,以获得更好的 PCM 模拟精度。节点厚度的选择主要是考虑到避免网格依赖问题和研究的便利性。系统的前表面考虑了太阳辐射、辐射传热、自然空气对流和强制空气对流,系统内还包括传导传热。在系统背面,还考虑了辐射传热和与环境的对流传热。然而,研究 PCM 内部的对流传热过程是一项具有挑战性的工作,因为需要考虑动量方程,而热阻模型无法做到这一点。下一节将讨论这一问题的解决方案。

Fig. 5. Schematic diagram of 1-D thermal resistance model.
图 5.一维热阻模型示意图。
3.3. A new model for PCM heat transfer rate
3.3.PCM 传热率的新模型
为了解决上述问题,本研究提出了 PCM 的增强传导模型。一般来说,在从固态到液态的相变过程中,由于温度梯度的作用,熔融 PCM 会在腔体内流动。液态 PCM 流动会促进 PCM 内部的对流传热,从而提高总传热率。为了将对流效应考虑在内,PCM 的传热速率应在 PCM 熔化时得到提高。此外,当 PCM 完全融化时,每层 PCM 之间的温度梯度将继续推动对流传热。因此,为了包含上述对流换热效应,我们做了两个假设:(1)通过使用对数函数,熔化过程中 PCM 腔内的换热率与液体分数呈正相关;(2)完全熔化的 PCM 节点之间的换热率与它们的温度梯度呈正相关。基于上述假设,PCM 内部的传热速率 可表示为 (17) 其中, 为固态 PCM 的导热系数(W/(m K)); 为 PCM 节点完全转为液态时的传热速率升高值(W/(m K)); 和 为由 PCM 特性决定的常数; 和 为相邻两层 PCM 的温度(℃)。
根据公式 (17),模拟了 RT35 熔化过程中的传热率曲线,如图 6 所示。

Fig. 6. The heat transfer rate variation during the melting process.
图 6.熔化过程中的传热速率变化。
为了校准热阻模型,即确定式 (17) 中的两个常数 和 的值,我们使用了 CFD 仿真的结果与所提出的新模型的结果进行比较,因为 CFD 仿真方法在 PV-PCM 系统的研究中得到了广泛应用。 值是所有 PCM 网格完全熔化时从 CFD 模型得出的平均传热速率上升值,确定为 4.82。为了确定 和 的值,根据这两个值变化所造成的平均差异,将 CFD 模型模拟的熔化过程和对流过程与一维模型的结果进行了比较。最后,确定 和 分别为 10 和 2。校准后,模拟了一个 PV-PCM 系统,在 27 °C 环境温度和 900 W/m 2 太阳辐射条件下使用 30 mm RT35 PCM 进行验证。需要注意的是,在模拟过程中,PCM 室没有安装鳍片,这是因为在一维热阻模型中安装鳍片存在困难,而且鳍片的影响相当于热导率的某些变化。最后,根据模拟结果,两种方法的均方根偏差(RMSD)为 0.173,按数据范围计算的归一化均方根偏差(RMSD)为 0.5%,呈现出高度一致,如图 7 所示。此外,改进后的一维模型在缩短计算时间方面具有很大优势,在本例中比 CFD 模型快 300 多倍。因此,所提出的新模型是可靠和可行的,值得进一步研究。

Fig. 7. PV temperature profile modelled by CFD method (FLUENT program) and thermal resistance method (MATLAB program).
图 7.用 CFD 方法(FLUENT 程序)和热阻方法(MATLAB 程序)模拟的光伏温度曲线。
4. Study on different assumptions in mathematical modelling
4.数学建模中不同假设的研究
在文献中,人们在数学模型中做出了各种假设,但这些假设对结果的影响尚未得到充分报道。因此,作为首次尝试,我们研究了不同假设对模拟结果的影响,以确保进一步分析的准确性。现将三种常用假设总结如下:
- •
- •
- •Assumption 3: The PV module is treated as a layer of aluminum plate for simplification [31].
假设 3:为简化起见,将光伏组件视为一层铝板 [31]。
为了验证上述假设,模拟了一个典型的 PV-PCM 系统,环境温度为 25 °C,太阳辐射为 800 W/m 2 ,RT35 PCM 厚度为 30 mm,风速为零。
4.1. Assumption 1 – neglect of convective heat transfer within liquid PCM
4.1.假设 1 - 忽视液体 PCM 内部的对流传热
如前所述,由于一维热阻模型的固有缺陷,液体 PCM 中的对流传热通常被忽略,只考虑传导传热。然而,对流效应可能非常重要,因为当 PCM 溶化时,温度梯度会在液体 PCM 中产生大量流动,从而提高传热速率。根据公式 (17) 中新开发的 PCM 传热率模型,可以模拟这种对流传热对光伏温度的影响。
如图 8 所示,两种温度曲线之间存在明显差距。当考虑 PCM 中的对流传热时,PV 温度比不考虑对流传热的温度低 10 °C。因此,结论是假设 1 可能会导致一些重大误差,模拟中应考虑对流换热。

Fig. 8. PV temperature profile of PV-PCM system when the convective heat transfer is included and excluded.
图 8.包括和不包括对流传热时 PV-PCM 系统的光伏温度曲线。
4.2. Assumption 2 – neglect of radiative heat transfer with ambient
4.2.假设 2 - 忽略与周围环境的辐射热传递
值得研究的是忽略与环境的辐射传热对系统性能的影响。图 9 中的结果表明,如果不考虑与天空和地面的辐射散热,系统中 PCM 的熔化时间会缩短,光伏温度会上升得更快。在模拟结束时,由于热辐射在高温条件下的热传导中起着非常重要的作用,因此温差可达约 20 °C。因此,可以得出结论,辐射传热应包括在内。

Fig. 9. PV temperature profile of PV-PCM system when the radiative heat transfer is included and excluded.
图 9.包括和不包括辐射传热时 PV-PCM 系统的光伏温度曲线。
4.3. Assumption 3 – simplification of PV panel
4.3.假设 3 - 简化光伏电池板
参考文献 [31] 将光伏组件简化为铝板。[31].然而,由于光伏组件通常由玻璃、光伏电池、乙烯-醋酸乙烯(EVA)和 Tedlar-聚酯-Tedlar(TPT)组成,因此将光伏组件简化为铝板可能会导致不同的比热容和传导热传导率。本节将研究这种简化的影响。图 10 中的结果表明,两个温度曲线之间的差异并不大,平均差异约为±1.5 °C。因此,本节得出的结论是,将光伏组件简化为铝板可能会导致结果出现一些误差,但如果允许出现一些偏差,则是可以接受的。

Fig. 10. PV temperature profile of PV-PCM system when the PV module is simplified as an aluminum plate and non-simplified.
图 10.当光伏组件简化为铝板和非简化时,PV-PCM 系统的光伏温度曲线。
5. Sensitivity analysis of the PV-PCM system design
5.PV-PCM 系统设计的敏感性分析
在考虑了对流效应和辐射效应后,最终采用改进的热阻模型,从 300 多个不同配置和不同条件(即环境温度、风速和太阳辐射)的案例中优化 PV-PCM 系统的设计。
5.1. Investigation of the melting process
5.1.熔化过程调查
为了了解系统中的传热过程和熔化过程,我们尝试对一个具体案例进行了模拟。模拟结果如图 11 所示。与其他温度区间相比,光伏温度从 35 °C 升至 40 °C 所需的时间更长。这是有道理的,因为 RT35 的熔化温度范围为 29-36 °C,这表明在相变期间,PCM 可以吸收并储存大量潜热。PCM 完全熔化总共需要 120 分钟左右,然后光伏表面温度会在短时间内从 40 °C 迅速升至 60 °C 以上。具体来说,从 40 °C 升至 45 °C 只需约 15 分钟,而从 35 °C 升至 40 °C 则需要约 100 分钟。这一现象表明了 PCM 在光伏温度控制中的作用,尤其是在相变温度附近。

Fig. 11. (a) PV temperature variation and (b) liquid fraction variation at different depth of PV-PCM system during the melting process (PCM: RT35, PCM thickness: 30 mm, ambient temperature: 25 °C, solar radiation: 900 W/m2, wind speed: 0 m/s).
图 11.(a) 熔化过程中 PV-PCM 系统不同深度处的 PV 温度变化和 (b) 液体分数变化(PCM:RT35,PCM 厚度:30 毫米,环境温度:25 °C,太阳辐射:900 W/m 2 ,风速:0 m/s):30 毫米,环境温度:25 °C,太阳辐射:900 瓦/米2,风速:0 米/秒)。
从图 11(b) 中可以观察到 PCM 的熔化过程,图 11(b) 显示了熔化过程中沿 PCM 深度的液体分量。值得注意的是,虽然熔化每 10%的 PCM 所需的能量完全相同,但熔化前十分之一的 PCM 所需的时间比熔化后其他 PCM 所需的时间要短。这可以解释为,随着光伏温度的升高,自然空气对流导致的热量带走变得越来越密集。在本例中,PCM 完全熔化需要 143 分钟。
5.2. Sensitivity analysis on a single variable
5.2.单一变量的敏感性分析
本节研究了改变几个关键参数(即环境温度、太阳辐射、风速、PCM 厚度和潜热容量)对模拟结果的影响。具体而言,第 5.2-5.3 节以图表说明了 300 个案例的结果。这些章节还描述了案例的配置和边界条件。这种敏感性分析可以帮助设计人员了解不确定性的影响,也可以帮助建模人员确定假定输入的变化对特定系统配置的行为、可行性和经济性的影响。敏感性分析还可以检查特定系统配置的稳健性。也就是说,当初始条件发生变化时,该系统配置在其他情况下是否最优。
5.2.1. Ambient temperature
5.2.1.环境温度
对环境温度的敏感性分析可以帮助用户了解特定系统在不同地点或季节的性能。图 12 显示,随着环境温度的升高,模拟光伏温度也随之升高,熔化时间缩短。环境温度为 30 °C 时,整个 PCM 熔化过程仅需 1 小时左右,而环境温度为 20 °C 时则需要 2 小时以上。

Fig. 12. PV temperature profile of PV-PCM system under different ambient temperature.
图 12.不同环境温度下 PV-PCM 系统的光伏温度曲线。
为了使 PV-PCM 系统在高环境温度条件下(如上海)获得更好的性能,建议采用高熔融温度或高潜热容量。图 12 还表明,在模拟结束时,环境温度升高 5 °C 几乎会导致光伏温度的相同升高。
5.2.2. Solar radiation intensity
5.2.2.太阳辐射强度
本节将探讨太阳辐射强度如何影响系统性能。如图 13 所示,太阳辐射对系统性能有重大影响,太阳辐射越强,熔化时间越短,光伏温度越高。在这些情况下,所有 PCM 最终都会熔化。平均而言,当 PCM 完全熔化且 PV 温度趋于稳定时,太阳辐射每增加 100 W/m 2 会导致 PV 温度上升 5 °C。这一关系可用于预测实际应用中的温度变化。

Fig. 13. PV temperature profile of PV-PCM system under different solar radiation intensity.
图 13.不同太阳辐射强度下 PV-PCM 系统的光伏温度曲线。
5.2.3. Wind speed 5.2.3.风速
本节将讨论周围风速对系统性能的影响,据作者所知,其他研究尚未对此进行充分研究。图 14 显示,当风速从 0 m/s 增加到 1 m/s 时,风的散热效果显著,光伏温度降低了约 5 °C。然而,当风速继续上升时,这种温度降低就不那么明显了。图 14 还表明,不同风速对 PCM 熔化时间和 PV 温度的影响很小。

Fig. 14. PV temperature profile of PV-PCM system under different wind speed.
图 14.不同风速下 PV-PCM 系统的光伏温度曲线。
5.2.4. PCM thickness 5.2.4.PCM 厚度
图 15 研究了 PCM 厚度的影响,这是 PV-PCM 系统的关键参数之一。结果表明,与传统的纯光伏模块相比,PV-PCM 系统中的光伏温度最多可降低 35 °C。相应地,两个系统之间的最大输出差距可扩大到光伏参考输出功率的 17.5%。从图 15 中可以看出,厚度每增加 5 毫米,熔化时间平均延长约 10 分钟。

Fig. 15. PV temperature profile of PV-PCM systems with different PCM thickness.
图 15.不同 PCM 厚度的 PV-PCM 系统的光伏温度曲线。
另一个发现是,当 PCM 最终完全熔化时,PV-PCM 系统的光伏温度可能会高于传统的纯光伏系统。因此,有时 PCM 会成为 PV 面板背面散热的热阻,反而会增加 PV 温度。这种现象也可能发生在冬季,因为 PCM 的温度不会达到熔点。这突出表明,根据当地气候适当选择 PCM 厚度和熔点非常重要。因此,建议进一步研究全年的实际气候条件。
5.2.5. PCM latent heat capacity
5.2.5.PCM 潜热容量
另一个影响因素是 PCM 的潜热容量。图 16 显示了对 PCM RT35 潜热容量的敏感性分析。潜热容量对模拟结果的影响相当一致,潜热容量每增加 40 kJ/kg,熔化时间就会增加约 20 分钟。与图 15 相似,图 16 也表明熔融 PCM 可能成为热阻。

Fig. 16. PV temperature profile of PV-PCM systems with different latent heat capacities.
图 16.具有不同潜热容量的 PV-PCM 系统的光伏温度曲线。
5.3. Sensitivity analysis on two variables
5.3.两个变量的敏感性分析
本研究采用了双变量分析方法来优化系统配置。通过同时改变两个关键参数,包括 PCM 厚度、PCM 类型、太阳辐射、环境温度和风速,采用改进的热阻模型模拟不同的系统配置。模拟后,可获得基于两个变量的光伏温度和发电量的二维剖面图,也称为等值线图。双变量灵敏度分析方法可以生动地展示系统性能,对于同时考虑两个变量的研究人员和工程师优化系统设计非常有帮助。
5.3.1. Effects of solar radiation and PCM thickness
5.3.1.太阳辐射和 PCM 厚度的影响
图 17 和 18 显示了在环境温度为 25 °C 时模拟的系统性能。本分析使用 RT35 作为 PCM。根据图 17,可以根据太阳辐射强度和目标光伏温度确定最佳 PCM 厚度。例如,当太阳辐射为 800 W/m 2 时,如果光伏温度应控制在 60 °C 以下,则 PCM 厚度至少应为 35 mm。此外,根据图 17 中等温线的斜率,当太阳辐射处于较高水平时,如果只增加 PCM 厚度,则很难将光伏温度控制在较低值。不过,这并不意味着在高辐射区域应用 PV-PCM 系统不可行。

Fig. 17. PV temperature of systems with different PCM thickness and solar radiation after 5 h simulation.
图 17.模拟 5 小时后,采用不同 PCM 厚度和太阳辐射的系统的光伏温度。

Fig. 18. The electricity production improvement of PV-PCM system with different PCM thickness and solar radiation after 5 h simulation.
图 18.模拟 5 小时后,不同 PCM 厚度和太阳辐射下 PV-PCM 系统的发电量改善情况。
图 18 显示了相同条件下 PV-PCM 系统与传统纯光伏组件相比的发电量提升情况。事实上,随着太阳辐射的增加,PV-PCM 系统的性能会更好。PCM 的潜热能力可以将光伏温度控制在其熔化温度附近,而纯光伏系统的温度在太阳辐射水平较高时迅速升高。因此,两个系统之间的温差很大,加入 PCM 后,光伏转换效率会大幅提高。总体而言,经过 5 小时的模拟后,光电转换效率提高了 5%至 12%。
5.3.2. Effects of ambient temperature and PCM thickness
5.3.2.环境温度和 PCM 厚度的影响
图 19 和 20 讨论了 PCM 厚度和环境温度的影响。使用的是 PCM RT35,太阳辐射设定为 800 W/m 2 。图 19 显示,如果环境温度高于 PCM 的熔化温度范围,即 29-36 °C,则增加 PCM 厚度对光伏温度控制没有影响。如图 20 所示,当环境温度从 15 °C变为 35 °C时,光伏发电量的提高幅度开始增大,在环境温度约为 25 °C时达到峰值,随后出现明显的下降趋势。这一有趣的现象可以用 5 小时模拟期间纯光伏系统和 PV-PCM 系统之间的温度差来解释。在环境温度从 15 °C上升到 25 °C的初期,PCM 的潜热存储能力可以成功地将光伏温度控制在比纯光伏系统更低的值,因此在此范围内光伏功率的提高非常显著。但是,如果环境温度在 25 至 35 ° C 之间持续上升,由于环境温度接近或超过了 PCM 熔化温度范围的低边界,PCM 的熔化时间因潜热容量降低而大大缩短,这使得 PV-PCM 系统中的 PV 温度与纯 PV 系统接近或相等。因此,在环境温度较高时,PCM 的功率增强效果并不明显。因此,如本案例所示,建议在实际应用中使用熔化温度略高于环境温度的 PCM,例如 5 °C,以最大限度地提高光伏转换效率。

Fig. 19. PV temperature of systems with different PCM thickness and ambient temperature after five-hour simulation.
图 19.模拟 5 小时后,不同 PCM 厚度和环境温度下系统的光伏温度。

Fig. 20. The electricity production improvement of PV-PCM systems with different PCM thickness and ambient temperature after 5-h simulation.
图 20.模拟 5 小时后,不同 PCM 厚度和环境温度下 PV-PCM 系统的发电量改善情况。
6. Conclusions 6.结论
本研究建立了 PV-PCM 系统的数学模型。在对拟议的 PV-PCM 系统进行数值研究时,比较了 CFD 模型和一维热阻模型。结果发现,CFD 仿真无法执行大量的仿真案例,而传统的一维热阻模型无法求解熔融 PCM 的动量方程。因此,我们开发了一种改进的热阻模型,它比 CFD 方法消耗更少的计算时间,并能通过应用增强传导法将熔融 PCM 内的对流传热效应纳入其中。新开发的对流传热方程在 MATLAB 软件中进行了模拟,并通过 CFD 方法进行了验证,结果显示两者高度一致。改进后的热阻模型被进一步用于检验数学建模中几个常见假设的影响。结果表明,忽略对流传热、忽略辐射传热以及将光伏组件简化为铝酸盐板分别会导致光伏温度相差约 20 °C、10 °C 和 ±1.5 °C,这表明前两种假设是不合理的。此外,还完成了对 300 多个不同配置案例的研究。研究发现,太阳辐射是决定光伏温度的主要因素。结果表明,太阳辐射平均每增加 100 W/m 2 可导致光伏温度上升 5 °C。 此外,还进行了双变量敏感性分析,结果表明 PV-PCM 系统在高太阳辐射地区的应用潜力巨大,建议 PCM 的相变温度比环境温度高 5 ℃ 左右。相信本研究的结果能为实际应用中的 PV-PCM 系统优化提供一些参考。通过整合两种方法,即增强电导率法和双变量敏感性分析法,未来的研究将在全年实际气候条件下进行模拟。增强传导性方法还可以通过使用无量纲参数进一步发展,以扩大其在不同几何形状和属性中的应用。
Acknowledgments 致谢
作者感谢国家自然科学基金委员会(NSFC)通过 51506183 号基金提供的资金支持。特别感谢香港理工大学可再生能源研究组的同事为本项目提供的大力支持。
References
- [1]A feasibility study of a stand-alone hybrid solar–wind–battery system for a remote islandAppl Energy, 121 (2014), pp. 149-158
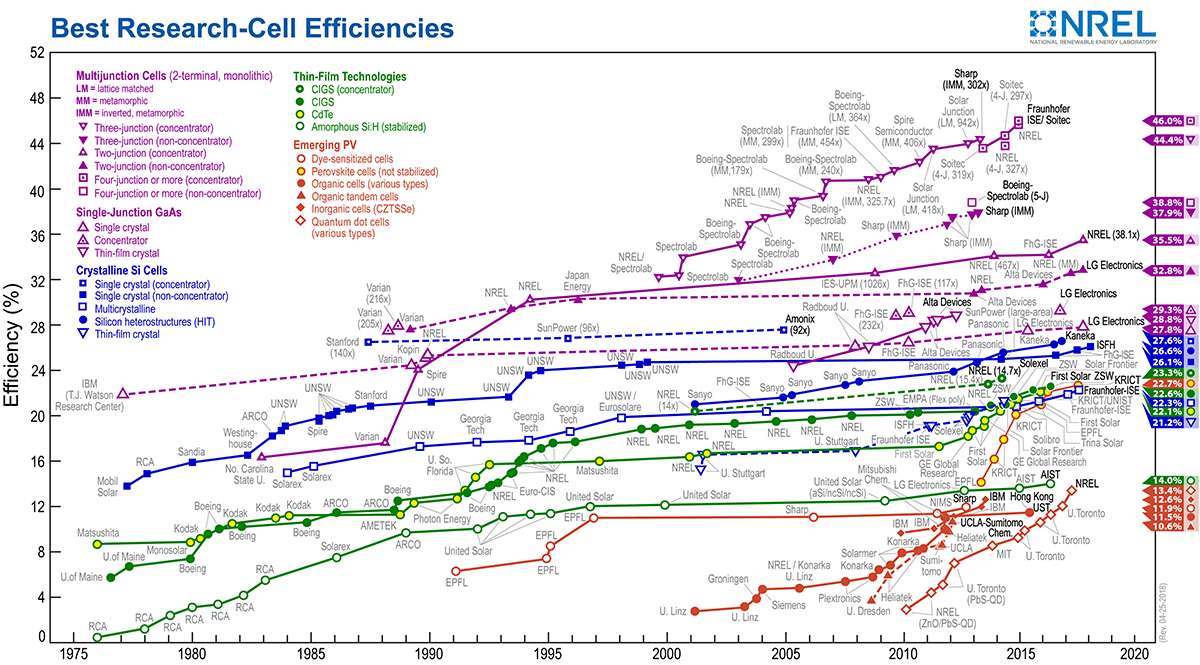
- [2]National Renewable Energy Laboratory, Best Research-Cell Efficiencies, Retrieved from: <https://www.nrel.gov/pv/assets/images/efficiency-chart.png>; 2018.
- [3]Solar photovoltaic system modeling and performance predictionRenew Sustain Energy Rev, 36 (2014), pp. 304-315
- [4]Solar power generation by PV (photovoltaic) technology: a reviewEnergy., 53 (2013), pp. 1-13
- [5]Development of a model to simulate the performance characteristics of crystalline silicon photovoltaic modules/strings/arraysSol Energy, 100 (2014), pp. 31-41
- [6]A review of solar collectors and thermal energy storage in solar thermal applicationsAppl Energy, 104 (2013), pp. 538-553
- [7]On the temperature dependence of photovoltaic module electrical performance: a review of efficiency/power correlationsSol Energy, 83 (2009), pp. 614-624
- [8]Performance evaluation of a stand-alone photovoltaic system on an isolated island in Hong KongAppl Energy, 112 (2013), pp. 663-672
- [9]PV thermal systems: PV panels supplying renewable electricity and heatProg Photovolt Res Appl, 12 (2004), pp. 415-426
- [10]Using phase change materials in photovoltaic systems for thermal regulation and electrical efficiency improvement: a review and outlookRenew Sustain Energy Rev, 43 (2015), pp. 1273-1284
- [11]Economical assessment and applications of photovoltaic/thermal hybrid solar technology: a reviewSol Energy, 153 (2017), pp. 540-561
- [12]A review of solar photovoltaic systems cooling technologiesRenew Sustain Energy Rev, 79 (2017), pp. 192-203
- [13]Thermal management systems for Photovoltaics (PV) installations: a critical reviewSol Energy, 97 (2013), pp. 238-254
- [14]Evaluation of phase change materials for thermal regulation enhancement of building integrated photovoltaicsSol Energy, 84 (2010), pp. 1601-1612
- [15]Thermal performance testing and analysis of photovoltaic modules in natural sunlightJet Propulsion Laboratory, Pasadena (California) (1978)
- [16]Phase change materials for limiting temperature rise in building integrated photovoltaicsSol Energy, 80 (2006), pp. 1121-1130
- [17]Thermal regulation of building-integrated photovoltaics using phase change materialsInt J Heat Mass Transf, 47 (2004), pp. 2715-2733
- [18]Natural convection in an internally finned phase change material heat sink for the thermal management of photovoltaicsSol Energy Mater Sol Cells, 95 (2011), pp. 1598-1603
- [19]Comparison of predictions made using a new 3D phase change material thermal control model with experimental measurements and predictions made using a validated 2D modelHeat Transf Eng, 28 (2007), pp. 31-37
- [20]Energy and cost saving of a photovoltaic-phase change materials (PV-PCM) system through temperature regulation and performance enhancement of photovoltaicsEnergies, 7 (2014), pp. 1318-1331
- [21]Yearly energy performance of a photovoltaic-phase change material (PV-PCM) system in hot climateSol Energy, 146 (2017), pp. 417-429
- [22]Impact of integrated photovoltaic-phase change material system on building energy efficiency in hot climateEnergy Build, 130 (2016), pp. 495-505
- [23]Thermal and electrical performance of an integrated PV-PCM system in double skin façades: a numerical studySol Energy, 136 (2016), pp. 112-124
- [24]Application of a phase-change material to improve the electrical performance of vertical-building-added photovoltaics considering the annual weather conditionsSol Energy, 105 (2014), pp. 561-574
- [25]Experimental study of phase change materials for photovoltaic modules: energy performance and economic yield for the EPEX spot marketSol Energy, 140 (2016), pp. 51-59
- [26]Performance enhancement of a building-integrated photovoltaic module using phase change materialEnergy (2017)
- [27]Global analysis of photovoltaic energy output enhanced by phase change material coolingAppl Energy, 126 (2014), pp. 21-28
- [28]Field thermal performance of naturally ventilated solar roof with PCM heat sinkSol Energy, 86 (2012), pp. 2504-2514
- [29]Performance analysis of tilted photovoltaic system integrated with phase change material under varying operating conditionsEnergy (2017)
- [30]Thermal performance of a hybrid BIPV-PCM: modeling, design and experimental investigationEnergy Procedia, 48 (2014), pp. 474-483
- [31]Phase-change materials to improve solar panel's performanceEnergy Build, 62 (2013), pp. 59-67
- [32]Self regulation of photovoltaic module temperature in V-trough using a metal–wax composite phase change matrixSol Energy, 85 (2011), pp. 1805-1816
- [33]Performance study and analysis of an inclined concentrated photovoltaic-phase change material systemSol Energy, 150 (2017), pp. 229-245
- [34]Performance modeling and techno-economic analysis of a modular concentrated solar power tower with latent heat storageAppl Energy, 217 (2018), pp. 143-152
- [35]Photovoltaic module temperature stabilization with the use of phase change materialsSol Energy, 150 (2017), pp. 538-545
- [36]Energy balance model of combined photovoltaic solar-thermal system incorporating phase change materialSol Energy, 85 (2011), pp. 1440-1446
- [37]Design of a novel concentrating photovoltaic–thermoelectric system incorporated with phase change materialsEnergy Convers Manage, 112 (2016), pp. 49-60
- [38]Nano-enhanced phase change material for thermal management of BICPVAppl Energy, 208 (2017), pp. 719-733
- [39]Thermal and electrical performance of a BIPV integrated with a microencapsulated phase change material layerEnergy Build, 50 (2012), pp. 331-338
- [40]Investigation of pork fat as potential novel phase change material for passive cooling applications in photovoltaicsJ Clean Prod, 170 (2018), p. 1006
- [41]Improving the efficiency of photovoltaic cells using PCM infused graphite and aluminium finsSol Energy, 114 (2015), pp. 217-228
- [42]Numerical and experimental study on temperature control of solar panels with form-stable paraffin/expanded graphite composite PCMEnergy Convers Manage, 149 (2017), pp. 416-423
- [43]Annual performance enhancement of building integrated photovoltaic modules by applying phase change materialsProg Photovolt Res Appl, 21 (2013), pp. 620-630
- [44]Heat transfer studies of photovoltaic panel coupled with phase change materialSol Energy, 140 (2016), pp. 151-161
- [45]Finite difference thermal model of a latent heat storage system coupled with a photovoltaic device: description and experimental validationRenew Energy, 68 (2014), pp. 181-193
- [46]A review of the composite phase change materials: fabrication, characterization, mathematical modeling and application to performance enhancementAppl Energy, 165 (2016), pp. 472-510
- [47]Scaling theory of melting with natural convection in an enclosureInt J Heat Mass Transf, 31 (1988), pp. 1221-1235
- [48]A simplified numerical model for melting of ice with natural convectionInt Commun Heat Mass Transf, 25 (1998), pp. 359-368
- [49]Heat transferMcGraw-Hill Education, New York (2009)
- [50]Numerical simulation of a latent heat thermal energy storage system with enhanced heat conductionEnergy Convers Manage, 39 (1998), pp. 319-330
- [51]Melting of a phase change material in presence of natural convection and radiation: a simplified modelAppl Therm Eng, 130 (2018), pp. 660-671
- [52]An enhanced thermal conduction model for the prediction of convection dominated solid–liquid phase changeInt J Heat Mass Transf, 52 (2009), pp. 1753-1760
- [53]Heat transfers in a double-skin roof ventilated by natural convection in summer timeEnergy Build, 40 (2008), pp. 1487-1497
- [54]Incropera FP. Fundamentals of heat and mass transferJohn Wiley & Sons (2011)
- [55]A parametric study about the potential to integrate phase change material into photovoltaic panelEnergy Procedia, 142 (2017), pp. 648-654
- [56]A finite difference model of a PV-PCM systemEnergy Procedia, 30 (2012), pp. 198-206
- [57]On the efficacy of PCM to shave peak temperature of crystalline photovoltaic panels: an FDM model and field validationEnergies, 6 (2013), pp. 6188-6210
Cited by (115)
A comprehensive review and outlook of bifacial photovoltaic (bPV) technology
2020, Energy Conversion and ManagementNanofluid based photovoltaic thermal systems integrated with phase change materials: Numerical simulation and thermodynamic analysis
2020, Energy Conversion and ManagementPhotovoltaic panel integrated with phase change materials (PV-PCM): technology overview and materials selection
2019, Renewable and Sustainable Energy Reviews